CBD Patches Market Size, Share, Growth and Forecast (2026 - 2036)
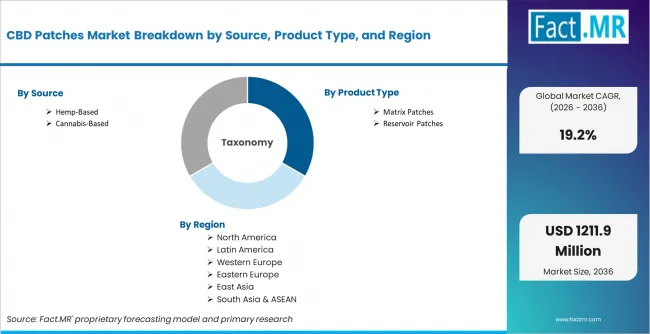
The CBD Patches Market is segmented by Source (Hemp-Based CBD Patches, Cannabis-Based CBD Patches). It is segmented by Product Type (Matrix Patches, Reservoir Patches, Drug-In-Adhesive Patches). It is segmented by Function (Inflammation & Pain Relief, Anxiety & Stress Reduction, Knee Osteoarthritis Management, Other Functions). It is segmented by Sales Channel (Offline Retail, Online Platforms). It is segmented by CBD Spectrum (CBD Isolate, Broad-Spectrum CBD, Full-Spectrum CBD). Forecast for 2026 to 2036.
Fact.MR states that CBD patch demand is moving toward wellness products that deliver CBD through the skin. Brands need patches with consistent cannabinoid content and reliable adhesion during use. Retailers need products with test records and careful claim control.
CBD Patches Market Size, Market Forecast and Outlook by Fact.MR
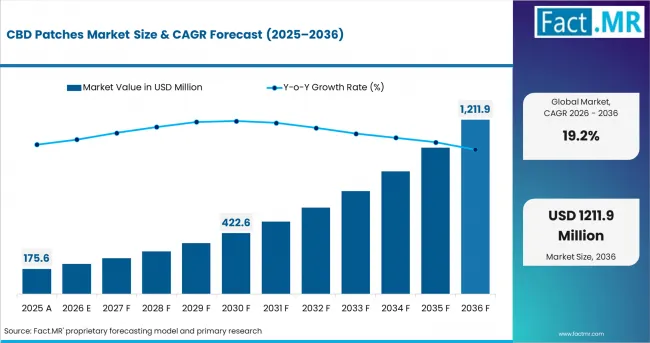
- The CBD patches market was valued at USD 175.6 million in 2025.
- Demand is estimated to reach USD 209.3 million in 2026. The market is projected to record 19.2% CAGR from 2026 to 2036.
- Transdermal CBD formats and hemp-based product access are forecast to lift the market to USD 1,211.9 million by 2036.
| Metric | Details |
|---|---|
| Industry Size (2026) | USD 209.3 million |
| Industry Value (2036) | USD 1,211.9 million |
| CAGR (2026 to 2036) | 19.2% |
Summary of CBD Patches Market
- Demand Drivers in the Market
- Transdermal Format: CBD patch give consumers a skin-applied option from oils and gummies. This format supports product differentiation.
- Hemp-Based Access: Hemp-based CBD patches can enter more retail channels in markets that allow low-THC products. This supports retail entry for compliant brands.
- Digital Retail: Online platforms help consumers compare CBD strength and patch duration. Clear product labels can improve trust and repeat use.
- Key Segments Analyzed
- By Source: Hemp-based CBD patches are projected to record 78.0% share in 2026 as low-THC positioning supports wider retail access.
- By Product Type: Matrix patches lead because CBD can be dispersed through the patch structure. The segment is expected to hold 47.0% share in 2026.
- By Function: Inflammation & pain relief is projected to account for 46.0% share in 2026 because patch brands often position products around localized discomfort.
- By Sales Channel: Online platforms lead as consumers compare dose and patch duration before purchase. The channel is estimated to hold 54.0% share in 2026.
- By CBD Spectrum: Broad-spectrum CBD is projected to account for 42.0% share in 2026 because brands can position cannabinoid variety with lower THC concern.
- By Geography: China CBD patches demand is forecast to grow at 20.8% CAGR from 2026 to 2036 as wellness interest and online access support selective adoption.
- Analyst Opinion at Fact.MR
- Shambhu Nath Jha, Senior Analyst at Fact.MR, states, “CBD patch demand is moving beyond novelty. Brands need controlled release and compliant claims. Suppliers that combine formulation discipline with testing support can protect repeat demand.”
- Strategic Implications
- Claim Control: CBD patch brands must avoid unsupported disease claims. Label review remains central to retail access.
- Release Performance: Patch makers need products that stay on the skin and deliver consistent CBD content during use. Poor adhesion or uneven CBD levels can reduce repeat purchase.
- Testing Support: Retailers need clear THC test results and certificates of analysis before listing CBD patches. Weak documentation can delay or block retail entry.
CBD patch demand is rising because patches offer a skin-applied delivery format that differs from oils and gummies. Brands can position patches around sustained release and longer wear time. Product quality is important because the patch must stay in place during use and the CBD content must match the label. Retailers are also more likely to accept products with clear test records and compliant product claims.
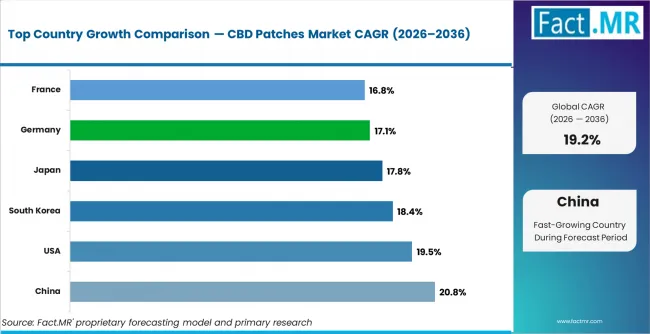
China is forecast to grow at 20.8% CAGR from 2026 to 2036 as wellness interest and online access support selective adoption. United States demand is likely to rise at 19.5% CAGR through CBD retail familiarity. South Korea is projected to record 18.4% CAGR by 2036 as medical cannabis access develops. Japan is forecast to post 17.8% CAGR through quality-focused wellness demand. Germany follows at 17.1% CAGR through regulated CBD retail. France may register 16.8% CAGR through specialty retail access.
Segmental Analysis
CBD Patches Market Analysis by Source
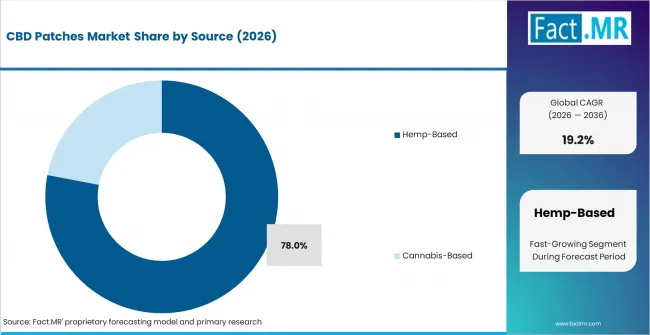
Hemp-based CBD patches are projected to record 78.0% share in 2026 because low-THC products face fewer retail barriers than marijuana-derived CBD formats. The CDC defines hemp as cannabis with no more than 0.3% THC and notes that CBD does not cause impairment by itself. [1] Hemp-based patches lead because source documentation can support compliant wellness positioning.
- Hemp Access: Hemp-based patches support wider CBD product availability. Brands need THC testing and source documentation.
- Cannabis Channel: Cannabis-based patches serve restricted markets. Access depends on medical or adult-use rules.
- Source Control: Source selection affects distribution. Retailers need clear cannabinoid records.
CBD Patches Market Analysis by Product Type
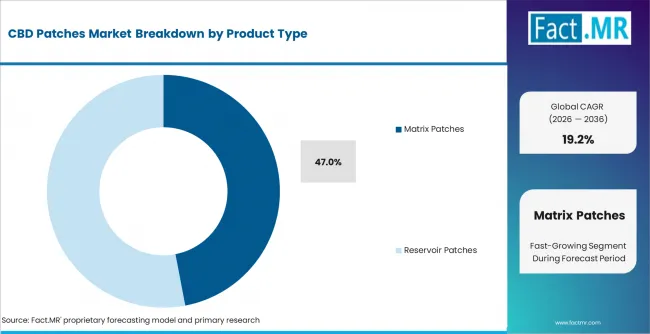
Matrix patches are projected to hold 47.0% share in 2026 because they use a simpler patch design. CBD is mixed into the adhesive polymer layer rather than being held in a separate reservoir. A 2025 review explains that matrix patches disperse the active ingredient within an adhesive polymer matrix. Reservoir patches use a separate drug reservoir, which adds design complexity. [2] This makes matrix patches more practical for commercial CBD brands that need scalable production and consistent release.
- Matrix Design: Matrix patches support simpler CBD dispersion. Manufacturers can scale production with fewer structural parts.
- Reservoir Control: Reservoir patches support controlled release. Higher design complexity can raise production cost.
- Adhesive Performance: Patch adhesion affects wear time. Product developers need skin comfort and reliable attachment.
CBD Patches Market Analysis by Function
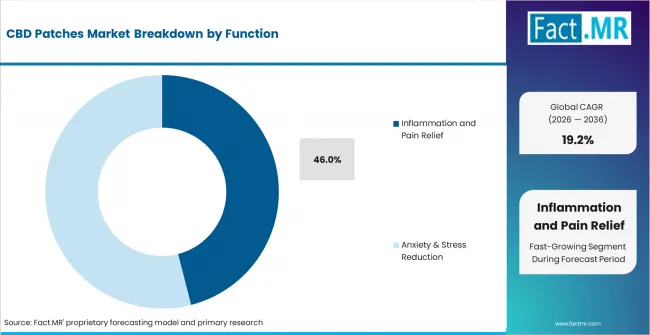
Inflammation and pain relief is projected to account for 46.0% share in 2026. Many CBD patch products are marked for localized discomfort because the patch is applied directly to the skin. The Arthritis Foundation states that animal studies and some small human studies suggest CBD may have pain-relieving and anti-inflammatory properties. It also notes that stronger human evidence is still needed. [3]
- Pain Positioning: Pain relief claims need careful wording. Brands must avoid unapproved disease treatment claims.
- Stress Support: Stress products rely on wellness positioning. Retailers need conservative labels.
- Knee Use: Knee osteoarthritis positioning needs stronger evidence. Medical claims can activate review.
CBD Patches Market Analysis by Sales Channel
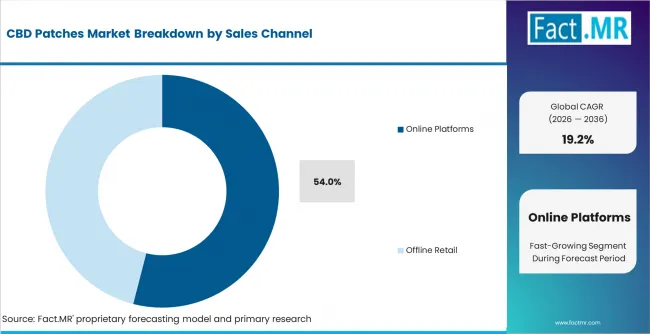
Online platforms lead as consumers compare CBD strength and patch duration. Offline retail supports pharmacies and wellness stores. Online platforms are estimated to hold 54.0% share in 2026 because consumers often review testing documents before selecting a product. Brand websites and e-commerce pages give companies more space to explain patch format and lab verification.
- Digital Access: Online platforms support product education. Brands can explain dose and patch duration clearly.
- Pharmacy Route: Offline retail helps build trust in regulated markets. Pharmacist access can support cautious users.
- Specialty Stores: Wellness stores serve repeat CBD users. Staff education helps explain patch use.
CBD Patches Market Analysis by CBD Spectrum
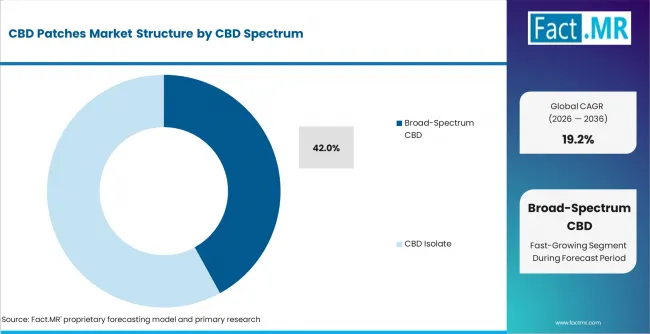
Broad-spectrum CBD is projected to account for 42.0% share in 2026 because brands can offer wider cannabinoid content with lower THC concern. CBD isolate serves products that need clear THC-free positioning. Full-spectrum patches serve channels that allow broader cannabinoid claims. Broad-spectrum CBD leads because it helps brands balance product differentiation with easier compliance positioning.
- Broad-Spectrum Position: Broad-spectrum CBD supports differentiated products. Brands can reduce THC-led friction.
- Isolate Demand: CBD isolate supports THC-free claims. This format needs strong testing and batch records.
- Full-Spectrum Limits: Full-spectrum patches may face tighter channel control. Retail access depends on local rules.
CBD Patches Market Drivers, Restraints, and Opportunities
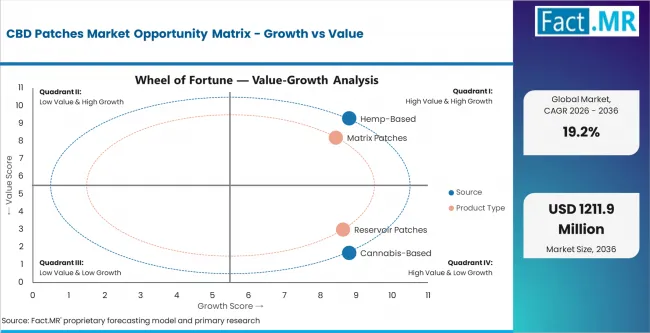
Transdermal product development and wider hemp-derived CBD access are the main growth drivers. Patches give brands an alternative to oral CBD formats. Online retail helps explain dosage and wear time. Specialty stores support guided product education for new users.
Regulatory uncertainty is the main restraint. CBD products face close review in major markets. Pain relief or medical claims can increase compliance risk. Patch brands need test records and conservative labels before wider retail entry.
Opportunities in the CBD Patches Market
- Matrix Patch Scale: Manufacturers can expand matrix patch formats. The design supports simpler production and repeatable release positioning.
- Compliance-Led Retail: Brands can use testing and conservative labels to enter pharmacies. Retail trust depends on documentation.
- Evidence Building: Patch makers can support product credibility through delivery research. Stronger evidence can improve professional acceptance.
Regional Analysis
Based on regional analysis, the CBD patches market is segmented into North America, Latin America, Europe, East Asia, South Asia and Oceania, and Middle East and Africa.
.webp)
Country CAGR (2026 to 2036)
| Country | CAGR |
|---|---|
| China | 20.8% |
| United States | 19.5% |
| South Korea | 18.4% |
| Japan | 17.8% |
| Germany | 17.1% |
| France | 16.8% |
Source: Fact.MR analysis based on adjusted forecast model and primary research.
East Asia CBD Patches Market Analysis
East Asia demand comes from wellness interest and strict product controls. China grows through online discovery and hemp-linked product awareness. Japan and South Korea develop more selectively through controlled CBD access.
- China: China CBD patches demand is forecast to grow at 20.8% CAGR from 2026 to 2036 as wellness interest and online access support selective adoption. KPMG states that health-related consumption gained momentum in China in 2025 through proactive health spending and TCM-inspired wellness. [4] China grows through online product education and wellness retail interest.
- South Korea: South Korea demand is linked to controlled medical cannabis access and wellness technology interest. Consumer CBD access remains cautious. The country is projected to record 18.4% CAGR by 2036. Patch suppliers need testing records and careful positioning.
- Japan: The Japan CBD patches market is supported by quality-focused wellness demand and strict THC control. Brands need clean test records and clear non-impairing product positioning. Japan is forecast to post 17.8% CAGR over the study period as CBD patch formats gain attention among wellness users. Specialty wellness channels can support education around wear time and product safety. Growth will depend on safety-led positioning and trusted retail guidance.
North America CBD Patches Market Analysis
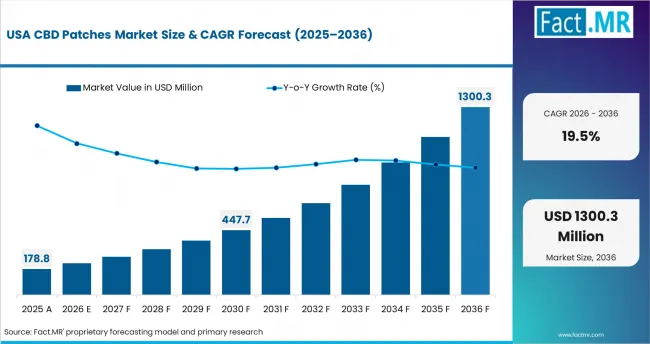
North America demand is supported by hemp-derived CBD access and retail familiarity. The United States leads regional value because CBD products already have broad consumer awareness. Compliance risk still shapes channel access.
- United States: United States demand is forecast to rise at 19.5% CAGR through 2036 as hemp-derived CBD access supports patch adoption. CBD patch brands need clear test records and careful label wording because health claims are closely reviewed. Growth will come from better CBD awareness and rising interest in skin-applied products then oils or gummies.
Europe CBD Patches Market Analysis
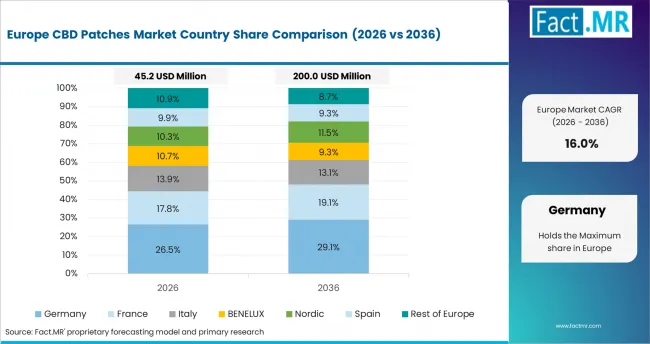
Europe demand comes from novel food review and cautious CBD retail. Germany and France support adoption through specialty wellness channels.
- Germany: Germany is forecast to grow at 17.1% CAGR from 2026 to 2036 as regulated wellness retail and CBD consumer awareness support demand. A 2025 German survey states that over-the-counter CBD products are sold online and used for general health or well-being. [5] Brands with reliable testing can build channel trust. Germany grows through quality-focused retail and regulatory screening.
- France: France CBD patches demand is supported by improving specialty retail access. French retailers need conservative labels and clear product testing. France CBD patches demand is projected to record 16.8% over the forecast period as brands separate wellness positioning from medical claims. Specialty retail education can help users understand patch wear time and CBD content.
Competitive Aligners for Market Players
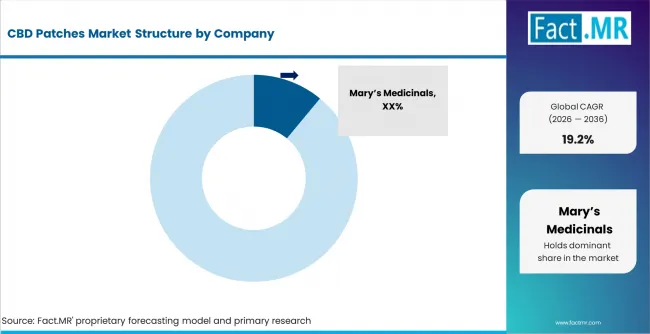
The CBD patches market includes active CBD patch brands and CBD product suppliers. Mary’s Medicinals has active transdermal patch products. PureKana shows a CBD transdermal patch page. BRITISH CANNABIS has an active CBD patches page. operates as a CBD manufacturer and supplier.
Competitive strength depends on release control and documentation. Patch suppliers need clean labels and batch testing. Retailers need clear CBD source records. Brands that combine patch performance with compliance support can protect repeat demand.
Supplier position will rely on formulation control through 2036. Matrix patch makers need consistent CBD dispersion. Reservoir patch suppliers need release control. Online sellers need strong product education. Companies that combine performance with documentation can protect repeat demand.
Key Players in CBD Patches Market
- Mary’s Medicinals
- PureKana
- BRITISH CANNABIS
- Social CBD
- The Good Patch
- KLORIS
Bibliography
- [1] Centers for Disease Control and Prevention. (2025, January 31). About CBD. CDC.
- [2] Singh, V., et al. (2025, January). Recent advances in transdermal patches. International Journal of Biology, Pharmacy and Allied Sciences, 14(1).
- [3] Arthritis Foundation. (2024). CBD for arthritis pain: What you should know. Arthritis Foundation.
- [4] KPMG China. (2026, March). Bi-annual report on the consumer & retail sector in China, 2025 H2.
- [5] Weissgerber, A., Hermanns-Clausen, M., & Lamy, E. (2025). Over the counter CBD products in Germany: An exploratory survey about consumption patterns and health related effects. Frontiers in Pharmacology, 16, Article 1571025.
This Report Addresses
- Strategic intelligence on CBD patch demand across hemp-based and cannabis-based products.
- Growth opportunity mapping across China and the United States plus and South Korea.
- Segment analysis by source, product type, function, sales channel, and CBD spectrum.
- Regional outlook covering CBD regulation, transdermal delivery interest, online retail access, and compliance-led product screening.
- Competitive analysis of Mary’s Medicinals, PureKana, BRITISH CANNABIS, and .
- Product assessment covering hemp-derived patches, matrix patches, broad-spectrum CBD formats, and drug-in-adhesive systems.
- Report delivered through PDF, Excel datasets, and presentation formats.
- Primary interviews, supplier checks, and transdermal CBD demand review support validation.
CBD Patches Market Definition
The CBD patches market covers adhesive transdermal products that contain cannabidiol. These products are applied to the skin for gradual release. The market differs from oral CBD formats because patch value depends on adhesion and release profile. It includes hemp-based and cannabis-based CBD patches.
CBD Patches Market Inclusions
The scope includes hemp-based CBD patches and cannabis-based CBD patches. Matrix patches and reservoir patches are included. Drug-in-adhesive patches are covered. Offline retail and online platforms are counted when products meet local rules.
CBD Patches Market Exclusions
The scope excludes CBD gummies and oils. Tinctures and capsules are outside scope. CBD beverages and creams are excluded because they are not patch formats. THC-led patches are excluded unless CBD is the main positioned cannabinoid.
CBD Patches Market Research Methodology
- Primary Research
- Primary research includes interviews with CBD patch manufacturers and transdermal formulation specialists. Retailers were reviewed for channel behavior. Ingredient suppliers were reviewed for CBD source validation. Supplier checks supported product type assumptions.
- Desk Research
- Desk research reviewed CBD regulatory guidance and transdermal delivery literature. Product labels supported format checks. Hemp rules supported source analysis. Safety guidance supported claim boundary review.
- Market-Sizing and Forecasting
- Forecasting uses source demand and product type adoption. Function demand is linked to wellness positioning and patch duration. Sales channel estimates reflect digital discovery and specialty retail access.
- Data Validation and Update Cycle
- Forecasts are validated through supplier checks and retail review. Regional assumptions are reviewed with CBD policy updates. Product assumptions are reviewed with patch format evidence.
Scope of the Report

| Attribute | Details |
|---|---|
| Quantitative Units | USD 209.3 million in 2026 to USD 1,211.9 million by 2036 at 19.2% CAGR |
| Market Definition | Adhesive transdermal cannabidiol patch products used for skin-applied CBD delivery. |
| Source | Hemp-Based CBD Patches , Cannabis-Based CBD Patches |
| Product Type | Matrix Patches , Reservoir Patches , Drug-In-Adhesive Patches |
| Function | Inflammation & Pain Relief , Anxiety & Stress Reduction , Knee Osteoarthritis Management , Other Functions |
| Sales Channel | Offline Retail , Online Platforms |
| CBD Spectrum | CBD Isolate , Broad-Spectrum CBD , Full-Spectrum CBD |
| Regions Covered | North America , Latin America , Europe , East Asia , South Asia and Oceania , Middle East and Africa |
| Countries Covered | China , United States , South Korea , Japan , Germany , France |
| Key Companies Profiled | Mary’s Medicinals , PureKana , BRITISH CANNABIS, |
| Forecast Period | 2026 to 2036 |
| Approach | Hybrid top-down and bottom-up model using source mix and product type. Function demand and channel use were validated through supplier checks. |
CBD Patches Market Analysis by Segments
-
By Source:
- Hemp-Based CBD Patches
- Cannabis-Based CBD Patches
-
By Product Type:
- Matrix Patches
- Reservoir Patches
- Drug-In-Adhesive Patches
-
By Function:
- Inflammation & Pain Relief
- Anxiety & Stress Reduction
- Knee Osteoarthritis Management
- Other Functions
-
By Sales Channel:
- Offline Retail
- Online Platforms
-
By CBD Spectrum:
- CBD Isolate
- Broad-Spectrum CBD
- Full-Spectrum CBD
-
Region:
- North America
- United States
- Canada
- Europe
- Germany
- France
- Italy
- Spain
- Asia Pacific
- China
- Japan
- South Korea
- Taiwan
- Singapore
- Latin America
- Brazil
- Mexico
- Argentina
- Middle East & Africa
- GCC Countries
- South Africa
- Israel
- North America
- Frequently Asked Questions -
How large is the CBD patches market in 2025?
The CBD patches market was valued at USD 175.6 million in 2025 based on Fact.MR’s public base.
What is the expected value of the CBD patches market in 2026?
The CBD patches market is estimated to reach USD 209.3 million in 2026 after the forecast period adjustment.
What is the forecast value of the CBD patches market by 2036?
The CBD patches market is forecast to reach USD 1,211.9 million by 2036 as transdermal CBD formats expand.
What CAGR is projected for the CBD patches market from 2026 to 2036?
Fact.MR’s adjusted forecast projects 19.2% CAGR for the CBD patches market from 2026 to 2036.
Which source leads the CBD patches market?
Hemp-based CBD patches lead with 78.0% share in 2026 because low-THC positioning supports wider access.
Why do hemp-based CBD patches lead demand?
Hemp-based CBD patches lead because compliant hemp sourcing supports wider wellness retail positioning.
Which product type leads the CBD patches market?
Matrix patches lead with 47.0% share in 2026 because they support simpler production and stable release positioning.
Which function leads the CBD patches market?
Inflammation & pain relief leads with 46.0% share in 2026 because localized discomfort is a common patch-use position.
Which sales channel leads the CBD patches market?
Online platforms lead with 54.0% share in 2026 because consumers compare CBD strength and patch duration digitally.
Which CBD spectrum leads the CBD patches market?
Broad-spectrum CBD leads with 42.0% share in 2026 because brands can position cannabinoid variety with lower THC concern.
Which country grows fastest in the CBD patches market?
China is forecast to grow fastest at 20.8% CAGR from 2026 to 2036.
Why is the United States important in the CBD patches market?
The United States is important because hemp-derived CBD access and retail familiarity support product adoption.
Why does South Korea show growth in the CBD patches market?
South Korea grows through controlled CBD access and wellness technology interest.
What drives CBD patches market growth?
Transdermal delivery interest and hemp-derived CBD access drive CBD patch demand.
What restrains CBD patches market growth?
Regulatory uncertainty and unsupported health claims restrain growth.
How do matrix patches support CBD delivery?
Matrix patches support CBD delivery by dispersing CBD through the patch structure.
What is included in the CBD patches market scope?
The scope includes hemp-based patches and cannabis-based patches. Matrix patches and reservoir patches are included.
What is excluded from the CBD patches market scope?
The scope excludes CBD oils and gummies. It excludes tinctures and beverages.
How does Fact.MR forecast CBD patches demand?
Fact.MR forecasts demand using source mix and product type. Function demand and channel use are validated through supplier checks.
Table of Content
- Executive Summary
- Global Market Outlook
- Demand to side Trends
- Supply to side Trends
- Technology Roadmap Analysis
- Analysis and Recommendations
- Market Overview
- Market Coverage / Taxonomy
- Market Definition / Scope / Limitations
- Research Methodology
- Chapter Orientation
- Analytical Lens and Working Hypotheses
- Market Structure, Signals, and Trend Drivers
- Benchmarking and Cross-market Comparability
- Market Sizing, Forecasting, and Opportunity Mapping
- Research Design and Evidence Framework
- Desk Research Programme (Secondary Evidence)
- Company Annual and Sustainability Reports
- Peer-reviewed Journals and Academic Literature
- Corporate Websites, Product Literature, and Technical Notes
- Earnings Decks and Investor Briefings
- Statutory Filings and Regulatory Disclosures
- Technical White Papers and Standards Notes
- Trade Journals, Industry Magazines, and Analyst Briefs
- Conference Proceedings, Webinars, and Seminar Materials
- Government Statistics Portals and Public Data Releases
- Press Releases and Reputable Media Coverage
- Specialist Newsletters and Curated Briefings
- Sector Databases and Reference Repositories
- Fact.MR Internal Proprietary Databases and Historical Market Datasets
- Subscription Datasets and Paid Sources
- Social Channels, Communities, and Digital Listening Inputs
- Additional Desk Sources
- Expert Input and Fieldwork (Primary Evidence)
- Primary Modes
- Qualitative Interviews and Expert Elicitation
- Quantitative Surveys and Structured Data Capture
- Blended Approach
- Why Primary Evidence is Used
- Field Techniques
- Interviews
- Surveys
- Focus Groups
- Observational and In-context Research
- Social and Community Interactions
- Stakeholder Universe Engaged
- C-suite Leaders
- Board Members
- Presidents and Vice Presidents
- R&D and Innovation Heads
- Technical Specialists
- Domain Subject-matter Experts
- Scientists
- Physicians and Other Healthcare Professionals
- Governance, Ethics, and Data Stewardship
- Research Ethics
- Data Integrity and Handling
- Primary Modes
- Tooling, Models, and Reference Databases
- Desk Research Programme (Secondary Evidence)
- Data Engineering and Model Build
- Data Acquisition and Ingestion
- Cleaning, Normalisation, and Verification
- Synthesis, Triangulation, and Analysis
- Quality Assurance and Audit Trail
- Market Background
- Market Dynamics
- Drivers
- Restraints
- Opportunity
- Trends
- Scenario Forecast
- Demand in Optimistic Scenario
- Demand in Likely Scenario
- Demand in Conservative Scenario
- Opportunity Map Analysis
- Product Life Cycle Analysis
- Supply Chain Analysis
- Investment Feasibility Matrix
- Value Chain Analysis
- PESTLE and Porter’s Analysis
- Regulatory Landscape
- Regional Parent Market Outlook
- Production and Consumption Statistics
- Import and Export Statistics
- Market Dynamics
- Global Market Analysis 2021 to 2025 and Forecast, 2026 to 2036
- Historical Market Size Value (USD Million) Analysis, 2021 to 2025
- Current and Future Market Size Value (USD Million) Projections, 2026 to 2036
- Y to o to Y Growth Trend Analysis
- Absolute $ Opportunity Analysis
- Global Market Pricing Analysis 2021 to 2025 and Forecast 2026 to 2036
- Global Market Analysis 2021 to 2025 and Forecast 2026 to 2036, By Component
- Introduction / Key Findings
- Historical Market Size Value (USD Million) Analysis By Component , 2021 to 2025
- Current and Future Market Size Value (USD Million) Analysis and Forecast By Component , 2026 to 2036
- Drives and Controllers
- Actuators and Motors
- Sensors and Vision
- Drives and Controllers
- Y to o to Y Growth Trend Analysis By Component , 2021 to 2025
- Absolute $ Opportunity Analysis By Component , 2026 to 2036
- Global Market Analysis 2021 to 2025 and Forecast 2026 to 2036, By End-Use Sector
- Introduction / Key Findings
- Historical Market Size Value (USD Million) Analysis By End-Use Sector, 2021 to 2025
- Current and Future Market Size Value (USD Million) Analysis and Forecast By End-Use Sector, 2026 to 2036
- General Industry
- Automotive
- Electronics
- General Industry
- Y to o to Y Growth Trend Analysis By End-Use Sector, 2021 to 2025
- Absolute $ Opportunity Analysis By End-Use Sector, 2026 to 2036
- Global Market Analysis 2021 to 2025 and Forecast 2026 to 2036, By Tier
- Introduction / Key Findings
- Historical Market Size Value (USD Million) Analysis By Tier, 2021 to 2025
- Current and Future Market Size Value (USD Million) Analysis and Forecast By Tier, 2026 to 2036
- OEM Supply
- Aftermarket
- OEM Supply
- Y to o to Y Growth Trend Analysis By Tier, 2021 to 2025
- Absolute $ Opportunity Analysis By Tier, 2026 to 2036
- Global Market Analysis 2021 to 2025 and Forecast 2026 to 2036, By Robot Type
- Introduction / Key Findings
- Historical Market Size Value (USD Million) Analysis By Robot Type, 2021 to 2025
- Current and Future Market Size Value (USD Million) Analysis and Forecast By Robot Type, 2026 to 2036
- Articulated Robots
- SCARA Robots
- Cartesian Robots
- Delta Robots
- Collaborative Robots
- Articulated Robots
- Y to o to Y Growth Trend Analysis By Robot Type, 2021 to 2025
- Absolute $ Opportunity Analysis By Robot Type, 2026 to 2036
- Global Market Analysis 2021 to 2025 and Forecast 2026 to 2036, By Payload Class
- Introduction / Key Findings
- Historical Market Size Value (USD Million) Analysis By Payload Class, 2021 to 2025
- Current and Future Market Size Value (USD Million) Analysis and Forecast By Payload Class, 2026 to 2036
- Medium Payload
- Heavy Payload
- Light Payload
- Medium Payload
- Y to o to Y Growth Trend Analysis By Payload Class, 2021 to 2025
- Absolute $ Opportunity Analysis By Payload Class, 2026 to 2036
- Global Market Analysis 2021 to 2025 and Forecast 2026 to 2036, By Sales Channel
- Introduction / Key Findings
- Historical Market Size Value (USD Million) Analysis By Sales Channel, 2021 to 2025
- Current and Future Market Size Value (USD Million) Analysis and Forecast By Sales Channel, 2026 to 2036
- Direct Supply
- Distributor Supply
- Integrator Supply
- Direct Supply
- Y to o to Y Growth Trend Analysis By Sales Channel, 2021 to 2025
- Absolute $ Opportunity Analysis By Sales Channel, 2026 to 2036
- Global Market Analysis 2021 to 2025 and Forecast 2026 to 2036, By Region
- Introduction
- Historical Market Size Value (USD Million) Analysis By Region, 2021 to 2025
- Current Market Size Value (USD Million) Analysis and Forecast By Region, 2026 to 2036
- North America
- Latin America
- Western Europe
- Eastern Europe
- East Asia
- South Asia and Pacific
- Middle East & Africa
- Market Attractiveness Analysis By Region
- North America Market Analysis 2021 to 2025 and Forecast 2026 to 2036, By Country
- Historical Market Size Value (USD Million) Trend Analysis By Market Taxonomy, 2021 to 2025
- Market Size Value (USD Million) Forecast By Market Taxonomy, 2026 to 2036
- By Country
- USA
- Canada
- Mexico
- By Component
- By End-Use Sector
- By Tier
- By Robot Type
- By Payload Class
- By Sales Channel
- By Country
- Market Attractiveness Analysis
- By Country
- By Component
- By End-Use Sector
- By Tier
- By Robot Type
- By Payload Class
- By Sales Channel
- Key Takeaways
- Latin America Market Analysis 2021 to 2025 and Forecast 2026 to 2036, By Country
- Historical Market Size Value (USD Million) Trend Analysis By Market Taxonomy, 2021 to 2025
- Market Size Value (USD Million) Forecast By Market Taxonomy, 2026 to 2036
- By Country
- Brazil
- Chile
- Rest of Latin America
- By Component
- By End-Use Sector
- By Tier
- By Robot Type
- By Payload Class
- By Sales Channel
- By Country
- Market Attractiveness Analysis
- By Country
- By Component
- By End-Use Sector
- By Tier
- By Robot Type
- By Payload Class
- By Sales Channel
- Key Takeaways
- Western Europe Market Analysis 2021 to 2025 and Forecast 2026 to 2036, By Country
- Historical Market Size Value (USD Million) Trend Analysis By Market Taxonomy, 2021 to 2025
- Market Size Value (USD Million) Forecast By Market Taxonomy, 2026 to 2036
- By Country
- Germany
- UK
- Italy
- Spain
- France
- Nordic
- BENELUX
- Rest of Western Europe
- By Component
- By End-Use Sector
- By Tier
- By Robot Type
- By Payload Class
- By Sales Channel
- By Country
- Market Attractiveness Analysis
- By Country
- By Component
- By End-Use Sector
- By Tier
- By Robot Type
- By Payload Class
- By Sales Channel
- Key Takeaways
- Eastern Europe Market Analysis 2021 to 2025 and Forecast 2026 to 2036, By Country
- Historical Market Size Value (USD Million) Trend Analysis By Market Taxonomy, 2021 to 2025
- Market Size Value (USD Million) Forecast By Market Taxonomy, 2026 to 2036
- By Country
- Russia
- Poland
- Hungary
- Balkan & Baltic
- Rest of Eastern Europe
- By Component
- By End-Use Sector
- By Tier
- By Robot Type
- By Payload Class
- By Sales Channel
- By Country
- Market Attractiveness Analysis
- By Country
- By Component
- By End-Use Sector
- By Tier
- By Robot Type
- By Payload Class
- By Sales Channel
- Key Takeaways
- East Asia Market Analysis 2021 to 2025 and Forecast 2026 to 2036, By Country
- Historical Market Size Value (USD Million) Trend Analysis By Market Taxonomy, 2021 to 2025
- Market Size Value (USD Million) Forecast By Market Taxonomy, 2026 to 2036
- By Country
- China
- Japan
- South Korea
- By Component
- By End-Use Sector
- By Tier
- By Robot Type
- By Payload Class
- By Sales Channel
- By Country
- Market Attractiveness Analysis
- By Country
- By Component
- By End-Use Sector
- By Tier
- By Robot Type
- By Payload Class
- By Sales Channel
- Key Takeaways
- South Asia and Pacific Market Analysis 2021 to 2025 and Forecast 2026 to 2036, By Country
- Historical Market Size Value (USD Million) Trend Analysis By Market Taxonomy, 2021 to 2025
- Market Size Value (USD Million) Forecast By Market Taxonomy, 2026 to 2036
- By Country
- India
- ASEAN
- Australia & New Zealand
- Rest of South Asia and Pacific
- By Component
- By End-Use Sector
- By Tier
- By Robot Type
- By Payload Class
- By Sales Channel
- By Country
- Market Attractiveness Analysis
- By Country
- By Component
- By End-Use Sector
- By Tier
- By Robot Type
- By Payload Class
- By Sales Channel
- Key Takeaways
- Middle East & Africa Market Analysis 2021 to 2025 and Forecast 2026 to 2036, By Country
- Historical Market Size Value (USD Million) Trend Analysis By Market Taxonomy, 2021 to 2025
- Market Size Value (USD Million) Forecast By Market Taxonomy, 2026 to 2036
- By Country
- Kingdom of Saudi Arabia
- Other GCC Countries
- Turkiye
- South Africa
- Other African Union
- Rest of Middle East & Africa
- By Component
- By End-Use Sector
- By Tier
- By Robot Type
- By Payload Class
- By Sales Channel
- By Country
- Market Attractiveness Analysis
- By Country
- By Component
- By End-Use Sector
- By Tier
- By Robot Type
- By Payload Class
- By Sales Channel
- Key Takeaways
- Key Countries Market Analysis
- USA
- Pricing Analysis
- Market Share Analysis, 2025
- By Component
- By End-Use Sector
- By Tier
- By Robot Type
- By Payload Class
- By Sales Channel
- Canada
- Pricing Analysis
- Market Share Analysis, 2025
- By Component
- By End-Use Sector
- By Tier
- By Robot Type
- By Payload Class
- By Sales Channel
- Mexico
- Pricing Analysis
- Market Share Analysis, 2025
- By Component
- By End-Use Sector
- By Tier
- By Robot Type
- By Payload Class
- By Sales Channel
- Brazil
- Pricing Analysis
- Market Share Analysis, 2025
- By Component
- By End-Use Sector
- By Tier
- By Robot Type
- By Payload Class
- By Sales Channel
- Chile
- Pricing Analysis
- Market Share Analysis, 2025
- By Component
- By End-Use Sector
- By Tier
- By Robot Type
- By Payload Class
- By Sales Channel
- Germany
- Pricing Analysis
- Market Share Analysis, 2025
- By Component
- By End-Use Sector
- By Tier
- By Robot Type
- By Payload Class
- By Sales Channel
- UK
- Pricing Analysis
- Market Share Analysis, 2025
- By Component
- By End-Use Sector
- By Tier
- By Robot Type
- By Payload Class
- By Sales Channel
- Italy
- Pricing Analysis
- Market Share Analysis, 2025
- By Component
- By End-Use Sector
- By Tier
- By Robot Type
- By Payload Class
- By Sales Channel
- Spain
- Pricing Analysis
- Market Share Analysis, 2025
- By Component
- By End-Use Sector
- By Tier
- By Robot Type
- By Payload Class
- By Sales Channel
- France
- Pricing Analysis
- Market Share Analysis, 2025
- By Component
- By End-Use Sector
- By Tier
- By Robot Type
- By Payload Class
- By Sales Channel
- India
- Pricing Analysis
- Market Share Analysis, 2025
- By Component
- By End-Use Sector
- By Tier
- By Robot Type
- By Payload Class
- By Sales Channel
- ASEAN
- Pricing Analysis
- Market Share Analysis, 2025
- By Component
- By End-Use Sector
- By Tier
- By Robot Type
- By Payload Class
- By Sales Channel
- Australia & New Zealand
- Pricing Analysis
- Market Share Analysis, 2025
- By Component
- By End-Use Sector
- By Tier
- By Robot Type
- By Payload Class
- By Sales Channel
- China
- Pricing Analysis
- Market Share Analysis, 2025
- By Component
- By End-Use Sector
- By Tier
- By Robot Type
- By Payload Class
- By Sales Channel
- Japan
- Pricing Analysis
- Market Share Analysis, 2025
- By Component
- By End-Use Sector
- By Tier
- By Robot Type
- By Payload Class
- By Sales Channel
- South Korea
- Pricing Analysis
- Market Share Analysis, 2025
- By Component
- By End-Use Sector
- By Tier
- By Robot Type
- By Payload Class
- By Sales Channel
- Russia
- Pricing Analysis
- Market Share Analysis, 2025
- By Component
- By End-Use Sector
- By Tier
- By Robot Type
- By Payload Class
- By Sales Channel
- Poland
- Pricing Analysis
- Market Share Analysis, 2025
- By Component
- By End-Use Sector
- By Tier
- By Robot Type
- By Payload Class
- By Sales Channel
- Hungary
- Pricing Analysis
- Market Share Analysis, 2025
- By Component
- By End-Use Sector
- By Tier
- By Robot Type
- By Payload Class
- By Sales Channel
- Kingdom of Saudi Arabia
- Pricing Analysis
- Market Share Analysis, 2025
- By Component
- By End-Use Sector
- By Tier
- By Robot Type
- By Payload Class
- By Sales Channel
- Turkiye
- Pricing Analysis
- Market Share Analysis, 2025
- By Component
- By End-Use Sector
- By Tier
- By Robot Type
- By Payload Class
- By Sales Channel
- South Africa
- Pricing Analysis
- Market Share Analysis, 2025
- By Component
- By End-Use Sector
- By Tier
- By Robot Type
- By Payload Class
- By Sales Channel
- USA
- Market Structure Analysis
- Competition Dashboard
- Competition Benchmarking
- Market Share Analysis of Top Players
- By Regional
- By Component
- By End-Use Sector
- By Tier
- By Robot Type
- By Payload Class
- By Sales Channel
- Competition Analysis
- Competition Deep Dive
- ABB Ltd.
- Overview
- Product Portfolio
- Profitability by Market Segments (Product/Age /Sales Channel/Region)
- Sales Footprint
- Strategy Overview
- Marketing Strategy
- Product Strategy
- Channel Strategy
- Siemens AG
- Rockwell Automation Inc.
- Mitsubishi Electric Corporation
- Yaskawa Electric Corporation
- Schneider Electric SE
- FANUC Corporation
- Parker Hannifin Corporation
- Bosch Rexroth AG
- Nidec Corporation
- ABB Ltd.
- Competition Deep Dive
- Assumptions & Acronyms Used
List Of Table
- Table 1: Global Market Value (USD Million) Forecast by Region, 2021 to 2036
- Table 2: Global Market Value (USD Million) Forecast by Component, 2021 to 2036
- Table 3: Global Market Value (USD Million) Forecast by End-Use Sector, 2021 to 2036
- Table 4: Global Market Value (USD Million) Forecast by Tier, 2021 to 2036
- Table 5: Global Market Value (USD Million) Forecast by Robot Type, 2021 to 2036
- Table 6: Global Market Value (USD Million) Forecast by Payload Class, 2021 to 2036
- Table 7: Global Market Value (USD Million) Forecast by Sales Channel, 2021 to 2036
- Table 8: North America Market Value (USD Million) Forecast by Country, 2021 to 2036
- Table 9: North America Market Value (USD Million) Forecast by Component, 2021 to 2036
- Table 10: North America Market Value (USD Million) Forecast by End-Use Sector, 2021 to 2036
- Table 11: North America Market Value (USD Million) Forecast by Tier, 2021 to 2036
- Table 12: North America Market Value (USD Million) Forecast by Robot Type, 2021 to 2036
- Table 13: North America Market Value (USD Million) Forecast by Payload Class, 2021 to 2036
- Table 14: North America Market Value (USD Million) Forecast by Sales Channel, 2021 to 2036
- Table 15: Latin America Market Value (USD Million) Forecast by Country, 2021 to 2036
- Table 16: Latin America Market Value (USD Million) Forecast by Component, 2021 to 2036
- Table 17: Latin America Market Value (USD Million) Forecast by End-Use Sector, 2021 to 2036
- Table 18: Latin America Market Value (USD Million) Forecast by Tier, 2021 to 2036
- Table 19: Latin America Market Value (USD Million) Forecast by Robot Type, 2021 to 2036
- Table 20: Latin America Market Value (USD Million) Forecast by Payload Class, 2021 to 2036
- Table 21: Latin America Market Value (USD Million) Forecast by Sales Channel, 2021 to 2036
- Table 22: Western Europe Market Value (USD Million) Forecast by Country, 2021 to 2036
- Table 23: Western Europe Market Value (USD Million) Forecast by Component, 2021 to 2036
- Table 24: Western Europe Market Value (USD Million) Forecast by End-Use Sector, 2021 to 2036
- Table 25: Western Europe Market Value (USD Million) Forecast by Tier, 2021 to 2036
- Table 26: Western Europe Market Value (USD Million) Forecast by Robot Type, 2021 to 2036
- Table 27: Western Europe Market Value (USD Million) Forecast by Payload Class, 2021 to 2036
- Table 28: Western Europe Market Value (USD Million) Forecast by Sales Channel, 2021 to 2036
- Table 29: Eastern Europe Market Value (USD Million) Forecast by Country, 2021 to 2036
- Table 30: Eastern Europe Market Value (USD Million) Forecast by Component, 2021 to 2036
- Table 31: Eastern Europe Market Value (USD Million) Forecast by End-Use Sector, 2021 to 2036
- Table 32: Eastern Europe Market Value (USD Million) Forecast by Tier, 2021 to 2036
- Table 33: Eastern Europe Market Value (USD Million) Forecast by Robot Type, 2021 to 2036
- Table 34: Eastern Europe Market Value (USD Million) Forecast by Payload Class, 2021 to 2036
- Table 35: Eastern Europe Market Value (USD Million) Forecast by Sales Channel, 2021 to 2036
- Table 36: East Asia Market Value (USD Million) Forecast by Country, 2021 to 2036
- Table 37: East Asia Market Value (USD Million) Forecast by Component, 2021 to 2036
- Table 38: East Asia Market Value (USD Million) Forecast by End-Use Sector, 2021 to 2036
- Table 39: East Asia Market Value (USD Million) Forecast by Tier, 2021 to 2036
- Table 40: East Asia Market Value (USD Million) Forecast by Robot Type, 2021 to 2036
- Table 41: East Asia Market Value (USD Million) Forecast by Payload Class, 2021 to 2036
- Table 42: East Asia Market Value (USD Million) Forecast by Sales Channel, 2021 to 2036
- Table 43: South Asia and Pacific Market Value (USD Million) Forecast by Country, 2021 to 2036
- Table 44: South Asia and Pacific Market Value (USD Million) Forecast by Component, 2021 to 2036
- Table 45: South Asia and Pacific Market Value (USD Million) Forecast by End-Use Sector, 2021 to 2036
- Table 46: South Asia and Pacific Market Value (USD Million) Forecast by Tier, 2021 to 2036
- Table 47: South Asia and Pacific Market Value (USD Million) Forecast by Robot Type, 2021 to 2036
- Table 48: South Asia and Pacific Market Value (USD Million) Forecast by Payload Class, 2021 to 2036
- Table 49: South Asia and Pacific Market Value (USD Million) Forecast by Sales Channel, 2021 to 2036
- Table 50: Middle East & Africa Market Value (USD Million) Forecast by Country, 2021 to 2036
- Table 51: Middle East & Africa Market Value (USD Million) Forecast by Component, 2021 to 2036
- Table 52: Middle East & Africa Market Value (USD Million) Forecast by End-Use Sector, 2021 to 2036
- Table 53: Middle East & Africa Market Value (USD Million) Forecast by Tier, 2021 to 2036
- Table 54: Middle East & Africa Market Value (USD Million) Forecast by Robot Type, 2021 to 2036
- Table 55: Middle East & Africa Market Value (USD Million) Forecast by Payload Class, 2021 to 2036
- Table 56: Middle East & Africa Market Value (USD Million) Forecast by Sales Channel, 2021 to 2036
List Of Figures
- Figure 1: Global Market Pricing Analysis
- Figure 2: Global Market Value (USD Million) Forecast 2021-2036
- Figure 3: Global Market Value Share and BPS Analysis by Component, 2026 and 2036
- Figure 4: Global Market Y-o-Y Growth Comparison by Component, 2026 to 2036
- Figure 5: Global Market Attractiveness Analysis by Component
- Figure 6: Global Market Value Share and BPS Analysis by End-Use Sector, 2026 and 2036
- Figure 7: Global Market Y-o-Y Growth Comparison by End-Use Sector, 2026 to 2036
- Figure 8: Global Market Attractiveness Analysis by End-Use Sector
- Figure 9: Global Market Value Share and BPS Analysis by Tier, 2026 and 2036
- Figure 10: Global Market Y-o-Y Growth Comparison by Tier, 2026 to 2036
- Figure 11: Global Market Attractiveness Analysis by Tier
- Figure 12: Global Market Value Share and BPS Analysis by Robot Type, 2026 and 2036
- Figure 13: Global Market Y-o-Y Growth Comparison by Robot Type, 2026 to 2036
- Figure 14: Global Market Attractiveness Analysis by Robot Type
- Figure 15: Global Market Value Share and BPS Analysis by Payload Class, 2026 and 2036
- Figure 16: Global Market Y-o-Y Growth Comparison by Payload Class, 2026 to 2036
- Figure 17: Global Market Attractiveness Analysis by Payload Class
- Figure 18: Global Market Value Share and BPS Analysis by Sales Channel, 2026 and 2036
- Figure 19: Global Market Y-o-Y Growth Comparison by Sales Channel, 2026 to 2036
- Figure 20: Global Market Attractiveness Analysis by Sales Channel
- Figure 21: Global Market Value (USD Million) Share and BPS Analysis by Region, 2026 and 2036
- Figure 22: Global Market Y-o-Y Growth Comparison by Region, 2026 to 2036
- Figure 23: Global Market Attractiveness Analysis by Region
- Figure 24: North America Market Incremental Dollar Opportunity, 2026 to 2036
- Figure 25: Latin America Market Incremental Dollar Opportunity, 2026 to 2036
- Figure 26: Western Europe Market Incremental Dollar Opportunity, 2026 to 2036
- Figure 27: Eastern Europe Market Incremental Dollar Opportunity, 2026 to 2036
- Figure 28: East Asia Market Incremental Dollar Opportunity, 2026 to 2036
- Figure 29: South Asia and Pacific Market Incremental Dollar Opportunity, 2026 to 2036
- Figure 30: Middle East & Africa Market Incremental Dollar Opportunity, 2026 to 2036
- Figure 31: North America Market Value Share and BPS Analysis by Country, 2026 and 2036
- Figure 32: North America Market Value Share and BPS Analysis by Component, 2026 and 2036
- Figure 33: North America Market Y-o-Y Growth Comparison by Component, 2026 to 2036
- Figure 34: North America Market Attractiveness Analysis by Component
- Figure 35: North America Market Value Share and BPS Analysis by End-Use Sector, 2026 and 2036
- Figure 36: North America Market Y-o-Y Growth Comparison by End-Use Sector, 2026 to 2036
- Figure 37: North America Market Attractiveness Analysis by End-Use Sector
- Figure 38: North America Market Value Share and BPS Analysis by Tier, 2026 and 2036
- Figure 39: North America Market Y-o-Y Growth Comparison by Tier, 2026 to 2036
- Figure 40: North America Market Attractiveness Analysis by Tier
- Figure 41: North America Market Value Share and BPS Analysis by Robot Type, 2026 and 2036
- Figure 42: North America Market Y-o-Y Growth Comparison by Robot Type, 2026 to 2036
- Figure 43: North America Market Attractiveness Analysis by Robot Type
- Figure 44: North America Market Value Share and BPS Analysis by Payload Class, 2026 and 2036
- Figure 45: North America Market Y-o-Y Growth Comparison by Payload Class, 2026 to 2036
- Figure 46: North America Market Attractiveness Analysis by Payload Class
- Figure 47: North America Market Value Share and BPS Analysis by Sales Channel, 2026 and 2036
- Figure 48: North America Market Y-o-Y Growth Comparison by Sales Channel, 2026 to 2036
- Figure 49: North America Market Attractiveness Analysis by Sales Channel
- Figure 50: Latin America Market Value Share and BPS Analysis by Country, 2026 and 2036
- Figure 51: Latin America Market Value Share and BPS Analysis by Component, 2026 and 2036
- Figure 52: Latin America Market Y-o-Y Growth Comparison by Component, 2026 to 2036
- Figure 53: Latin America Market Attractiveness Analysis by Component
- Figure 54: Latin America Market Value Share and BPS Analysis by End-Use Sector, 2026 and 2036
- Figure 55: Latin America Market Y-o-Y Growth Comparison by End-Use Sector, 2026 to 2036
- Figure 56: Latin America Market Attractiveness Analysis by End-Use Sector
- Figure 57: Latin America Market Value Share and BPS Analysis by Tier, 2026 and 2036
- Figure 58: Latin America Market Y-o-Y Growth Comparison by Tier, 2026 to 2036
- Figure 59: Latin America Market Attractiveness Analysis by Tier
- Figure 60: Latin America Market Value Share and BPS Analysis by Robot Type, 2026 and 2036
- Figure 61: Latin America Market Y-o-Y Growth Comparison by Robot Type, 2026 to 2036
- Figure 62: Latin America Market Attractiveness Analysis by Robot Type
- Figure 63: Latin America Market Value Share and BPS Analysis by Payload Class, 2026 and 2036
- Figure 64: Latin America Market Y-o-Y Growth Comparison by Payload Class, 2026 to 2036
- Figure 65: Latin America Market Attractiveness Analysis by Payload Class
- Figure 66: Latin America Market Value Share and BPS Analysis by Sales Channel, 2026 and 2036
- Figure 67: Latin America Market Y-o-Y Growth Comparison by Sales Channel, 2026 to 2036
- Figure 68: Latin America Market Attractiveness Analysis by Sales Channel
- Figure 69: Western Europe Market Value Share and BPS Analysis by Country, 2026 and 2036
- Figure 70: Western Europe Market Value Share and BPS Analysis by Component, 2026 and 2036
- Figure 71: Western Europe Market Y-o-Y Growth Comparison by Component, 2026 to 2036
- Figure 72: Western Europe Market Attractiveness Analysis by Component
- Figure 73: Western Europe Market Value Share and BPS Analysis by End-Use Sector, 2026 and 2036
- Figure 74: Western Europe Market Y-o-Y Growth Comparison by End-Use Sector, 2026 to 2036
- Figure 75: Western Europe Market Attractiveness Analysis by End-Use Sector
- Figure 76: Western Europe Market Value Share and BPS Analysis by Tier, 2026 and 2036
- Figure 77: Western Europe Market Y-o-Y Growth Comparison by Tier, 2026 to 2036
- Figure 78: Western Europe Market Attractiveness Analysis by Tier
- Figure 79: Western Europe Market Value Share and BPS Analysis by Robot Type, 2026 and 2036
- Figure 80: Western Europe Market Y-o-Y Growth Comparison by Robot Type, 2026 to 2036
- Figure 81: Western Europe Market Attractiveness Analysis by Robot Type
- Figure 82: Western Europe Market Value Share and BPS Analysis by Payload Class, 2026 and 2036
- Figure 83: Western Europe Market Y-o-Y Growth Comparison by Payload Class, 2026 to 2036
- Figure 84: Western Europe Market Attractiveness Analysis by Payload Class
- Figure 85: Western Europe Market Value Share and BPS Analysis by Sales Channel, 2026 and 2036
- Figure 86: Western Europe Market Y-o-Y Growth Comparison by Sales Channel, 2026 to 2036
- Figure 87: Western Europe Market Attractiveness Analysis by Sales Channel
- Figure 88: Eastern Europe Market Value Share and BPS Analysis by Country, 2026 and 2036
- Figure 89: Eastern Europe Market Value Share and BPS Analysis by Component, 2026 and 2036
- Figure 90: Eastern Europe Market Y-o-Y Growth Comparison by Component, 2026 to 2036
- Figure 91: Eastern Europe Market Attractiveness Analysis by Component
- Figure 92: Eastern Europe Market Value Share and BPS Analysis by End-Use Sector, 2026 and 2036
- Figure 93: Eastern Europe Market Y-o-Y Growth Comparison by End-Use Sector, 2026 to 2036
- Figure 94: Eastern Europe Market Attractiveness Analysis by End-Use Sector
- Figure 95: Eastern Europe Market Value Share and BPS Analysis by Tier, 2026 and 2036
- Figure 96: Eastern Europe Market Y-o-Y Growth Comparison by Tier, 2026 to 2036
- Figure 97: Eastern Europe Market Attractiveness Analysis by Tier
- Figure 98: Eastern Europe Market Value Share and BPS Analysis by Robot Type, 2026 and 2036
- Figure 99: Eastern Europe Market Y-o-Y Growth Comparison by Robot Type, 2026 to 2036
- Figure 100: Eastern Europe Market Attractiveness Analysis by Robot Type
- Figure 101: Eastern Europe Market Value Share and BPS Analysis by Payload Class, 2026 and 2036
- Figure 102: Eastern Europe Market Y-o-Y Growth Comparison by Payload Class, 2026 to 2036
- Figure 103: Eastern Europe Market Attractiveness Analysis by Payload Class
- Figure 104: Eastern Europe Market Value Share and BPS Analysis by Sales Channel, 2026 and 2036
- Figure 105: Eastern Europe Market Y-o-Y Growth Comparison by Sales Channel, 2026 to 2036
- Figure 106: Eastern Europe Market Attractiveness Analysis by Sales Channel
- Figure 107: East Asia Market Value Share and BPS Analysis by Country, 2026 and 2036
- Figure 108: East Asia Market Value Share and BPS Analysis by Component, 2026 and 2036
- Figure 109: East Asia Market Y-o-Y Growth Comparison by Component, 2026 to 2036
- Figure 110: East Asia Market Attractiveness Analysis by Component
- Figure 111: East Asia Market Value Share and BPS Analysis by End-Use Sector, 2026 and 2036
- Figure 112: East Asia Market Y-o-Y Growth Comparison by End-Use Sector, 2026 to 2036
- Figure 113: East Asia Market Attractiveness Analysis by End-Use Sector
- Figure 114: East Asia Market Value Share and BPS Analysis by Tier, 2026 and 2036
- Figure 115: East Asia Market Y-o-Y Growth Comparison by Tier, 2026 to 2036
- Figure 116: East Asia Market Attractiveness Analysis by Tier
- Figure 117: East Asia Market Value Share and BPS Analysis by Robot Type, 2026 and 2036
- Figure 118: East Asia Market Y-o-Y Growth Comparison by Robot Type, 2026 to 2036
- Figure 119: East Asia Market Attractiveness Analysis by Robot Type
- Figure 120: East Asia Market Value Share and BPS Analysis by Payload Class, 2026 and 2036
- Figure 121: East Asia Market Y-o-Y Growth Comparison by Payload Class, 2026 to 2036
- Figure 122: East Asia Market Attractiveness Analysis by Payload Class
- Figure 123: East Asia Market Value Share and BPS Analysis by Sales Channel, 2026 and 2036
- Figure 124: East Asia Market Y-o-Y Growth Comparison by Sales Channel, 2026 to 2036
- Figure 125: East Asia Market Attractiveness Analysis by Sales Channel
- Figure 126: South Asia and Pacific Market Value Share and BPS Analysis by Country, 2026 and 2036
- Figure 127: South Asia and Pacific Market Value Share and BPS Analysis by Component, 2026 and 2036
- Figure 128: South Asia and Pacific Market Y-o-Y Growth Comparison by Component, 2026 to 2036
- Figure 129: South Asia and Pacific Market Attractiveness Analysis by Component
- Figure 130: South Asia and Pacific Market Value Share and BPS Analysis by End-Use Sector, 2026 and 2036
- Figure 131: South Asia and Pacific Market Y-o-Y Growth Comparison by End-Use Sector, 2026 to 2036
- Figure 132: South Asia and Pacific Market Attractiveness Analysis by End-Use Sector
- Figure 133: South Asia and Pacific Market Value Share and BPS Analysis by Tier, 2026 and 2036
- Figure 134: South Asia and Pacific Market Y-o-Y Growth Comparison by Tier, 2026 to 2036
- Figure 135: South Asia and Pacific Market Attractiveness Analysis by Tier
- Figure 136: South Asia and Pacific Market Value Share and BPS Analysis by Robot Type, 2026 and 2036
- Figure 137: South Asia and Pacific Market Y-o-Y Growth Comparison by Robot Type, 2026 to 2036
- Figure 138: South Asia and Pacific Market Attractiveness Analysis by Robot Type
- Figure 139: South Asia and Pacific Market Value Share and BPS Analysis by Payload Class, 2026 and 2036
- Figure 140: South Asia and Pacific Market Y-o-Y Growth Comparison by Payload Class, 2026 to 2036
- Figure 141: South Asia and Pacific Market Attractiveness Analysis by Payload Class
- Figure 142: South Asia and Pacific Market Value Share and BPS Analysis by Sales Channel, 2026 and 2036
- Figure 143: South Asia and Pacific Market Y-o-Y Growth Comparison by Sales Channel, 2026 to 2036
- Figure 144: South Asia and Pacific Market Attractiveness Analysis by Sales Channel
- Figure 145: Middle East & Africa Market Value Share and BPS Analysis by Country, 2026 and 2036
- Figure 146: Middle East & Africa Market Value Share and BPS Analysis by Component, 2026 and 2036
- Figure 147: Middle East & Africa Market Y-o-Y Growth Comparison by Component, 2026 to 2036
- Figure 148: Middle East & Africa Market Attractiveness Analysis by Component
- Figure 149: Middle East & Africa Market Value Share and BPS Analysis by End-Use Sector, 2026 and 2036
- Figure 150: Middle East & Africa Market Y-o-Y Growth Comparison by End-Use Sector, 2026 to 2036
- Figure 151: Middle East & Africa Market Attractiveness Analysis by End-Use Sector
- Figure 152: Middle East & Africa Market Value Share and BPS Analysis by Tier, 2026 and 2036
- Figure 153: Middle East & Africa Market Y-o-Y Growth Comparison by Tier, 2026 to 2036
- Figure 154: Middle East & Africa Market Attractiveness Analysis by Tier
- Figure 155: Middle East & Africa Market Value Share and BPS Analysis by Robot Type, 2026 and 2036
- Figure 156: Middle East & Africa Market Y-o-Y Growth Comparison by Robot Type, 2026 to 2036
- Figure 157: Middle East & Africa Market Attractiveness Analysis by Robot Type
- Figure 158: Middle East & Africa Market Value Share and BPS Analysis by Payload Class, 2026 and 2036
- Figure 159: Middle East & Africa Market Y-o-Y Growth Comparison by Payload Class, 2026 to 2036
- Figure 160: Middle East & Africa Market Attractiveness Analysis by Payload Class
- Figure 161: Middle East & Africa Market Value Share and BPS Analysis by Sales Channel, 2026 and 2036
- Figure 162: Middle East & Africa Market Y-o-Y Growth Comparison by Sales Channel, 2026 to 2036
- Figure 163: Middle East & Africa Market Attractiveness Analysis by Sales Channel
- Figure 164: Global Market - Tier Structure Analysis
- Figure 165: Global Market - Company Share Analysis