- Market Value (2025): USD 312.8 Bn
- Estimated Value (2026): USD 327.8 Bn
- Forecast Value (2036): USD 523.9 Bn
- CAGR (2026-2036): 4.8%
What is the Child Care Services Market forecast to be worth by 2036?
USD 327.8 billion in 2026 to USD 523.9 billion by 2036 at 4.8% CAGR.
- The child care services market reached USD 312.8 billion in 2025 as working families, center operators, employers and local childcare networks increased spending where families need predictable weekday care, licensed capacity and early learning support.
- Demand is projected to increase from USD 327.8 billion in 2026 to USD 523.9 billion by 2036.
- The market is forecast to record 4.8% CAGR from 2026 to 2036 because families need predictable weekday care, licensed capacity and early learning support.
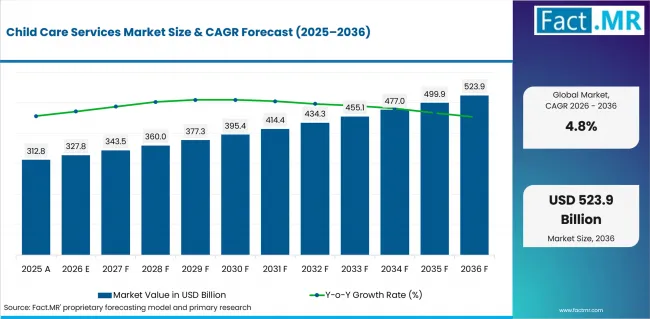
Child Care Services Market Value Analysis | Source: Fact.MR
What are the defining numbers behind Child Care Services Market growth?
USD 196.1 billion absolute opportunity is expected by 2036.
- Demand Drivers in the Market
- Day care services lead because working families need dependable weekday coverage. The purchase decision is tied to hours, location, staff availability and safety practices.
- Toddler care is the largest age-group need because children between one and three require high supervision and structured routines before preschool entry.
- Center-based providers lead because parents can assess licensing, staff ratios, curriculum and backup capacity more easily than with informal arrangements.
- Private pay remains prominent where public subsidy coverage is limited or where families choose centers based on schedule, location or program quality.
- Key Segments Analyzed
- By Service Type: Day Care Services are expected to hold 37.4% share in 2026 because working households need reliable daily coverage that matches job schedules.
- By Age Group: Toddlers (1-3 Years) are expected to hold 33.2% share in 2026 because toddlers require close supervision, routines and early social development support.
- By Provider Type: Center-Based Child Care is expected to hold 39.3% share in 2026 because licensed centers offer visible staffing, curriculum and safety processes.
- By Funding Type: Private Pay is expected to hold 45.9% share in 2026 because many families still pay directly when public funding or employer support is unavailable.
- By Program Type: Early Childhood Education is expected to hold 37.8% share in 2026 because parents increasingly judge childcare on learning readiness as well as supervision.
- Analyst Opinion at Fact.MR
- Shambhu Nath Jha, Sr. Consultant at Fact.MR, states, "Child care demand is decided at the point where family schedules, trust and affordability meet. Operators that can show stable staffing, safety discipline and a clear early-learning program are better placed than providers that sell only capacity."
- Strategic Implications
- Providers should show staff ratios, safety processes and curriculum clearly because these are the facts parents use when comparing centers.
- Employers can use childcare support to reduce work disruption for parents of infants and toddlers.
- Operators need careful pricing and staffing plans because affordability and labor availability decide whether demand converts into enrolled capacity.
- South Korea is projected at 5.3%; USA is projected at 5.1%; Canada is projected at 4.9%; Germany is projected at 4.6%; UK is projected at 4.5%; Australia is projected at 4.4%; Japan is projected at 4.2% during 2026 to 2036. Country analysis is shaped by workforce participation, childcare funding and licensed capacity.
How does the Child Care Services Market break down by segment?
Day Care Services lead Service Type at 37.4% share in 2026, while Toddlers (1-3 Years) lead Age Group at 33.2% share.
Why does Day Care Services lead Service Type?
Day Care Services is expected to account for 37.4% share in 2026.
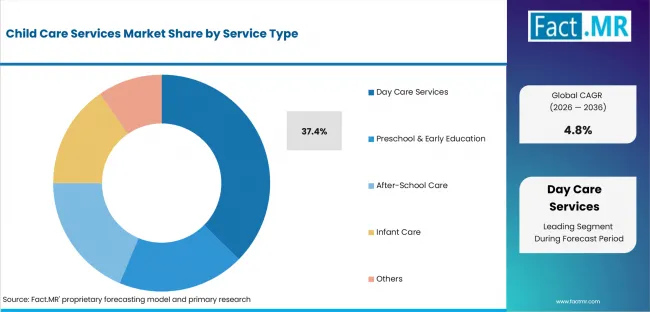
Child Care Services Market Analysis By Service Type | Source: Fact.MR
Day Care Services lead the service type segment because working households need reliable daily coverage that matches job schedules.
Why does Toddlers (1-3 Years) lead Age Group?
Toddlers (1-3 Years) is expected to account for 33.2% share in 2026.
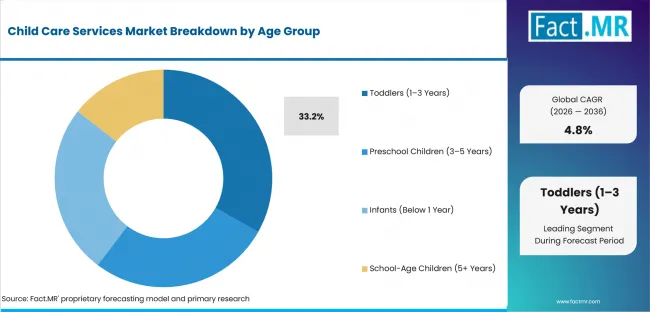
Child Care Services Market Analysis By Age Group | Source: Fact.MR
Toddlers (1-3 Years) lead the age group segment because toddlers require close supervision, routines and early social development support.
Why does Center-Based Child Care lead Provider Type?
Center-Based Child Care is expected to account for 39.3% share in 2026.
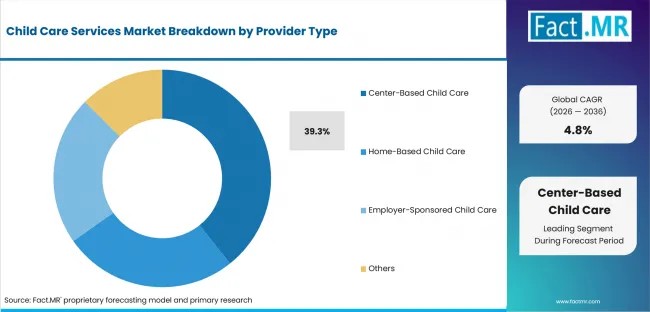
Child Care Services Market Analysis By Provider Type | Source: Fact.MR
Center-Based Child Care leads the provider type segment because licensed centers offer visible staffing, curriculum and safety processes.
Why does Private Pay lead Funding Type?
Private Pay is expected to account for 33.2% share in 2026.
Child Care Services Market Analysis By Age Group | Source: Fact.MR
Private Pay leads the funding type segment because many families still pay directly when public funding or employer support is unavailable.
Why does Early Childhood Education lead Program Type?
Early Childhood Education is expected to account for 37.8% share in 2026.
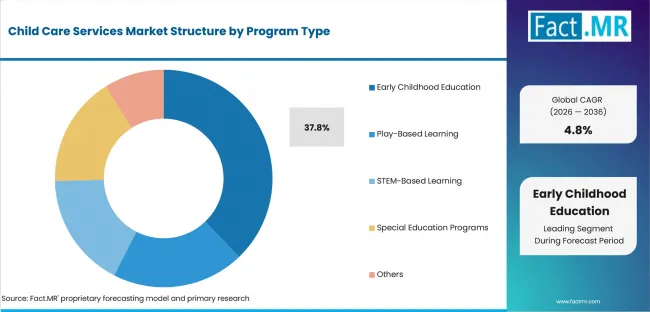
Child Care Services Market Analysis By Program Type | Source: Fact.MR
Early Childhood Education leads the program type segment because parents increasingly judge childcare on learning readiness as well as supervision.
What is accelerating Child Care Services Market adoption, and what is holding it back?
Demand is supported by working-parent schedules, toddler care needs and interest in early childhood education. Growth is limited by affordability, staff shortages and uneven public funding.
| DRIVER | QUALITATIVE RELEVANCE | GEOGRAPHIC RELEVANCE | IMPACT TIMELINE |
|---|---|---|---|
| Day care services | High | South Korea | Short term (<=2 years) |
| Toddler care | High | USA | Short term (<=2 years) |
| Center-based care | Moderate | Canada | Medium term (2-4 years) |
| Private pay | Selective | Germany | Medium term (2-4 years) |
Source: Fact.MR analysis. Updated Jul 29, 2026
- Day care services: Families need reliable weekday care that fits commuting and work schedules.
- Toddler care: Children aged one to three require more supervision and routine support than older preschool groups.
- Center-based care: Licensed centers make safety, staffing and curriculum easier for parents to evaluate.
- Private pay: Families often pay directly when subsidies do not cover the preferred provider or schedule.
Opportunity Impact Analysis
| OPPORTUNITY | QUALITATIVE RELEVANCE | GEOGRAPHIC RELEVANCE | IMPACT TIMELINE |
|---|---|---|---|
| Employer-supported childcare | High | South Korea | Medium term (2-4 years) |
| Centers that combine care with early education | Moderate | USA | Medium term (2-4 years) |
| Flexible schedules and extended hours | Selective | Canada | Medium term (2-4 years) |
Source: Fact.MR analysis. Updated Jul 29, 2026
- Employer-supported childcare can help families cover cost gaps and reduce work absences.
- Centers that combine care with early education can justify stronger parent preference.
- Flexible schedules and extended hours can address demand from non-standard work patterns.
Restraints Impact Analysis
| RESTRAINT | QUALITATIVE RELEVANCE | GEOGRAPHIC RELEVANCE | IMPACT TIMELINE |
|---|---|---|---|
| Affordability | High | South Korea | Short term (<=2 years) |
| Staff shortages | Moderate | USA | Medium term (2-4 years) |
| Regulatory and licensing requirements | Selective | Canada | Medium term (2-4 years) |
Source: Fact.MR analysis. Updated Jul 29, 2026
- Affordability remains a barrier when fees rise faster than household income.
- Staff shortages limit enrollment capacity even where parent demand is strong.
- Regulatory and licensing requirements can slow new center openings.
Which countries are scaling Child Care Services Market fastest?
The global CAGR is 4.8%. Country rates show how workforce participation, childcare funding and licensed capacity change the adoption route by market.
- South Korea records the highest listed CAGR at 5.3% from 2026 to 2036.
- USA and Canada also sit close to the upper end of the comparison where local demand conditions are stronger.
- Germany, UK, Australia, and Japan grow more steadily as buyers weigh cost, availability and adoption risk.
The full regional view covers North America, Latin America, Europe, East Asia, South Asia and Oceania, and the Middle East and Africa.
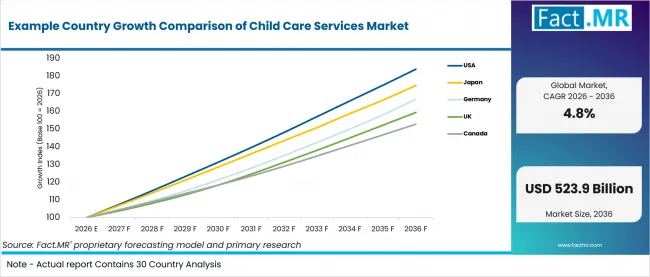
Example Country Growth Comparison Of Child Care Services Market | Source: Fact.MR
| COUNTRY | CAGR, 2026 to 2036 |
|---|---|
| South Korea | 5.3% |
| USA | 5.1% |
| Canada | 4.9% |
| Germany | 4.6% |
| UK | 4.5% |
| Australia | 4.4% |
| Japan | 4.2% |
Source: Fact.MR analysis. Updated Jul 29, 2026
What is shaping South Korea's outlook through 2036?
South Korea is projected at 5.3% CAGR during 2026 to 2036, above the global 4.8% trajectory. urban working-family demand and policy attention to early childhood services support faster growth.
What is shaping USA's outlook through 2036?
USA is projected at 5.1% CAGR during 2026 to 2036, above the global 4.8% trajectory. private-pay demand, employer benefits and center-based networks support continued expansion.
What is shaping Canada's outlook through 2036?
Canada is projected at 4.9% CAGR during 2026 to 2036, above the global 4.8% trajectory. public funding programs and provincial delivery models shape enrollment growth.
What is shaping Germany's outlook through 2036?
Germany is projected at 4.6% CAGR during 2026 to 2036, below the global 4.8% trajectory. licensed capacity and staffing availability influence service expansion.
What is shaping UK's outlook through 2036?
UK is projected at 4.5% CAGR during 2026 to 2036, below the global 4.8% trajectory. nursery demand is tied to parent work patterns and funding eligibility.
What is shaping Australia's outlook through 2036?
Australia is projected at 4.4% CAGR during 2026 to 2036, below the global 4.8% trajectory. center-based networks and subsidy rules shape household uptake.
What is shaping Japan's outlook through 2036?
Japan is projected at 4.2% CAGR during 2026 to 2036, below the global 4.8% trajectory. demographic pressure limits volume, but urban working families still need reliable care.
Who leads the Child Care Services Market?
Bright Horizons Family Solutions and KinderCare Education are among the visible providers in the child care services market. Learning Care Group and Busy Bees Nurseries also compete in the named provider set.
Bright Horizons Family Solutions is estimated to hold 4.9% share in 2026. Competition is shaped by center capacity, staff stability, safety compliance, curriculum quality and parent trust.
Through 2036, competitive gains are expected to come from clearer positioning around Day Care Services and stronger execution in the highest-growth country markets.
Which companies are the key providers?
Key companies include Bright Horizons Family Solutions; KinderCare Education; Learning Care Group; Busy Bees Nurseries; Primrose Schools; Goodstart Early Learning; Kids Planet Day Nurseries; G8 Education.
- Bright Horizons Family Solutions
- KinderCare Education
- Learning Care Group
- Busy Bees Nurseries
- Primrose Schools
- Goodstart Early Learning
- Kids Planet Day Nurseries
- G8 Education
Bibliography
- OECD: Good Practice for Good Jobs in Early Childhood Education and Care.
- World Bank: Childcare That Works.
- UNICEF: Global Report on Early Childhood Care and Education.
This Report Addresses
- The report evaluates the Child Care Services Market through Service Type and Age Group choices that define the 2026 market structure.
- Segment analysis covers Day Care Services and Toddlers (1-3 Years) as the leading 2026 positions.
- Country outlook compares the listed markets by CAGR and explains how workforce participation, childcare funding and licensed capacity shape local demand.
- Competitive analysis profiles the named providers and evaluates competition around center capacity, staff stability, safety compliance, curriculum quality and parent trust.
What does the Child Care Services Market cover?
The Child Care Services Market covers formal childcare services for infants, toddlers and preschool children, including day care, center-based care, home-based services, funding models and early education programs.
The market boundary is tied to paid products, services and channels that directly support this use case. Adjacent spending is included only when it is part of the same purchase or operating decision.
What is included in the scope?
The scope includes service type, age group, provider type, funding type, program type and regional demand for paid childcare services.
Coverage also includes adjacent segment options when they are purchased for the same defined market use.
What is excluded from the scope?
The scope excludes informal babysitting, K-12 schooling, pediatric healthcare and unrelated child products.
How Was the Analysis Built?
The analysis combines primary research with desk research focused on the child care services market, its segment structure and country-level demand.
- Primary Research: Interviews and validation discussions test buyer priorities, adoption barriers, pricing logic and operating requirements.
- Desk Research: The assessment reviews company disclosures, public datasets, regulatory material, technical literature and industry records relevant to the market.
- Market Sizing and Forecasting: Estimates combine top-down and bottom-up checks across demand signals, segment shares, country activity, company participation and adoption constraints.
Segmentation
What is the report's scope and coverage?
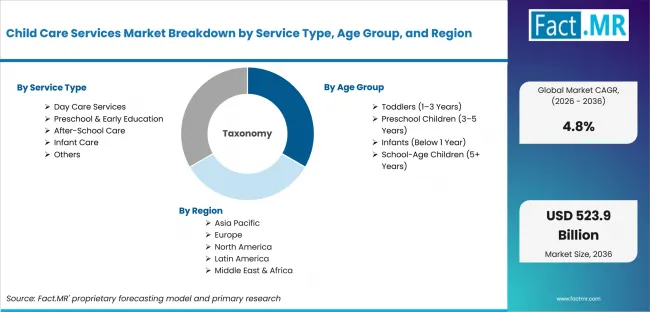
Child Care Services Market Breakdown By Service Type, Age Group, And Region | Source: Fact.MR
| Attribute | Details |
|---|---|
| Quantitative Units | USD 327.8 billion in 2026 to USD 523.9 billion by 2036 at 4.8% CAGR |
| Market Definition | Child Care Services are organized care and early-learning programs provided to children outside the home. They include day care, preschool and related arrangements used by working families and caregivers. |
| Service Type | Day Care Services; Full-Day Care; Half-Day Care; Preschool & Early Education; Montessori Programs; Play-Based Learning; After-School Care; Homework Assistance; Recreational Activities; Infant Care; Newborn Care; Toddler Care; Others; Backup Child Care; Special Needs Child Care |
| Age Group | Toddlers (1-3 Years); 12-24 Months; 25-36 Months; Preschool Children (3-5 Years); 3-4 Years; 4-5 Years; Infants (Below 1 Year); 0-6 Months; 7-12 Months; School-Age Children (5+ Years); 5-8 Years; Above 8 Years |
| Provider Type | Center-Based Child Care; Private Child Care Centers; Public Child Care Centers; Home-Based Child Care; Licensed Home Care; Family Day Care; Employer-Sponsored Child Care; On-Site Child Care; Corporate Partnerships; Others; Non-Profit Organizations; Community Child Care Programs |
| Funding Type | Private Pay; Family Self-Funding; Employer-Assisted Payment; Government-Supported; Public Subsidies; Voucher Programs; Non-Profit & NGO Funding; Charitable Organizations; Community Grants |
| Program Type | Early Childhood Education; Cognitive Development; Language Development; Play-Based Learning; Indoor Activities; Outdoor Activities; STEM-Based Learning; Science Activities; Technology & Robotics; Special Education Programs; Inclusive Learning; Behavioral Support; Others; Arts & Music; Language Immersion |
| Regions Covered | North America; Latin America; Europe; East Asia; South Asia and Oceania; Middle East and Africa |
| Countries Covered | South Korea; USA; Canada; Germany; UK; Australia; Japan |
| Key Companies Profiled | Bright Horizons Family Solutions; KinderCare Education; Learning Care Group; Busy Bees Nurseries; Primrose Schools; Goodstart Early Learning; Kids Planet Day Nurseries; G8 Education |
| Forecast Period | 2026 to 2036 |
| Approach | Hybrid top-down and bottom-up assessment using demand indicators, segment mix, country growth, company participation and public evidence relevant to the category. |
Source: Fact.MR analysis. Updated Jul 29, 2026
How is the market segmented?
-
By Service Type:
- Day Care Services
- Full-Day Care
- Half-Day Care
- Preschool & Early Education
- Montessori Programs
- Play-Based Learning
- After-School Care
- Homework Assistance
- Recreational Activities
- Infant Care
- Newborn Care
- Toddler Care
- Others
- Backup Child Care
- Special Needs Child Care
-
By Age Group:
- Toddlers (1-3 Years)
- 12-24 Months
- 25-36 Months
- Preschool Children (3-5 Years)
- 3-4 Years
- 4-5 Years
- Infants (Below 1 Year)
- 0-6 Months
- 7-12 Months
- School-Age Children (5+ Years)
- 5-8 Years
- Above 8 Years
-
By Provider Type:
- Center-Based Child Care
- Private Child Care Centers
- Public Child Care Centers
- Home-Based Child Care
- Licensed Home Care
- Family Day Care
- Employer-Sponsored Child Care
- On-Site Child Care
- Corporate Partnerships
- Others
- Non-Profit Organizations
- Community Child Care Programs
-
By Funding Type:
- Private Pay
- Family Self-Funding
- Employer-Assisted Payment
- Government-Supported
- Public Subsidies
- Voucher Programs
- Non-Profit & NGO Funding
- Charitable Organizations
- Community Grants
-
By Program Type:
- Early Childhood Education
- Cognitive Development
- Language Development
- Play-Based Learning
- Indoor Activities
- Outdoor Activities
- STEM-Based Learning
- Science Activities
- Technology & Robotics
- Special Education Programs
- Inclusive Learning
- Behavioral Support
- Others
- Arts & Music
- Language Immersion
-
By Region:
- North America
- Latin America
- Europe
- East Asia
- South Asia and Oceania
- Middle East and Africa
Frequently Asked Questions
Which Service Type leads the Child Care Services Market?
Which Age Group leads the Child Care Services Market?
Which Provider Type leads the Child Care Services Market?
Which Funding Type leads the Child Care Services Market?
Which Program Type leads the Child Care Services Market?
How does South Korea perform in the Child Care Services Market?
How does USA perform in the Child Care Services Market?
How does Canada perform in the Child Care Services Market?
What is the primary driver in the Child Care Services Market?
What is the main restraint in the Child Care Services Market?
Who worked on this report


Preview the report firsthand - request a free sample
Free SampleGet the brochure for pricing and purchase details
Download PDF