- Market Value (2025): USD 32.4 Bn
- Estimated Value (2026): USD 33.9 Bn
- Forecast Value (2036): USD 53.3 Bn
- CAGR (2026-2036): 4.6%
What is the Compressed Natural Gas (CNG) Market forecast to be worth by 2036?
USD 33.90 billion in 2026 to USD 53.32 billion by 2036, at a 4.6% CAGR.
- Fact.MR places the compressed natural gas market at USD 32.4 billion in 2025, reflecting an established commercial fleet fuel base rather than an early-stage alternative.
- The market is expected to add USD 19.42 billion over the outlook, moving from USD 33.9 billion in 2026 to USD 53.3 billion in 2036.
- A 4.6% CAGR through 2036 is supported mainly by repeat fuel demand from city buses, refuse vehicles, airport fleets, and regional delivery operations with centralized refueling.
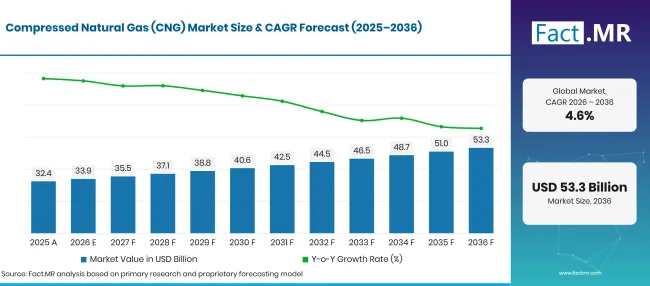
Factmr Compressed Natural Gas Cng Market Forecast Global 1 | Source: Fact.MR
| Year | Basis | Market Value (USD billion) |
|---|---|---|
| 2025 | Actual | 32.4 |
| 2026 | Estimate | 33.9 |
| 2036 | Forecast | 53.3 |
| CAGR 2026 to 2036 | Forecast period | 4.6% |
Source: Fact.MR analysis. Updated Oct 17, 2026
What are the defining numbers behind Compressed Natural Gas (CNG) Market growth?
The opportunity adds up to USD 19.42 billion between 2026 and 2036. Dry non-associated gas provides the supply anchor, while medium- and heavy-duty buses create the most dependable depot-based consumption.
- Demand Drivers in the Market
- Municipal public transit systems prioritize compressed natural gas as a dependable alternative to diesel, achieving significant reductions in urban particulate matter, nitrogen oxides, and greenhouse gases. The U.S. Department of Energy Alternative Fuels Data Center documented that natural gas compressed to 3,600 psi provides clean-burning fuel for transit fleets while utilizing existing pipeline distribution networks [1]. Urban transit agencies expand dedicated fast-fill station infrastructure inside central bus depots to support continuous multi-shift operations.
- Commercial fleet operators favor compressed natural gas to lower fleet operating expenditures, benefiting from persistent retail price advantages over conventional diesel. The U.S. Department of Energy recorded retail compressed natural gas prices averaging USD 3.08 per gasoline gallon equivalent compared to USD 5.55 per gallon for diesel [3]. Long-haul carriers and municipal utility vehicles utilize long-term fuel purchase contracts to protect operational budgets against petroleum market volatility.
- Heavy-duty vehicle manufacturers design high-displacement natural gas engines with dedicated spark-ignition architectures that deliver diesel-like torque curves for vocational vehicles. The Alternative Fuels Data Center highlighted that heavy-duty natural gas vehicles provide comparable power and driving range for refuse haulers, transit buses, and regional freight tractors [2]. Fleet maintenance managers select factory-integrated natural gas systems to ensure warranty compliance and standardized diagnostics across repair shops.
- Government clean transportation mandates and environmental incentive programs encourage school districts and urban logistics fleets to replace aging diesel engines. Federal programs such as the Clean School Bus initiative offer substantial statutory incentives and rebates for clean alternative fuel buses, specifically including compressed natural gas and propane configurations [4]. Subsidized refueling station grants lower the initial capital requirements for private and public fleet conversions.
- Key Segments Analyzed
- By Sources: Non-associated Gas holds 45.7% share in 2026, as dedicated dry natural gas fields supply high-methane feedstock directly to municipal pipeline networks and high-pressure compressor stations.
- By Applications: Medium/Heavy Duty Buses accounts for 42.3% share in 2026, driven by municipal public transit modernization, airport shuttle operations, and regional commuter bus fleets.
- Analyst Opinion at Fact.MR
- Shambhu Nath Jha, Lead Consultant at Fact.MR, notes that CNG retains a practical role where vehicles return to base, refuel quickly, and cover high daily mileage. The strongest commercial case is therefore shifting toward buses, refuse trucks, and regional vocational fleets rather than private cars. Suppliers combining renewable gas with dependable fast-fill performance are better placed to protect station utilization and fuel margins.
- Strategic Implications
- Energy infrastructure companies are integrating renewable natural gas sourced from agricultural digesters and landfills into existing CNG distribution grids to offer net-negative carbon fuel options. Blending biomethane into pipeline natural gas allows commercial fleets to meet corporate decarbonization targets without modifying vehicle engines or onboard fuel storage tanks.
- Compressor station developers are engineering modular fast-fill dispensing skids that integrate high-pressure buffer storage cascades with intelligent multi-hose dispensers. The U.S. Department of Energy tracked expanding alternative fueling station infrastructure, recording over one thousand active natural gas stations supporting municipal and private commercial vehicles across North America [5].
- Vehicle manufacturers are developing standardized lightweight Type IV carbon-fiber composite cylinders that store natural gas safely at 3,600 psi while minimizing tare weight penalties. Lighter onboard fuel systems allow commercial trucks and transit buses to carry higher passenger and freight payloads over extended daily operational routes.
- Municipal transit authorities are entering into public-private utility partnerships to build shared-access CNG fueling plazas that serve city bus fleets by night and commercial freight carriers by day. Dual-purpose station design maximizes compressor utilization rates and accelerates the payback period on multi-million-dollar capital investments.
Germany is expected to post the quickest growth at 6.0% CAGR as biomethane supply is connected with municipal and logistics fleets. Brazil follows at 5.5% on expanding domestic gas availability and urban bus use. The United States advances at 4.9% through refuse, airport, and delivery fleets, while the United Kingdom and Japan progress at 4.4% and 3.9%, respectively, through narrower heavy-duty and institutional applications.
How does the Compressed Natural Gas (CNG) Market break down by segment?
Non-associated Gas 45.7%; Medium/Heavy Duty Buses 42.3% in 2026.
Which Source dominates?
Non-associated Gas holds 45.7% share in 2026.
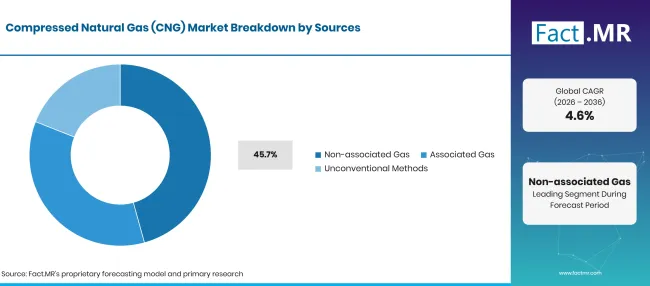
Factmr Compressed Natural Gas Cng Market Breakdown Sources | Source: Fact.MR
| Sources | Share (2026) |
|---|---|
| Non-associated Gas (Leading segment) | 45.7% |
| Other segments combined | 54.3%* |
| Total | 100.0% |
Source: Fact.MR analysis. Updated Oct 17, 2026
Non-associated natural gas reservoirs provide the primary supply source for vehicle-grade CNG because these geologic formations produce dry, high-methane gas that requires minimal processing before pipeline injection. High methane purity ensures optimal octane ratings and consistent anti-knock properties inside high-compression vehicle engines. Associated gas recovered during crude oil extraction supplies substantial localized volume in major energy-producing basins, while unconventional sources including shale formations and coalbed methane expand overall supply stability. Fact.MR reports covering the compressed natural gas market and the natural gas vehicles market illustrate the essential link between pipeline purity standards and commercial fleet engine durability. Technical studies on the cng dispenser market and cng cylinders market emphasize high-pressure safety standards across gas compression infrastructure.
What leads the Applications segment?
Medium/Heavy Duty Buses accounts for 42.3% share in 2026.
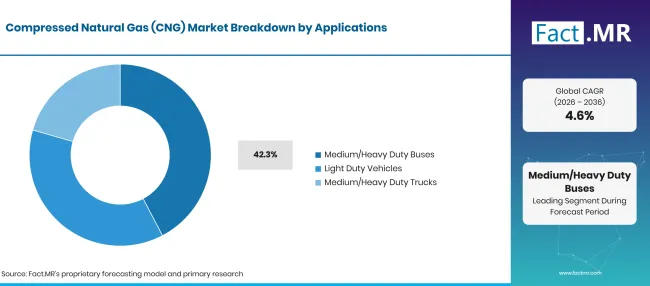
Factmr Compressed Natural Gas Cng Market Breakdown Applications | Source: Fact.MR
| Applications | Share (2026) |
|---|---|
| Medium/Heavy Duty Buses (Leading segment) | 42.3% |
| Other segments combined | 57.7%* |
| Total | 100.0% |
Source: Fact.MR analysis. Updated Oct 17, 2026
Public transit and intercity buses represent the largest application sector, as metropolitan transit authorities operate centralized bus depots ideal for overnight time-fill and daytime fast-fill refueling. Transit buses operate on predictable daily routes, eliminating range anxiety and maximizing fuel cost savings over high annual mileage. Light-duty passenger vehicles maintain high unit numbers in emerging regional markets where vehicle owners convert gasoline engines to dual-fuel operation to reduce daily commuting expenses. Medium- and heavy-duty trucks represent a growing sector, particularly for regional freight haulers, grocery distributors, and refuse collection vehicles. Fact.MR industry reviews of the heavy-duty cng trucks market and the renewable natural gas market confirm that heavy-duty commercial fleets remain the cornerstone of natural gas fuel consumption.
What is accelerating Compressed Natural Gas (CNG) Market adoption, and what is holding it back?
CNG adoption is advancing where fleet economics and depot operations align: fuel savings accumulate over high annual mileage, emissions rules favor cleaner combustion, and renewable gas improves the carbon case without changing the vehicle. Growth remains constrained where operators must fund high-pressure stations before securing sufficient fleet volume, or where public refueling gaps make routes difficult to plan.
Drivers Impact Analysis
| DRIVER | (~) % IMPACT ON CAGR | GEOGRAPHIC RELEVANCE | IMPACT TIMELINE |
|---|---|---|---|
| Retail fuel cost spread favoring CNG over diesel | +1.0% | North America, Europe, Asia | Short term (<= 2 years) |
| Municipal transit zero-emission transition programs | +0.9% | Europe, Latin America | Medium term (2–4 years) |
| Heavy-duty refuse fleet conversion mandates | +0.8% | North America, Europe | Medium term (2–4 years) |
| Renewable natural gas pipeline grid injection | +0.6% | North America, Europe | Medium term (2–4 years) |
| Factory-installed natural gas engine availability | +0.5% | Global | Long term (>= 4 years) |
Source: Fact.MR analysis. Updated Oct 17, 2026
Opportunity Impact Analysis
| OPPORTUNITY | (~) % IMPACT ON CAGR | GEOGRAPHIC RELEVANCE | IMPACT TIMELINE |
|---|---|---|---|
| Biomethane blending for negative-carbon transport | +0.8% | Europe, North America | Short term (<= 2 years) |
| Modular containerized fast-fill station skids | +0.7% | Global | Medium term (2–4 years) |
| High-capacity lightweight Type IV composite cylinders | +0.5% | North America, Europe | Medium term (2–4 years) |
| Dual-fuel vocational construction truck fleets | +0.4% | Latin America, Asia Pacific | Long term (>= 4 years) |
Source: Fact.MR analysis. Updated Oct 17, 2026
Restraints Impact Analysis
| RESTRAINT | (~) % IMPACT ON CAGR | GEOGRAPHIC RELEVANCE | IMPACT TIMELINE |
|---|---|---|---|
| High capital expenditure for high-pressure compression | -0.8% | Global | Short term (<= 2 years) |
| Public station density gaps on rural highways | -0.6% | North America, Europe | Medium term (2–4 years) |
| Onboard composite cylinder space and weight penalties | -0.5% | Global | Medium term (2–4 years) |
| Policy focus favoring battery-electric light vehicles | -0.4% | Europe, North America | Long term (>= 4 years) |
Source: Fact.MR analysis. Updated Oct 17, 2026
Which countries are scaling the Compressed Natural Gas (CNG) Market through 2036?
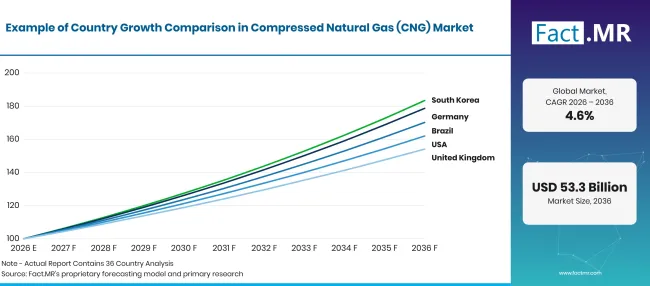
Factmr Compressed Natural Gas Cng Market Growth Index | Source: Fact.MR
| Country | CAGR (2026–2036) |
|---|---|
| Germany | 6.0% |
| Brazil | 5.5% |
| United States | 4.9% |
| United Kingdom | 4.4% |
| Japan | 3.9% |
Source: Fact.MR analysis. Updated Oct 17, 2026
Why is Germany leading European CNG growth?
6.0% CAGR, driven by municipal bus fleet biomethane conversions, industrial logistics alternative fuel adoption, and established gas transmission networks.
Germany’s 6.0% CAGR rests on a specific operating advantage: established gas grids can move certified biomethane from agricultural production into fleet-accessible stations. That connection gives municipal buses, refuse fleets, and regional distributors a way to reduce lifecycle emissions without waiting for charging capacity to be built across every depot.
How is Brazil expanding natural gas vehicle use?
5.5% CAGR, shaped by expanding domestic gas production, urban taxi and bus conversions, and regional pipeline infrastructure expansion.
Brazil is projected to grow at 5.5% as southeastern transport corridors gain access to more domestic gas. In Rio de Janeiro and São Paulo, the economics are reinforced by high-utilization taxis and buses, while additional pre-salt production can improve supply depth for fleet operators that remain exposed to liquid-fuel costs.
What is sustaining steady sales in the United States?
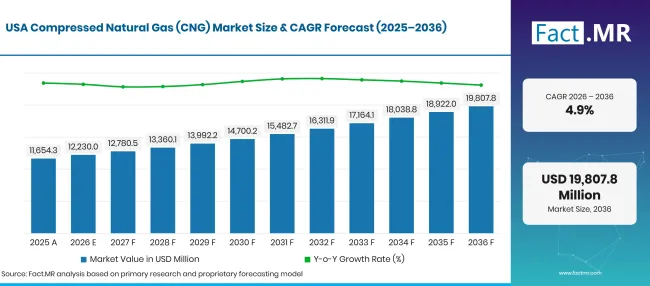
4.9% CAGR, supported by municipal refuse fleets, airport shuttle operations, and transit authority fuel purchases.
Factmr Compressed Natural Gas Cng Market Forecast Usa | Source: Fact.MR
The United States is expected to advance at 4.9%, led less by private vehicles than by fleets with predictable return-to-base duty cycles. Refuse trucks, airport shuttles, school buses, and transit vehicles can justify dedicated compression equipment because fuel demand is concentrated at a small number of depots.
Why is the United Kingdom adopting heavy-duty CNG vehicles?
4.4% CAGR, influenced by commercial freight fleet decarbonization targets and renewable biomethane filling station corridor expansion.
At 4.4% CAGR, United Kingdom demand is being shaped by freight operators that can document carbon savings from biomethane on repeat motorway routes. The business case is strongest for high-mileage tractors using a limited network of high-throughput stations rather than for vehicles dependent on broad public coverage.
How is Japan maintaining demand for commercial CNG?
3.9% CAGR, steered by metropolitan utility vehicle operations, port drayage fleet conversions, and urban air quality initiatives.
Japan’s 3.9% CAGR reflects a focused institutional market. Gas utilities, municipal service fleets, and port operators use CNG where vehicles operate within defined metropolitan or terminal routes, allowing refueling to remain centralized and exposure to diesel emissions to be reduced in dense operating zones.
Who leads the Compressed Natural Gas (CNG) Market?
Maruti Suzuki leads commercial passenger and light commercial vehicle production, capturing significant volume through factory-fitted S-CNG technology. Hyundai Motor Company and Tata Motors deliver broad lineups of dual-fuel passenger cars, light commercial vans, and heavy-duty transit buses designed for high-density transport markets. Volkswagen Group and Mercedes-Benz engineer specialized natural gas engines and commercial vans meeting European emissions standards.
BYD and Yutong Bus supply heavy-duty urban transit buses equipped with high-capacity roof-mounted composite cylinder arrays. Volvo Group and Scania AB manufacture heavy-duty long-haul natural gas trucks featuring high-efficiency gas engines tailored for regional distribution. Cummins Westport delivers dedicated spark-ignited natural gas engines utilized by major North American transit bus and refuse truck builders. Fact.MR studies covering the fuel dispensing systems market, the commercial vehicle alternative fuels market, and the clean transportation fuels market outline how engine manufacturer partnerships determine fuel adoption trajectories.
Which companies are the key providers?
Key companies include Maruti Suzuki; Hyundai; Tata Motors; Volkswagen; Mercedes-Benz; BYD; Yutong; Volvo; Scania; and Cummins Westport.
- Maruti Suzuki
- Hyundai
- Tata Motors
- Volkswagen
- Mercedes-Benz
- BYD
- Yutong
- Volvo
- Scania
- Cummins Westport
Bibliography
- [1] U.S. Department of Energy Alternative Fuels Data Center. (2025). Natural gas fuel basics, compression, and distribution infrastructure.
- [2] U.S. Department of Energy Alternative Fuels Data Center. (2025). Natural gas vehicles for fleet and public transit operations.
- [3] U.S. Department of Energy Alternative Fuels Data Center. (2025, January). Alternative fuel price report: Nationwide average fuel price comparison.
- [4] U.S. Department of Energy Alternative Fuels Data Center. (2024, October). Federal Clean School Bus Program statutory incentives and rebates.
- [5] U.S. Department of Energy Alternative Fuels Data Center. (2025). U.S. alternative fueling stations by fuel type dataset.
This Report Answers
- The report evaluates supply characteristics across non-associated dry gas fields, associated oilfield gas, and unconventional shale gas reserves.
- Application assessments explore why municipal transit bus fleets represent the largest single sector of vehicle-grade CNG demand.
- Country-level analysis investigates the regulatory and economic incentives supporting faster growth in Germany and Brazil.
- Fleet economic reviews detail how retail price spreads between natural gas and diesel influence commercial fleet conversion timelines.
- Competitive profiling benchmarks vehicle manufacturing volumes, dedicated gas engine portfolios, and fueling station partnerships across leading automotive brands.
What does the Compressed Natural Gas (CNG) Market cover?
This report follows the value of CNG sold as road-transport fuel through public stations and private fleet depots. Demand is traced across passenger vehicles, delivery vans, transit buses, refuse trucks, and regional freight fleets, with emphasis on how route structure and station utilization affect fuel consumption.
What is included in the scope?
Included revenues cover merchant and contracted CNG fuel sales, including compression and dispensing value recognized by station operators and gas distributors. Biomethane counts when it enters the same vehicle-fueling chain and is delivered through a CNG nozzle.
What is excluded from the scope?
LNG, industrial and power-generation gas, residential utility gas, conversion kits, vehicle components, and compression equipment sales sit outside the market boundary. Toll income and routine vehicle servicing are also excluded so the estimate remains focused on dispensed transport fuel.
How Was the Analysis Built?
The analysis draws on 120+ sources, 35+ company portfolios, 25+ countries, and more than 20 industry interviews.
- Primary Research: Primary research includes discussions with manufacturers, service providers, technology developers, distributors, end users, and subject-matter experts. These conversations examine purchasing priorities, product adoption, operational challenges, approval requirements, competitive positioning, and the factors that influence wider market acceptance.
- Desk Research: Desk research covers government statistics, regulatory publications, company filings, trade data, technical studies, industry associations, standards, public policy, and other authoritative sources. Every source used in the analysis is documented in the bibliography.
- Market Sizing and Forecasting: Market estimates combine historical performance, demand indicators, pricing and volume trends, segment shares, company participation, country-level growth, adoption patterns, investment activity, and barriers to market expansion.
- Data Validation and Update Cycle: Findings are validated by comparing primary interviews with public data, company activity, regulatory changes, trade patterns, and industry developments. Regular updates review new product launches, capacity changes, partnerships, approvals, and shifts in commercial adoption.
Segmentation
What is the report’s scope and coverage?
Factmr Compressed Natural Gas Cng Market Taxonomy | Source: Fact.MR
| Attribute | Details |
|---|---|
| Quantitative Units | USD billion in 2026 to USD billion by 2036 at 4.6% CAGR |
| Market Definition | Methane-rich natural gas compressed to high pressures (typically 3,000 to 3,600 psi) utilized as a clean-burning fuel for internal combustion engine vehicles. |
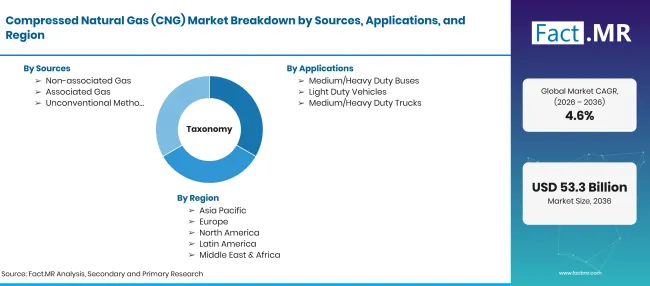
| Sources | Non-associated Gas; Associated Gas; Unconventional Methods |
| Applications | Medium/Heavy Duty Buses; Light Duty Vehicles; Medium/Heavy Duty Trucks |
| Regions Covered | North America; Latin America; Western Europe; Eastern Europe; East Asia; South Asia & Pacific; Middle East & Africa |
| Countries Covered | Germany; Brazil; United States; United Kingdom; Japan |
| Companies Profiled | Maruti Suzuki; Hyundai; Tata Motors; Volkswagen; Mercedes-Benz; BYD; Yutong; Volvo; Scania; Cummins Westport |
| Forecast Period | 2026 to 2036 |
| Approach | Analysis of vehicle registration records, fueling station throughput data, natural gas pipeline flows, and interviews with municipal fleet supervisors |
Source: Fact.MR analysis. Updated Oct 17, 2026
How is the market segmented?
-
By Sources
- Non-associated Gas
- Associated Gas
- Unconventional Methods
-
By Applications
- Medium/Heavy Duty Buses
- Light Duty Vehicles
- Medium/Heavy Duty Trucks
-
By Region
- North America
- Latin America
- Western Europe
- Eastern Europe
- East Asia
- South Asia & Pacific
- Middle East & Africa
Frequently Asked Questions
How big is the compressed natural gas market in 2026?
What is the CAGR from 2026 to 2036?
Which source leads?
Which application leads?
Which companies participate in compressed natural gas?
Who worked on this report


Preview the report firsthand - request a free sample
Free SampleGet the brochure for pricing and purchase details
Download PDF