- Market Value (2025): USD 52.4 Bn
- Estimated Value (2026): USD 56.2 Bn
- Forecast Value (2036): USD 113.6 Bn
- CAGR (2026-2036): 7.3%
What is the Assembly Line Solutions Market forecast to be worth by 2036?
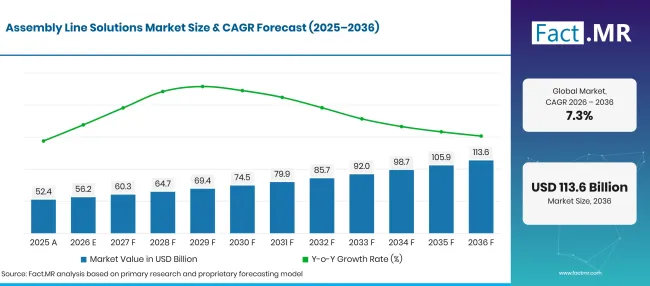
USD 56.2 billion in 2026 to USD 113.6 billion by 2036 at a 7.3% CAGR.
- Assembly line solutions revenue reached USD 52.4 billion in 2025 on Fact.MR figures, with car and electronics plants placing most of the orders.
- Spending on assembly automation will more than double from USD 56.2 billion in 2026 to USD 113.6 billion by 2036 as electric vehicle and electronics programs retool their lines.
- A 7.3% CAGR from 2026 to 2036 reflects steady line upgrades in plants that are swapping manual stations for robots and vision checks.
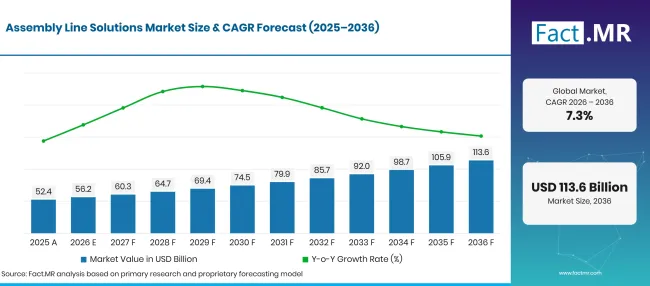
Factmr Assembly Line Solutions Market Forecast Global | Source: Fact.MR
| Year | Basis | Market Value (USD billion) |
|---|---|---|
| 2025 | Actual | 52.4 |
| 2026 | Estimate | 56.2 |
| 2036 | Forecast | 113.6 |
| CAGR 2026 to 2036 | Forecast period | 7.3% |
Source: Fact.MR analysis. Updated Oct 16, 2026
What are the defining numbers behind Assembly Line Solutions Market growth?
The decade will add USD 57.4 billion in value between 2026 and 2036, led by automotive and electronics lines.
- Demand Drivers in the Market
- Electric vehicle assembly lines need new stations for battery packs, e-axles and high-voltage wiring. The International Energy Agency reported that electric car sales exceeded 17 million in 2024, a share of more than 20% of global car sales [1]. Each new platform brings fresh orders for conveyors, joining cells and end-of-line testers.
- Labor shortages on factory floors push plants toward automated stations. Skilled line workers are retiring in Germany and Japan, and fewer young people apply for shift work. Robots and automatic screwdriving units keep cycle times stable with smaller crews.
- Software-defined production is changing how lines are run. In 2025, 20.0% of EU enterprises with 10 or more employees used artificial intelligence technologies, according to Eurostat [2]. On the shop floor, AI goes into vision inspection, predictive maintenance and line balancing.
- Traceability rules in automotive, medical device and pharmaceutical production require a record for every unit built. Line software logs torque values, test results and part serial numbers at each station, which supports recalls and audits.
- High-mix production is replacing long runs of a single model. Flexible transfer systems with independently moving carriers let one line build several variants without long changeovers.
- Key Segments Analyzed
- By Component: Hardware will account for 44.8% share in 2026 since every new line needs conveyors, robots and tooling before any software runs.
- By Application: Automotive will capture 32.6% share in 2026 as vehicle makers retool body, battery and final assembly lines for new electric platforms.
- By Deployment Mode: On-Premises will command 63.4% share in 2026, reflecting plant rules that keep real-time line control on local servers and controllers.
- By Enterprise Size: Large Enterprises will hold 71.2% share in 2026, owing to multi-plant budgets that fund complete line projects with integration and service contracts.
- By End-User: Manufacturing will represent 28.4% share in 2026 through repeat line purchases by machinery, electrical equipment and component producers.
- Analyst Opinion at Fact.MR
- Shambhu Nath Jha, Principal Consultant at Fact.MR, states, “Automakers and electronics firms now want lines that can switch models in hours, not weeks. Hardware still takes the bigger part of each project budget, but suppliers that bundle controllers, simulation and service will win the repeat orders. Labor gaps in Germany and Japan will keep automation budgets in place even in years when vehicle volumes slow.”
- Strategic Implications
- Equipment suppliers should offer modular stations and transfer systems that plants can reconfigure for a new model without rebuilding the whole line.
- Vehicle makers and Tier 1 suppliers should plan battery and e-drive lines with spare room for future cell chemistries and pack formats.
- System integrators should build virtual commissioning into every bid, given that simulation shortens start-up and cuts rework on site.
- Small and mid-size manufacturers should begin with single automated cells and collaborative robots before committing to full line projects.
Germany will lead at 8.4% CAGR, where car and machinery plants automate to offset a shrinking workforce. Brazil follows at 7.7%, helped by higher car output and machinery production. The United States will grow at 6.9% as vehicle and electronics plants modernize their lines at home. A 6.2% pace in the United Kingdom rests on public funding for zero-emission vehicle production. Japan completes the list at 5.5%, with robot use spreading to small factories that face staff gaps
How does the Assembly Line Solutions Market break down by segment?
Hardware at 44.8%, Automotive at 32.6%, On-Premises at 63.4%, Large Enterprises at 71.2% and Manufacturing at 28.4% will be the top subsegments in their categories in 2026.
Which Component dominates?
Hardware makes up 44.8% of 2026 sales.
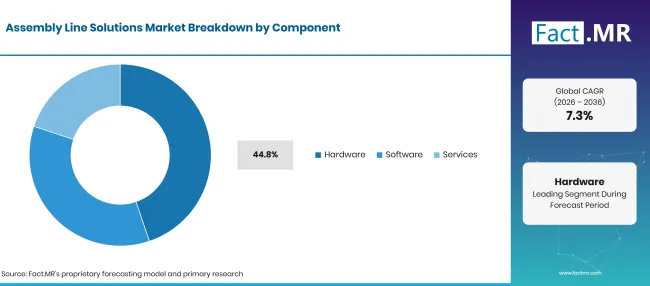
Factmr Assembly Line Solutions Market Breakdown Component | Source: Fact.MR
| Component | Share (2026) |
|---|---|
| Hardware (Leading segment) | 44.8% |
| Other segments combined | 55.2%* |
| Total | 100.0% |
Source: Fact.MR analysis. Updated Oct 16, 2026
Hardware for assembly lines forms the physical base of every project. Plants buy conveyors, fixtures and fastening tools for each station. Industrial robots take over welding, handling and joining tasks that once needed manual labor. Controllers and servo motors and drives set the motion and timing of each step. Line software ranges from PLC programming tools to manufacturing execution systems that schedule orders and record quality data. Services cover design, installation and maintenance contracts. The services portion of each project grows as lines rely more on software and remote support.
What leads the Application segment?
Automotive takes 32.6% of 2026 sales.
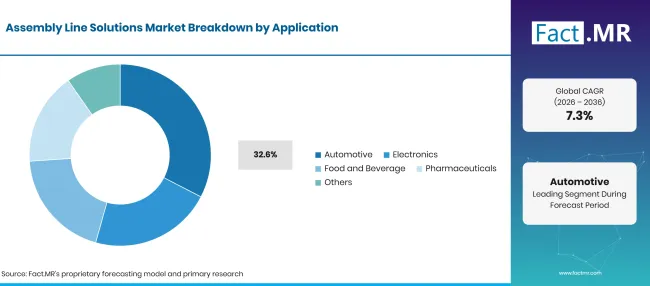
Factmr Assembly Line Solutions Market Breakdown Application | Source: Fact.MR
| Application | Share (2026) |
|---|---|
| Automotive (Leading segment) | 32.6% |
| Other segments combined | 67.4%* |
| Total | 100.0% |
Source: Fact.MR analysis. Updated Oct 16, 2026
Assembly automation in automotive plants covers body shops, battery pack lines and final trim. Carmakers renew these lines at each platform change, and electric models add new stations for cells and power electronics. European policy is directing funds to battery production in the region. The European Commission’s automotive action plan of March 2025 set out €1.8 billion from the Innovation Fund for a Battery Booster package [3]. Electronics assembly depends on fast placement, screwdriving and inspection of small parts. Robot vision systems check orientation and solder quality between stations. Food and beverage producers buy hygienic lines for packing and kitting. Pharmaceutical companies invest in device assembly for inhalers and prefilled syringes.
How does Deployment Mode shape demand?
On-Premises represents 63.4% of 2026 spending.
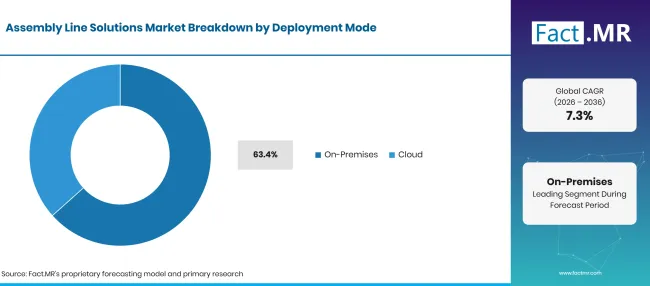
Factmr Assembly Line Solutions Market Breakdown Deployment Mode | Source: Fact.MR
| Deployment Mode | Share (2026) |
|---|---|
| On-Premises (Leading segment) | 63.4% |
| Other segments combined | 36.6%* |
| Total | 100.0% |
Source: Fact.MR analysis. Updated Oct 16, 2026
On-premises assembly line software runs on plant servers and edge controllers next to the machines it directs. Line control needs responses within milliseconds. Many plants also keep production data inside their own network for security reasons. Cloud-based assembly line tools are gaining ground for analytics, remote monitoring and software updates across sites. Eurostat reported that 52.7% of EU enterprises used paid cloud computing services in 2025, up 7.4 percentage points from 2023 [4]. Most plants run a hybrid setup, with real-time control on site and reporting in the cloud.
What supports Large Enterprises within Enterprise Size?
Large Enterprises account for 71.2% of 2026 orders.
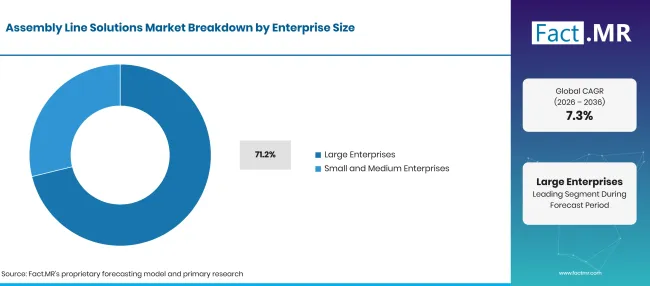
Factmr Assembly Line Solutions Market Breakdown Enterprise Size | Source: Fact.MR
| Enterprise Size | Share (2026) |
|---|---|
| Large Enterprises (Leading segment) | 71.2% |
| Other segments combined | 28.8%* |
| Total | 100.0% |
Source: Fact.MR analysis. Updated Oct 16, 2026
Big manufacturers fund complete lines across several plants and sign long service contracts with integrators. Eurostat data show that large businesses made up only 0.2% of EU enterprises in 2024 yet generated 51.3% of net turnover [5]. Smaller firms usually automate one cell at a time. Portable collaborative robot systems and rental models lower the entry cost for workshops with short runs and limited engineering staff.
Which End-User group leads?
Manufacturing holds 28.4% of 2026 demand.
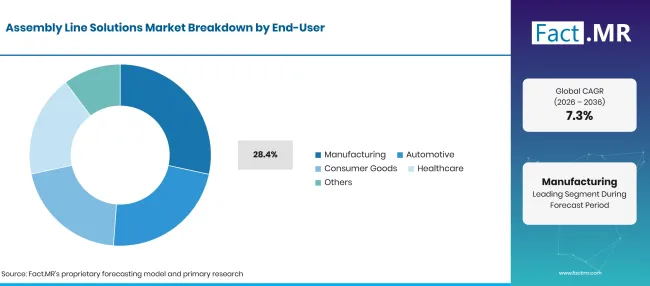
Factmr Assembly Line Solutions Market Breakdown End User | Source: Fact.MR
| End-User | Share (2026) |
|---|---|
| Manufacturing (Leading segment) | 28.4% |
| Other segments combined | 71.6%* |
| Total | 100.0% |
Source: Fact.MR analysis. Updated Oct 16, 2026
Machinery, electrical equipment and component makers assemble a wide range of products in medium volumes. They need flexible lines that handle frequent product changes and small batch sizes. Automotive end users purchase large integrated lines, while consumer goods firms want fast kitting and packing stations. Healthcare buyers require validated lines for devices such as inhalers and diagnostic kits, where each step must be documented.
What is accelerating Assembly Line Solutions Market adoption, and what is holding it back?
Adoption will rise with electric vehicle programs, labor shortages and the push for full traceability. High upfront cost, long payback for smaller plants and a shortage of automation engineers will hold growth back.
Drivers Impact Analysis
| DRIVER | (~) % IMPACT ON CAGR | GEOGRAPHIC RELEVANCE | IMPACT TIMELINE |
|---|---|---|---|
| Electric vehicle platform launches requiring new battery and drive assembly lines | +1.6% | East Asia, Western Europe, North America | Medium term (2-4 years) |
| Factory labor shortages and an aging skilled workforce | +1.3% | Western Europe, East Asia | Long term (>= 4 years) |
| High-mix production needing flexible transfer systems and robot cells | +1.1% | Global | Short term (<= 2 years) |
| Traceability requirements in automotive, medical device and drug production | +0.8% | North America, Western Europe | Short term (<= 2 years) |
| AI vision inspection and software-defined line control | +0.7% | Global | Medium term (2-4 years) |
Source: Fact.MR analysis. Updated Oct 16, 2026
Opportunity Impact Analysis
| OPPORTUNITY | (~) % IMPACT ON CAGR | GEOGRAPHIC RELEVANCE | IMPACT TIMELINE |
|---|---|---|---|
| Collaborative robot cells for small and mid-size manufacturers | +0.9% | Western Europe, North America, East Asia | Medium term (2-4 years) |
| Retrofit of legacy lines with new controllers and vision inspection | +0.7% | North America, Western Europe | Short term (<= 2 years) |
| Local assembly of batteries and electronics in new plants | +0.6% | North America, Latin America | Long term (>= 4 years) |
Source: Fact.MR analysis. Updated Oct 16, 2026
Restraints Impact Analysis
| RESTRAINT | (~) % IMPACT ON CAGR | GEOGRAPHIC RELEVANCE | IMPACT TIMELINE |
|---|---|---|---|
| High upfront cost and long payback for complete lines | -0.7% | Global | Short term (<= 2 years) |
| Shortage of automation engineers and system integrators | -0.5% | Western Europe, North America | Medium term (2-4 years) |
| Cyclical vehicle demand that delays line orders | -0.4% | Global | Short term (<= 2 years) |
Source: Fact.MR analysis. Updated Oct 16, 2026
Which countries are scaling the Assembly Line Solutions Market through 2036?
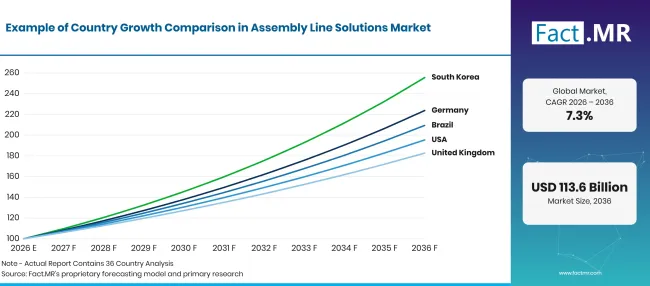
Factmr Assembly Line Solutions Market Growth Index | Source: Fact.MR
| Country | CAGR (2026–2036) |
|---|---|
| Germany | 8.4% |
| Brazil | 7.7% |
| United States | 6.9% |
| United Kingdom | 6.2% |
| Japan | 5.5% |
Source: Fact.MR analysis. Updated Oct 16, 2026
How is Germany scaling demand?
8.4% CAGR, driven by automation in car and machinery plants facing a shrinking workforce.
Assembly line solutions in Germany are tied to a car industry that is cutting staff while trying to hold output. Destatis reported that the automotive industry employed 721,400 people at the end of the third quarter of 2025 [6]. That was about 48,700 fewer than a year earlier [6]. Plants are replacing manual stations with robots and automated screwdriving to keep cycle times.
What supports Brazil’s growth?
7.7% CAGR, backed by higher car output and rising machinery production.
Automated assembly demand in Brazil follows its car and machinery plants. IBGE reported that Brazilian industry grew 0.6% in 2025, with automobile output up 3.3% and machinery and equipment up 5.0% [7]. Vehicle makers adding hybrid models to local lines need new stations for battery and electric drive assembly.
What supports United States adoption?
6.9% CAGR, reflecting line modernization at vehicle and electronics plants.
Factmr Assembly Line Solutions Market Forecast Global 1 | Source: Fact.MR
Line investment in the United States tracks vehicle output and plant upgrades. The Federal Reserve reported that motor vehicle assemblies ran at a seasonally adjusted annual rate of 10.43 million units in August 2026 [8]. Manufacturing capacity utilization stood at 75.7% in the same month [8]. With spare capacity on hand, plants can retool one line while others keep running.
How is the United Kingdom developing demand?
6.2% CAGR, helped by public funding for zero-emission vehicle production.
Robotic assembly in the United Kingdom is gaining support from public funds for vehicle plants. In July 2025, the government launched the £2.5 billion DRIVE35 programme to back zero-emission vehicle manufacturing and related research [9]. The programme covers high-volume vehicle plants and battery gigafactories in a sector that employs 132,000 people [9]. Aerospace and electronics firms add steady demand for precision assembly cells.
How does Japan perform?
5.5% CAGR, as factories add robots to cope with a shrinking manufacturing workforce.
Factory automation in Japan is driven by labor supply. The 2026 White Paper on Manufacturing Industries reported that manufacturing employment fell from 10.46 million in 2024 to 10.33 million in 2025 [10]. The same paper put the staff shortage index for small and mid-size manufacturers at minus 17.9 in 2025 [10]. With a mature robot base, much of Japan’s spending goes to upgrades and small-lot production cells.
Who leads the Assembly Line Solutions Market?
Competition splits into three roles. Siemens, Rockwell Automation, Mitsubishi Electric and Schneider Electric sell the controllers and line software that every station needs.
In March 2025, Siemens said Audi was using its Simatic S7-1500V virtual controller for a car body assembly line at Neckarsulm [11]. Rockwell Automation announced a new greenfield manufacturing campus in southeastern Wisconsin in November 2025, adding automation and robotics to its own production [12]. Robot and motion specialists form the second group. FANUC supplies industrial and collaborative robots. B&R, a member of the ABB Group, offers track-based product transport for flexible lines. Bosch Rexroth sells transfer systems and ctrlX automation, and in March 2026 it introduced the TS 7plus transfer system for heavy workpieces in automotive and battery production [13]. ATS Corporation works as a turnkey builder that designs complete assembly systems on its SuperTrak conveyance platform. Supplier choice will turn on changeover speed, integration skill and service coverage near the plant.
Which companies are the key providers?
Key companies include Siemens AG; Rockwell Automation, Inc.; Mitsubishi Electric Corporation; Schneider Electric SE; ABB Ltd. (B&R); FANUC Corporation; Bosch Rexroth AG; and ATS Corporation.
- Siemens AG
- Rockwell Automation, Inc.
- Mitsubishi Electric Corporation
- Schneider Electric SE
- ABB Ltd. (B&R)
- FANUC Corporation
- Bosch Rexroth AG
- ATS Corporation
Bibliography
- [1] International Energy Agency. (2025, May). Global EV Outlook 2025: Executive summary.
- [2] Eurostat. (2025, December 11). 20% of EU enterprises use AI technologies.
- [3] European Commission. (2025, March). Action Plan on the future of the automotive sector (Factsheet).
- [4] Eurostat. (2026, February 3). 53% EU enterprises used paid cloud services in 2025.
- [5] Eurostat. (2025, December 9). Large businesses in the EU: small number, high turnover.
- [6] Statistisches Bundesamt (Destatis). (2025, November 20). Stellenabbau in der Automobilindustrie: 48 700 weniger Beschäftigte zum Ende des 3. Quartals 2025 als ein Jahr zuvor [Job cuts in the automotive industry: 48,700 fewer employees at the end of Q3 2025 than a year earlier].
- [7] Instituto Brasileiro de Geografia e Estatística (IBGE). (2026, February 3). Produção industrial recua 1,2% em dezembro [Industrial production falls 1.2% in December].
- [8] Board of Governors of the Federal Reserve System. (2026, September 18). Industrial Production and Capacity Utilization (G.17).
- [9] Department for Business and Trade, United Kingdom. (2025, July 13). Backing British Industry: Government launches £2.5bn DRIVE35 programme to power UK auto investment and jobs.
- [10] Ministry of Economy, Trade and Industry, Japan. (2026, May). 2026年版ものづくり白書 概要 [2026 White Paper on Manufacturing Industries: Summary].
- [11] Siemens AG. (2025, March 27). Siemens and Audi are taking the shop floor to the next level with AI and IT-empowered automation at scale.
- [12] Rockwell Automation, Inc. (2025, November 18). Rockwell Automation to Build New Greenfield Manufacturing Site in Southeastern Wisconsin.
- [13] Bosch Rexroth. (2026, March 31). Bosch Rexroth announces next-generation conveyor capable of transporting heavy payloads up to 3000kg.
This Report Answers
- Revenue for assembly line solutions is sized for 2025, 2026 and 2036, with growth traced to component and application demand.
- Each of the five segments carries its 2026 leader and the plant requirements behind that position.
- Five countries are compared on workforce trends, vehicle output and public support for manufacturing.
- Company profiles group suppliers into control platforms, robot and motion specialists and turnkey line builders.
- Drivers, opportunities and restraints are scored for their impact on CAGR and their timing.
What does the Assembly Line Solutions Market cover?
Automated and semi-automated lines for discrete products fall within the Assembly Line Solutions Market. Typical lines include body and final assembly in vehicle plants, electronics assembly and medical device assembly.
Revenue is counted at the level of line equipment, software licenses and service contracts sold to manufacturers. On-premises and cloud deployments are both tracked, as are purchases by large enterprises and SMEs.
What is included in the scope?
Conveyors and transfer systems, robot cells, joining stations and test stations are in scope. Software for line control, simulation and production execution is included along with integration and maintenance services.
Mobile industrial robots that feed parts to the line are counted when sold as part of an assembly project.
What is excluded from the scope?
Standalone machine tools and process plants for chemicals or refining are excluded. Continuous process control systems used in oil, gas and power are also left out.
General enterprise IT and ERP software used outside the plant floor is not counted. Spare parts sold through distributors without a service contract are not counted either.
How Was the Analysis Built?
The analysis draws on 120+ sources, 35+ company portfolios, 25+ countries, and more than 20 industry interviews.
- Primary Research: Primary research includes discussions with manufacturers, service providers, technology developers, distributors, end users, and subject-matter experts. These conversations examine purchasing priorities, product adoption, operational challenges, approval requirements, competitive positioning, and the factors that influence wider market acceptance.
- Desk Research: Desk research covers government statistics, regulatory publications, company filings, trade data, technical studies, industry associations, standards, public policy, and other authoritative sources. Every source used in the analysis is documented in the bibliography.
- Market Sizing and Forecasting: Market estimates combine historical performance, demand indicators, pricing and volume trends, segment shares, company participation, country-level growth, adoption patterns, investment activity, and barriers to market expansion.
- Data Validation and Update Cycle: Findings are validated by comparing primary interviews with public data, company activity, regulatory changes, trade patterns, and industry developments. Regular updates review new product launches, capacity changes, partnerships, approvals, and shifts in commercial adoption.
Segmentation
What is the report’s scope and coverage?
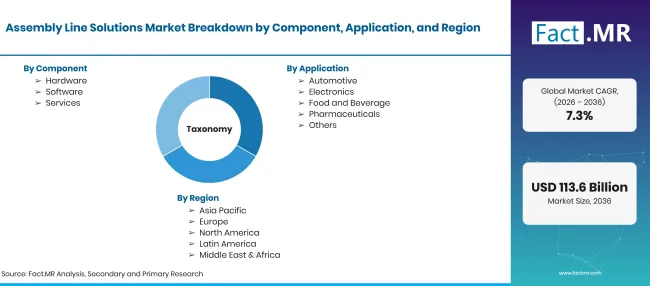
Factmr Assembly Line Solutions Market Taxonomy | Source: Fact.MR
| Attribute | Details |
|---|---|
| Quantitative Units | USD billion |
| Market Definition | Hardware, software and services used to design, build, control and maintain automated and semi-automated assembly lines for discrete products. Revenue covers line equipment, control and execution software, integration and after-sales service. |
| Component | Hardware; Software; Services |
| Application | Automotive; Electronics; Food and Beverage; Pharmaceuticals; Others |
| Deployment Mode | On-Premises; Cloud |
| Enterprise Size | Large Enterprises; Small and Medium Enterprises |
| End-User | Manufacturing; Automotive; Consumer Goods; Healthcare; Others |
| Regions Covered | North America; Latin America; Western Europe; Eastern Europe; East Asia; South Asia & Pacific; Middle East & Africa |
| Countries Covered | Germany; Brazil; United States; United Kingdom; Japan |
| Companies Profiled | Siemens AG; Rockwell Automation, Inc.; Mitsubishi Electric Corporation; Schneider Electric SE; ABB Ltd. (B&R); FANUC Corporation; Bosch Rexroth AG; ATS Corporation |
| Forecast Period | 2026 to 2036 |
| Approach | Bottom-up count of line projects by industry, cross-checked against manufacturing investment; vehicle and electronics output; component and deployment split by country; and supplier portfolio review. |
Source: Fact.MR analysis. Updated Oct 16, 2026
How is the market segmented?
-
By Component
- Hardware
- Software
- Services
-
ByApplication
- Automotive
- Electronics
- Food and Beverage
- Pharmaceuticals
- Others
-
By Deployment Mode
- On-Premises
- Cloud
-
By Enterprise Size
- Large Enterprises
- Small and Medium Enterprises
-
By End-User
- Manufacturing
- Automotive
- Consumer Goods
- Healthcare
- Others
-
By Region
- North America
- Latin America
- Western Europe
- Eastern Europe
- East Asia
- South Asia & Pacific
- Middle East & Africa
Frequently Asked Questions
How big is the assembly line solutions market in 2026?
What is the CAGR of the assembly line solutions market from 2026 to 2036?
Which component leads the assembly line solutions market?
Which application leads the assembly line solutions market?
Which deployment mode leads the assembly line solutions market?
Which enterprise size leads the assembly line solutions market?
Which end-user leads the assembly line solutions market?
Which country will grow the most in the assembly line solutions market?
Who are the main companies in the assembly line solutions market?
Who worked on this report


Preview the report firsthand - request a free sample
Free SampleGet the brochure for pricing and purchase details
Download PDF