- Market Value (2025): USD 1039.0 Bn
- Estimated Value (2026): USD 1176.1 Bn
- Forecast Value (2036): USD 4063.7 Bn
- CAGR (2026-2036): 13.2%
What is the Digital Media Market forecast to be worth by 2036?
USD 1,176.1 billion in 2026 to USD 4,063.7 billion by 2036, at 13.2% CAGR.
- The digital media market crossed a valuation of USD 1,039.0 billion in 2025 supported by expanding streaming subscriptions and mobile media spending across major regions.
- Demand is projected to increase from USD 1,176.1 billion in 2026 to USD 4,063.7 billion by 2036.
- The market is forecast to record a 13.2% CAGR from 2026 to 2036 driven by increased spending on measurable audience reach among advertisers and streaming operators.
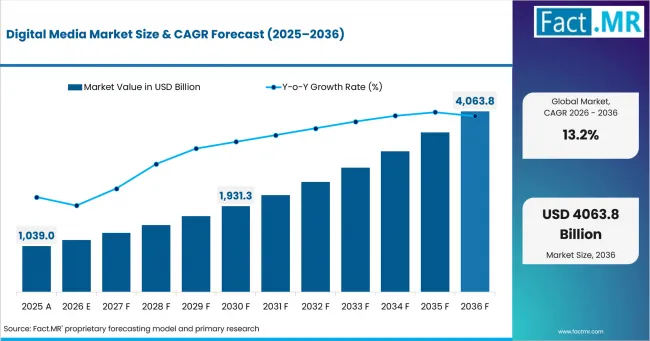
Digital Media Market Market Value Analysis | Source: Fact.MR
What are the defining numbers behind Digital Media Market growth?
USD 2,887.6 billion absolute opportunity by 2036, led by Video, Smartphone and Advertising-supported models.
- Demand Drivers in the Market
- Streaming operators need cross-device delivery controls because viewers move between smartphones and televisions during the same content discovery and viewing journey.
- Brand media teams need verified audience measurement so advertising budgets shift between video inventory and social feeds without losing campaign attribution.
- Content studios need faster localization workflows owing to multilingual release schedules that shorten the time between production completion and regional platform launches.
- Enterprise learning teams need secure media delivery supported by mobile access and searchable libraries that fit distributed workforce training across several locations.
- Key Segments Analyzed
- By Content Type: Video is expected to hold 37.2% share in 2026 supported by streaming libraries and short-form viewing across connected services.
- By Platform: Smartphone is projected to account for 45.4% share in 2026 owing to continuous app access and portable video consumption.
- By Application: Marketing & Advertising is anticipated to capture 33% share in 2026 shaped by measurable campaign delivery and platform-level audience targeting.
- By Industry Vertical: Entertainment is estimated to represent 39.4% share in 2026 attributable to recurring release schedules and direct-to-consumer viewing services.
- By Business Model: Advertising-supported is forecast to account for 61.3% share in 2026 driven by lower entry prices and wider advertiser access to streaming inventory.
- Analyst Opinion at Fact.MR
- Shambhu Nath Jha, Senior Analyst at Fact.MR states: “Digital media competition now depends on recognizing when the same audience moves between apps and devices. Adoption is expected to favor providers that connect content delivery with privacy-respecting measurement without making viewing harder for users. Providers should combine rights tracking with clear campaign reporting and keep language adaptation support close to regional content teams.”
- Strategic Implications
- Streaming operators should connect subscription-access records with ad delivery records before extending mixed subscription and advertising plans across more devices and national markets.
- Advertisers should test limits that prevent excessive repeat exposure before shifting budgets between connected television inventory and short-form mobile video at commercial scale.
- Publishers should package their own audience data with clear consent records so media agencies compare targeted ad inventory without rebuilding measurement work for every campaign.
- Content studios should shorten language approval cycles and define reusable rights records before releasing video assets across regional services and separate distribution windows.
Netflix made its Ads Suite live in the United States and Canada in May 2025, then scheduled EMEA expansion for the following week as part of its in-house advertising rollout. The move reflects a wider shift toward platform-owned advertising technology that links streaming inventory to audience measurement inside a single commercial workflow.
China is expected to record a 14.2% CAGR by 2036, driven by mobile internet scale and expanding online entertainment services. Japan is projected to post a 14.1% CAGR during the forecast period, supported by premium streaming services and mobile-first content discovery. Germany is anticipated to advance at a 12.4% CAGR over the assessment period, owing to connected television viewing and active social media use. The United States is estimated to record an 11.7% CAGR between 2026 and 2036, attributable to high mobile broadband penetration and multi-platform video consumption. The United Kingdom is forecast to post an 11.6% CAGR by 2036, shaped by subscription streaming penetration and broad online video reach.
How does the Digital Media Market break down by segment?
Video record around 37.2% share, Smartphone leads at 45.4%.
Which Content Type dominates?
Video holds 37.2% share in 2026.
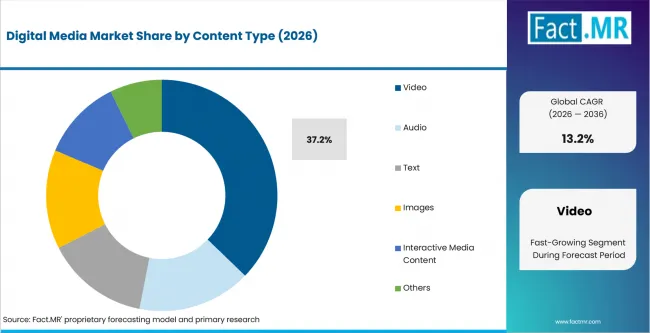
Digital Media Market Analysis By Content Type | Source: Fact.MR
Video is expected to hold 37.2% share in 2026 supported by streaming libraries and short-form viewing across connected platforms. Audio supports subscription music and podcasts whereas Text remains central to news or professional information services. Images and Interactive Media Content support social feeds or creator tools that require faster production and frequent audience response. In July 2025 Eurostat reported that 79% of EU internet users watched television or video online during 2024. The viewing base keeps video central to content budgets and other formats extend reach across different stages of the user journey.
What leads the Platform segment?
Smartphone represents around 45.4% share in 2026.
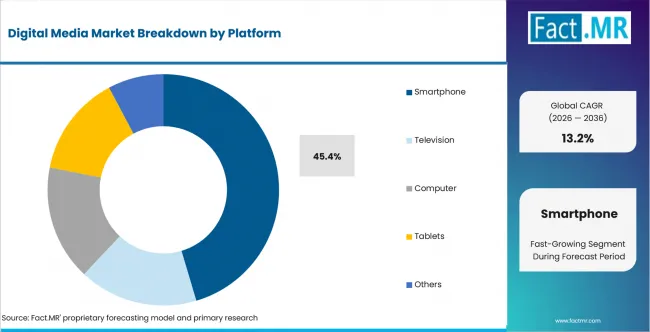
Digital Media Market Analysis By Platform | Source: Fact.MR
Smartphone is projected to account for 45.4% share in 2026 owing to continuous app access and personal viewing during commuting or leisure periods. Television remains central to long-form entertainment and Computer platforms support work-related media or professional content discovery. Tablets serve education and household viewing where larger screens support reading or video use without limiting users to one room. In December 2025 Ofcom reported that UK adults spent an average of 4.5 hours online daily during May 2025. The finding supports mobile media budgets because smartphones account for much personal online time and provide repeated opportunities to reach users.
How does Application shape demand?
Marketing & Advertising holds 33% share in 2026.
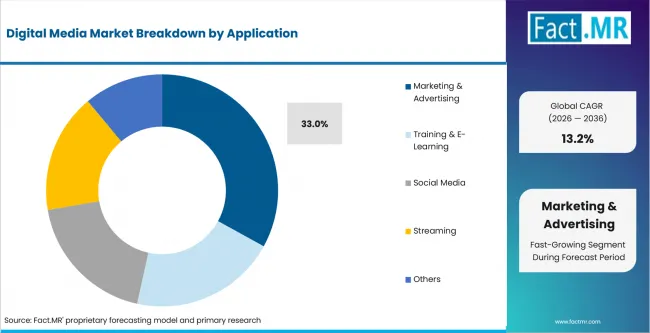
Digital Media Market Analysis By Application | Source: Fact.MR
Marketing & Advertising is anticipated to capture 33% share in 2026 shaped by measurable campaign delivery across publisher and streaming inventory. Training & E-Learning uses secure libraries and progress records whereas Social Media depends on rapid publishing and short feedback cycles. Streaming applications depend on content rights and delivery quality across paid services or advertising-funded services. In October 2025 Amazon reported that its advertising partnerships let media teams buy space on Netflix and Spotify through Amazon Ads. The arrangement reflects a move toward simpler campaign buying across services that previously required separate commercial processes.
What supports Entertainment within Industry Vertical?
Entertainment holds 39.4% share in 2026.
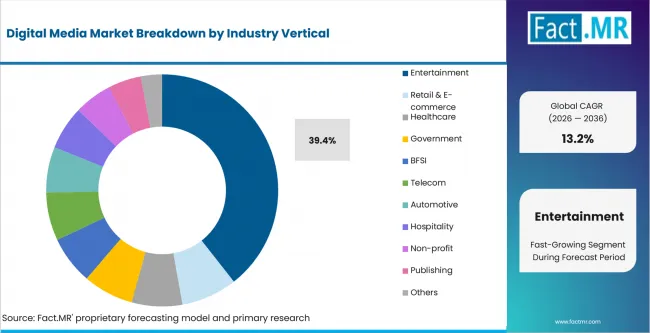
Digital Media Market Analysis By Industry Vertical | Source: Fact.MR
Entertainment is estimated to represent 39.4% share in 2026 attributable to recurring releases and direct distribution across video or music services. Retail & E-commerce uses creator content and product video whereas Healthcare relies on controlled media for education or communication. Government and BFSI accounts emphasize access control and Telecom companies use media bundles to support subscriber retention. In March 2026 IFPI reported that streaming generated 69.6% of global recorded music income during 2025. The revenue mix keeps entertainment companies focused on paid-plan conversion and advertising formats that earn more from recurring audience sessions.
What leads the Business Model segment?
Advertising-supported accounts for 61.3% share in 2026.
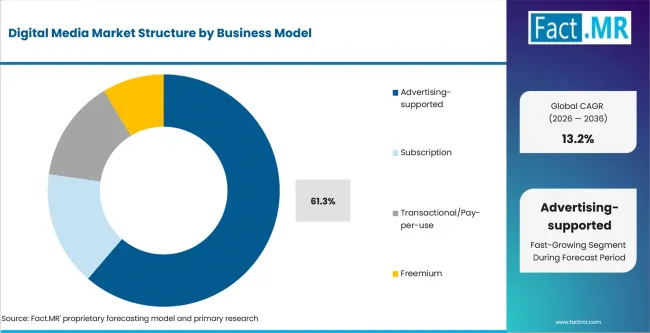
Digital Media Market Analysis By Business Model | Source: Fact.MR
Advertising-supported is forecast to account for 61.3% share in 2026 driven by lower access barriers and wider advertising space across video services. Subscription remains relevant for premium libraries and bundled sports whereas Transactional models serve releases tied to individual purchase events. Freemium structures offer limited access before users move into paid tiers that remove restrictions or expand available content. In May 2026, Netflix reported that its advertising-supported viewing reached more than 250 million global monthly active viewers. The scale gives advertisers a direct reason to compare streaming space with established video channels and platforms continue improving reporting controls.
What is accelerating Digital Media Market adoption, and what is holding it back?
Mobile video consumption drives it, measurement fragmentation restrains it.
Drivers Impact Analysis
| DRIVER | (~) % IMPACT ON CAGR | GEOGRAPHIC RELEVANCE | IMPACT TIMELINE |
|---|---|---|---|
| Mobile-first video consumption | +2.4% | Global with Asia Pacific emphasis | Medium term (2-4 years) |
| Streaming and social reach expansion | +2.0% | North America and Europe | Medium term (2-4 years) |
| Hybrid advertising monetization | +1.7% | United States and Western Europe | Short term (<= 2 years) |
| Broadband quality upgrades | +1.3% | OECD countries and urban growth centers | Long term (>= 4 years) |
| Enterprise learning media use | +0.8% | Global enterprise accounts | Medium term (2-4 years) |
Source: Fact.MR analysis. Updated Jul 7, 2026
- Mobile-first video consumption: Personal devices now carry more content discovery and viewing because users open several media services during the same day. In November 2025 the International Telecommunication Union reported that 6 billion people were online during 2025. That connected audience gives media teams more reason to design shorter viewing paths for smartphones. Platform investment is expected to favor delivery systems that keep streams stable when mobile network quality changes during a viewing session.
- Streaming and social reach expansion: Content owners now reach users through several direct routes instead of depending on one schedule or distribution channel. Video libraries support longer viewing sessions and social feeds create repeat discovery around clips or creator posts. Media owners are projected to reuse cleared content assets across both environments under coordinated release plans. Commercial gains depend on audience controls that reduce excessive repeat exposure and keep campaign reports comparable across services.
- Hybrid advertising monetization: Lower-priced streaming tiers add campaign revenue to subscription income and give media agencies more video advertising space. Measurement methods still differ across platforms which makes direct campaign comparisons harder for media agencies. Adoption is anticipated to expand where platforms provide clear reach reports and consistent controls for advertiser suitability. Commercial teams also need sales packages that explain how streaming exposure fits within wider media plans.
- Broadband quality upgrades: Better broadband lowers the cost of delivering high-resolution video because fewer buffering failures reduce abandoned sessions and customer support pressure. In October 2025 OECD data showed fibre reached 47% of fixed broadband subscriptions across member countries by the end of 2024. Streaming operators are estimated to expand higher-quality viewing offers where access networks provide stable performance. Rights owners still need testing across devices because household network conditions differ across service areas and equipment combinations.
- Enterprise learning media use: Distributed teams increase demand for secure libraries that deliver training content across remote staff and several operating sites. Learning managers need searchable video and access records that support compliance programs without forcing employees into separate media systems. Demand is forecast to expand where providers connect content delivery with user access management and clear reporting. Procurement teams still compare data retention rules before approving wider deployment across business units and national operations.
Opportunity Impact Analysis
| OPPORTUNITY | (~) % IMPACT ON CAGR | GEOGRAPHIC RELEVANCE | IMPACT TIMELINE |
|---|---|---|---|
| Cross-platform advertising measurement | +1.2% | North America and Europe | Short term (<= 2 years) |
| Localized short-form video | +0.9% | China and Japan | Medium term (2-4 years) |
| Bundled streaming and sports | +0.8% | United States and United Kingdom | Medium term (2-4 years) |
| Enterprise creator workflows | +0.6% | Europe and North America | Long term (>= 4 years) |
Source: Fact.MR analysis. Updated Jul 7, 2026
- Cross-platform advertising measurement: Advertisers need tools that compare campaign exposure across streaming services and publisher environments using consistent definitions. Larger budget shifts depend on clear reach reporting before advertisers commit more spending to targeted video across several services. Opportunity is expected to expand where providers connect privacy-respecting audience controls with frequency reporting across campaigns that use several media channels. The practical advantage comes from reducing repeated exposure without forcing media teams to rebuild each campaign process.
- Localized short-form video: Short-form production gives studios and brands a faster way to adapt stories for regional languages and platform behavior. In February 2026 the National Bureau of Statistics of China reported 395.8 billion gigabytes of mobile internet traffic during 2025. Production teams are projected to increase local editing and caption workflows where mobile traffic supports frequent viewing. Commercial gains depend on clear rights approval that keeps short clips aligned with regional release terms.
- Bundled streaming and sports: Combined offers help services reduce account switching by bringing live events together with broader entertainment libraries. In November 2025 The Walt Disney Company reported 196 million combined Disney+ and Hulu subscriptions at the end of fiscal 2025. Bundling activity is anticipated to increase where services share account management and clearly show who has access to each title. Operators still need pricing structures that remain understandable after promotions end and household renewal decisions return to regular rates.
- Enterprise creator workflows: Business teams need simpler publishing systems that keep approval records close to video production and campaign distribution. In June 2026 Eurostat reported that 63.6% of EU enterprises used social media during 2025. Providers are estimated to gain more enterprise work where creation and review steps use the same controlled access process. The clearest commercial route appears when brand teams reuse approved assets without losing ownership or consent records during later campaigns.
Restraints Impact Analysis
| RESTRAINT | (~) % IMPACT ON CAGR | GEOGRAPHIC RELEVANCE | IMPACT TIMELINE |
|---|---|---|---|
| Measurement fragmentation across platforms | -1.0% | Global advertising accounts | Medium term (2-4 years) |
| Content rights and localization cost | -0.8% | Europe and Asia Pacific | Long term (>= 4 years) |
| Subscription churn sensitivity | -0.6% | North America and Western Europe | Short term (<= 2 years) |
| Safety and compliance workload | -0.5% | Europe and regulated online services | Medium term (2-4 years) |
Source: Fact.MR analysis. Updated Jul 7, 2026
- Measurement fragmentation: Budget movement slows when platforms define reach and audience attention differently across otherwise comparable video advertising space. Media agencies spend extra time reconciling reports before judging campaign frequency or additional reach across comparable periods and services. Adoption is expected to remain selective where data export rules prevent consistent analysis between platforms. Providers reduce friction when campaign reports use definitions that procurement teams compare directly before contract renewal and annual budget allocation.
- Content rights and localization cost: Rights and language adaptation costs limit how quickly one media asset moves across countries or service tiers. Studios must track music rights and territory restrictions whereas language teams manage local versions under release deadlines. Expansion is projected to favor platforms that keep rights records tied directly to each content asset. Smaller publishers remain constrained when manual clearance work consumes staff time that would otherwise support production.
- Subscription churn sensitivity: Streaming services must balance price increases against household expectations for fresh content and simpler bundles. In July 2025 Ofcom reported that 28% of Netflix subscribers used its Standard with Ads tier during the first quarter of 2025. Growth is anticipated to depend more on customer retention where household streaming penetration is already broad. Services need clear differences between plans before raising prices or changing the number of advertisements shown across packages.
- Safety and compliance workload: Services that host user content or advertise to younger audiences face greater review requirements. Platform teams must combine content moderation with advertiser controls and age-related protections under changing national rules. Investment is estimated to rise where regulators require stronger evidence that services identify risks and show how they reduce them. Compliance costs weigh more heavily on smaller services that lack dedicated policy teams and share staff across product or legal work.
Which countries are scaling Digital Media Market fastest?
China 14.2%, Japan 14.1%, Germany 12.4%, United States 11.7%, United Kingdom 11.6%.
Digital Media Market is segmented into North America, Europe, Asia Pacific, Central & South America, and the Middle East & Africa.
| COUNTRY | CAGR |
|---|---|
| China | 14.2% |
| Japan | 14.1% |
| Germany | 12.4% |
| United States | 11.7% |
| United Kingdom | 11.6% |
Source: Fact.MR analysis. Updated Jul 7, 2026
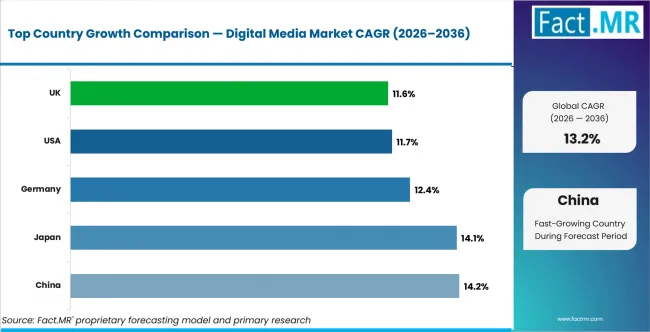
Digital Media Market Cagr Analysis By Country | Source: Fact.MR
What is powering China’s expansion?
14.2% CAGR through 2036, driven by mobile internet scale and expanding online entertainment consumption.
China’s enormous, connected audience gives digital media companies substantial reach across mobile video and online entertainment services nationwide. The National Bureau of Statistics reported in February 2026 that China had 1.125 billion internet users at the end of 2025. Market demand is expected to advance at 14.2% CAGR through 2036 as mobile viewing supports frequent short-form content consumption. Platforms can strengthen advertiser value by aligning recommendation systems and campaign tools with domestic viewing patterns across major audience segments.
How is Japan scaling digital media demand?
14.1% CAGR through 2036, supported by established online purchasing habits and premium streaming services.
Japan combines widespread device access with established online purchasing habits that support content discovery and paid digital entertainment services. In September 2025, the Statistics Bureau of Japan reported that 55.3% of two-or-more-person households used internet shopping during 2024. Demand is projected to rise at 14.1% CAGR through 2036 as mobile discovery and premium streaming support recurring spending on entertainment. Media providers can expand conversion by linking viewing discovery with simple subscription journeys across connected consumer services.
What supports Germany’s outlook?
12.4% CAGR through 2036, owing to widespread social media participation and increasingly fragmented connected viewing habits.
Germany offers advertisers extensive connected reach while publishers balance subscription income with advertising-funded distribution across multiple digital formats. In March 2026, Destatis reported that 59% of residents aged sixteen to seventy-four used social media privately during 2025. The market is anticipated to advance at 12.4% CAGR through 2036 as audiences divide attention across social platforms and video services. Publishers and advertisers can improve monetization by coordinating subscription offers with campaigns designed for fragmented cross-platform viewing habits.
What underpins United States demand?
11.7% CAGR through 2036, attributable to high mobile broadband penetration and extensive streaming inventory.
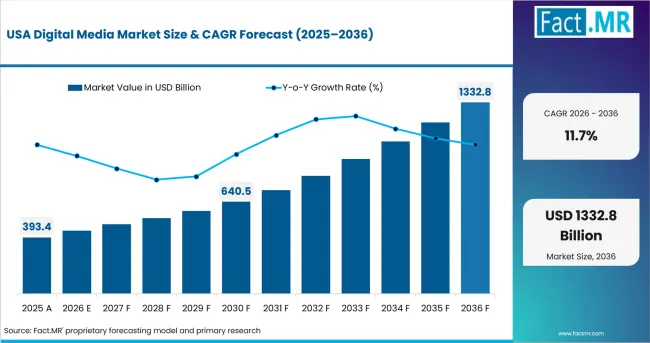
Digital Media Market Country Value Analysis | Source: Fact.MR
High mobile broadband penetration gives United States digital media companies a large connected base for streaming and advertising services. In October 2025, the OECD reported mobile broadband penetration at 200 subscriptions per 100 inhabitants in the United States. The market is estimated to record 11.7% CAGR through 2036 as connected-device use expands available streaming inventory and advertising opportunities. In June 2025, Apple intensified discovery competition by redesigning Apple TV browsing around more visual content presentation.
How is the United Kingdom developing digital media demand?
11.6% CAGR through 2036, shaped by broad subscription streaming reach and competition for cross-platform viewing time.
Subscription streaming has broad household reach in the United Kingdom and competes directly with broadcasters for viewing time and advertising budgets. In July 2025, Ofcom reported that 68% of UK households received at least one subscription video-on-demand service during Q1 2025. Demand is forecast to expand at 11.6% CAGR through 2036 as mixed subscription and advertising models compete for cross-platform attention. Media providers will need stronger content discovery and audience measurement capabilities to protect engagement across increasingly fragmented viewing environments.
Who leads the Digital Media Market?
Amazon and Netflix lead direct digital media coverage, while Apple and The Walt Disney Company strengthen premium video and bundled service capability.
Amazon combines Prime Video distribution with advertising technology and commerce signals that connect entertainment audiences to campaign planning across its broader services. Netflix operates a global streaming service and its own advertising technology and Apple links television discovery to its device and services ecosystem. Competition centers on content access and audience reporting whereas account convenience shapes household movement between paid plans and advertising-funded access.
In May 2025 The Walt Disney Company announced its direct ESPN streaming offer for launch later that year. Sony Group used its May 2025 strategy presentation to outline plans for expanding Crunchyroll membership and broadening anime services. Paramount Skydance Corporation completed the Paramount-Skydance combination in August 2025 and brought both businesses under the current corporate structure. Fox Corporation introduced FOX One in May 2025 as a direct streaming service combining news with sports and entertainment. Competition through 2036 is expected to be shaped by content rights and cross-device discovery across major services. Audience reporting remains central to advertising-funded services today and is anticipated to retain that role across the forecast period.
Which companies are the key providers?
Amazon and Netflix are key providers. Apple and The Walt Disney Company are also profiled. Sony Group Corporation, Paramount Skydance Corporation and Fox Corporation complete the company set.
- Amazon.com, Inc.
- Netflix, Inc.
- Apple Inc.
- The Walt Disney Company
- Sony Group Corporation
- Paramount Skydance Corporation
- Fox Corporation
Bibliography
- Amazon.com, Inc. (2025, October 30). Amazon.com announces third quarter results. Amazon.com, Inc.
- Apple Inc. (2025, June 9). Apple TV brings a beautiful redesign and an enhanced entertainment experience to the home. Apple Inc.
- Eurostat. (2025, July 10). EU people turn to internet for cultural purposes. Eurostat.
- Eurostat. (2026, June 12). Social media - statistics on the use by enterprises. Eurostat.
- Fox Corporation. (2025, May 12). FOX unveils name of new streaming service - FOX One. Fox Corporation.
- International Federation of the Phonographic Industry. (2026, March 18). Global Music Report 2026: Global recorded music revenues grow 6.4% as record companies drive innovation. IFPI.
- International Telecommunication Union. (2025, November 17). ITU's Facts and Figures 2025 shows steady progress in global connectivity while quality and affordability gaps persist. International Telecommunication Union.
- National Bureau of Statistics of China. (2026, February 28). Statistical communiqué of the People’s Republic of China on the 2025 national economic and social development. National Bureau of Statistics of China.
- Netflix, Inc. (2025, May 14). Netflix Upfront 2025: The Center of Attention. Netflix, Inc.
- Netflix, Inc. (2026, May 13). Netflix Upfront 2026: Get Closer. Netflix, Inc.
- Ofcom. (2025, July 30). Media Nations 2025. Ofcom.
- Ofcom. (2025, December 10). Online Nation 2025. Ofcom.
- Organisation for Economic Co-operation and Development. (2025, October 30). Fibre and 5G drive OECD digital transformation as broadband markets mature. OECD.
- Paramount Skydance Corporation. (2025, August 7). Skydance Media and Paramount Global complete merger, creating next generation media company. Paramount Skydance Corporation.
- Sony Group Corporation. (2025, May 14). Corporate Strategy Presentation 2025. Sony Group Corporation.
- Statistics Bureau of Japan. (2025, September). Statistical Handbook of Japan 2025. Ministry of Internal Affairs and Communications.
- Statistisches Bundesamt. (2026, March 2). 59 % der Bevölkerung zwischen 16 und 74 Jahren in Deutschland nutzen aktiv soziale Medien. Destatis.
- The Walt Disney Company. (2025, May 13). New Direct-to-Consumer Offering to be Singularly Branded ESPN. The Walt Disney Company.
- The Walt Disney Company. (2025, November 13). The Walt Disney Company reports fourth quarter and full year earnings for fiscal 2025. The Walt Disney Company.
This Report Addresses
- The report provides strategic intelligence on Digital Media across Content Type and Platform choices that shape audience access and monetization decisions.
- Segment analysis covers Video and Smartphone as the supplied 2026 share positions used across the market structure and forecast framework.
- Regional outlook evaluates China and Japan alongside Germany and also compares the United States with the United Kingdom across the country growth framework.
- Competitive analysis profiles Amazon and Netflix alongside Apple and The Walt Disney Company, followed by Sony Group Corporation and Paramount Skydance Corporation alongside Fox Corporation.
- Content Type assessment covers Video and Audio alongside Text or Images whereas Interactive Media Content and other formats complete the connected media view.
- Platform assessment covers Smartphone and Television alongside Computer, Tablets and other access points used for personal or enterprise media consumption.
- Application assessment covers Marketing & Advertising and Training & E-Learning alongside Social Media, Streaming and other digital media use cases.
What does the Digital Media Market cover?
Video, Audio, Text and Images delivered through connected services for content access and revenue generation.
The Digital Media Market covers electronically distributed content and platform services used to deliver Video and Audio alongside Text or Images across connected environments. Interactive Media Content is included where user participation forms part of the media experience or a paid or advertising-funded delivery model.
The market differs from telecommunications access because commercial value comes from content delivery and audience monetization instead of network connectivity alone. Physical media manufacturing and standalone telecom services remain outside the boundary unless they form part of a digital content package sold to end users.
What is included in the scope?
Digital media content and monetization systems used across connected consumer and enterprise media environments.
The scope covers Video, Audio and Text alongside Images and Interactive Media Content across Smartphone and Television delivery environments. Computer and Tablets usage is included where content consumption or business media workflows create measurable platform revenue. Marketing & Advertising and Streaming applications are covered alongside Training & E-Learning and Social Media use cases. Adjacent analysis of streaming media services helps frame platform economics without replacing the broader market boundary. Audio monetization is informed by cloud music streaming while advertising workflows are linked to programmatic display advertising where automated media buying affects campaign delivery.
What is excluded from the scope?
Telecommunications access services and physical media manufacturing are outside the scope.
The scope excludes broadband connectivity sold only as network access and physical media production that does not include a digital content service. Standalone hardware sales are excluded unless device revenue is inseparable from the measured media service or advertising delivery relationship. General software services also remain outside the boundary unless content distribution or media monetization forms the purchased function.
How was the analysis built?
120+ sources, 45+ company portfolios, 25+ countries, 20+ interviews.
- Primary Research: Primary research includes interviews with streaming operators and publisher revenue teams alongside media agencies or enterprise learning managers. Discussions also cover content licensing leads and advertising technology specialists who evaluate audience reach and commercial rollout.
- Desk Research: Desk research reviews official connectivity statistics and national media-use evidence alongside company product pages or investor releases. Portfolio mapping covers streaming services and advertising systems and regulatory material informs safety or access requirements affecting service design.
- Market-Sizing and Forecasting: Market sizing uses connected audience growth and platform revenue alongside content mix or advertising revenue per audience. Forecasting also considers the share of users taking paid plans and the availability of content rights. Country models reflect connection quality and household media behavior across the five national outlooks included in the article.
- Data Validation and Update Cycle: Forecasts are validated through provider checks and expert interviews that test assumptions on audience shifts or advertiser spending. Company portfolio mapping and country evidence are reviewed together and update cycles track platform launches or business-model changes.
Segmentation
What is the report’s scope and coverage?
| Attribute | Details |
|---|---|
| Quantitative Units | USD Billion in 2026 to USD Billion by 2036 |
| Market Definition | Electronically distributed content and platform services used to deliver media across connected environments while generating revenue through audience access and monetization |
| Content Type | Video; Audio; Text; Images; Interactive Media Content; Other Formats |
| Platform | Smartphone; Television; Computer; Tablets; Other Access Points |
| Application | Marketing & Advertising; Training & E-Learning; Social Media; Streaming; Other Applications |
| Industry Vertical | Entertainment; Retail & E-commerce; Healthcare; Government; BFSI; Telecom |
| Business Model | Advertising-supported; Subscription; Transactional; Freemium |
| Regions Covered | North America; Europe; Asia Pacific; Central and South America; Middle East and Africa |
| Countries Covered | China; Japan; Germany; United States; United Kingdom |
| Key Companies Profiled | Amazon.com Inc.; Netflix Inc.; Apple Inc.; The Walt Disney Company; Sony Group Corporation; Paramount Skydance Corporation; Fox Corporation |
| Forecast Period | 2026 to 2036 |
| Approach | Hybrid top-down and bottom-up approach using connected audience growth; platform revenue; content mix; advertising revenue per audience; paid-plan conversion; content rights availability and provider validation |
Source: Fact.MR analysis. Updated Jul 7, 2026
How is the market segmented?
-
By Content Type
- Video
- Audio
- Text
- Images
- Interactive Media Content
- Other Content Formats
-
By Platform
- Smartphone
- Television
- Computer
- Tablets
- Other Access Points
-
By Application
- Marketing & Advertising
- Training & E-Learning
- Social Media
- Streaming
- Other Applications
-
By Industry Vertical
- Entertainment
- Retail & E-commerce
- Healthcare
- Government
- BFSI
- Telecom
-
By Business Model
- Advertising-supported
- Subscription
- Transactional
- Freemium
-
Region
- North America
- United States
- Canada
- Europe
- Germany
- United Kingdom
- France
- Netherlands
- Spain
- Asia Pacific
- China
- Japan
- South Korea
- India
- Australia
- Singapore
- Central & South America
- Brazil
- Mexico
- Argentina
- Chile
- Middle East & Africa
- UAE
- Saudi Arabia
- South Africa
- North America
Frequently Asked Questions
Which Content Type leads the Digital Media Market?
Which Platform leads the Digital Media Market?
Which Application leads the Digital Media Market?
Which Industry Vertical leads the Digital Media Market?
Which Business Model leads the Digital Media Market?
Which country records the highest CAGR in the Digital Media Market?
How does Japan perform in the Digital Media Market?
How does Germany perform in the Digital Media Market?
How does the United States perform in the Digital Media Market?
How does the United Kingdom perform in the Digital Media Market?
What is the primary driver in the Digital Media Market?
What is the main restraint in the Digital Media Market?
Why is Video important?
Why do advertisers dominate demand?
Who worked on this report


Preview the report firsthand - request a free sample
Free SampleGet the brochure for pricing and purchase details
Download PDF