Enzyme-Enhanced Ingredients Market
Enzyme-Enhanced Ingredients Market Analysis, By Enzyme Type, By Source, By Functionality, By Application, By End Use industry, and Region - Market Insights 2025 to 2035
The Protease segment is projected to grow at a CAGR of 5.3%, whereas another segment Amylase is likely to grow at 7.3%. In terms of countries Germany is projected to grow at 7.4%, followed by India at 9.4% and U.S. to grow at 6.3%.
Enzyme-Enhanced Ingredients Market Outlook (2025 to 2035)
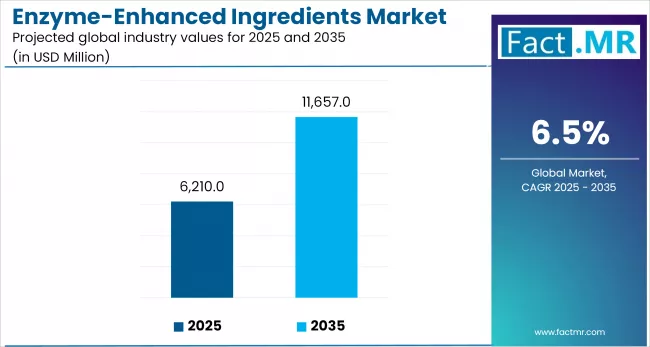
The global enzyme-enhanced ingredients market is expected to reach USD 11,657 million by 2035, up from USD 5,955 million in 2024. During the forecast period (2025–2035), the industry is projected to register a CAGR of 6.5%.
Enzymes are transforming next-gen food development by enhancing texture, nutrition, and sustainability in clean-label, functional foods. Their expanding role spans plant-based, free-from, and digestive health segments, driven by innovation and processing efficiency.
Quick Stats for Enzyme-Enhanced Ingredients Market
- Industry Value (2025): USD 6,210 Million
- Projected Value (2035): USD 11,657 Million
- Forecast CAGR (2025 to 2035): 6.5%
- Leading Segment (2025): Microbial-based (45% Market Share)
- Country Growth Rate (2025 to 2035): India (9.4% CAGR)
- Top Key Players: Novozymes, DuPont Nutrition & Biosciences (IFF), DSM-Firmenich, AB Enzymes, Chr. Hansen, and Kerry Group
What are the drivers of enzyme-enhanced ingredients market?
Ingredients enhanced by enzymes present an opportunity supported by the growing popularity of clean-label, functional foods. Enzymes are used to replace artificial additives, improving texture, flavor, shelf life, and nutrition without compromising transparency.
The benefit of enzyme use for food processors is that they enhance the level of efficiency in the production of fermented foods, dough, and milk processing, which reduces the volume of resources utilized and aligns with the goal of sustainability. The growth of vegetable and free-form product segments also increases the use of enzymes, supporting texture and taste enhancements in meat and milk substitutes.
Enzymes play a crucial role in food supplements and nutritional medicine by enhancing the digestibility of food and increasing the rate at which nutrients are absorbed. With the increasing demand from consumers for next-generation food that is gut-friendly and minimally processed, there is an emergence of enzyme-enhanced ingredients as foundational components in next-generation food concepts.
What are the regional trends of enzyme-enhanced ingredients market?
Enzyme-enhanced ingredient adoption is led by North America, which has an established processed food industry and is also interested in label-friendly, functional ingredients. The transparency in regulations also promotes enzyme innovation across various sectors, including dairy, bakery, and beverages.
Europe follows closely, with sustainability initiatives and clean label requirements in the European Union urging manufacturers to shift from artificial additives towards enzyme solutions. In Northern Europe specifically, investment in food-tech hubs is increasing as interest grows in scaling enzyme-based technologies.
The Asia Pacific is experiencing rapid growth, led by China and India. The increase in health awareness, busy lifestyles, and the upsurge of packaged food industries are driving the demand for enzyme-enriched products. Governments are encouraging the use of enzymes to reduce food waste and enhance nutritional value.
Emerging markets, such as Latin America and the Middle East, are witnessing growth driven by urbanization and changing dietary patterns, which are instigating the integration of enzymes. MNCs are also localizing their production to meet local preferences and the regulations governing these regions.
What are the challenges and restraining factors of enzyme-enhanced ingredients market?
The costs of production are also high, presenting another key obstacle in the market of enzyme-enhanced ingredients. Advanced fermentation, purification and stabilization procedures are needed to develop stable, food-grade enzyme, usually restricting entry into smaller firms.
Growth is further propelled by differences in regulations across regions. Although the guidelines are relatively established in North America and Europe, there might be uncertainties in the emerging markets, relating to the classification and labeling of enzymes, which can delay the success of new ventures for several years.
Consumer skepticism also persists. Although enzymes are natural catalysts, perceptions surrounding bio-engineered ingredients may limit acceptance, particularly within clean-label categories. This hurdle can be addressed through clear communication.
In addition, the enzymes are heat-sensitive, pH-sensitive and processing conditions. Technical skills are also necessary in the formulation to ensure consistency of performance. The smaller manufacturers may struggle without sufficient R&D capabilities.
Country-Wise Outlook
Precision Nutrition and Biotech Synergy Drive U.S. Leadership
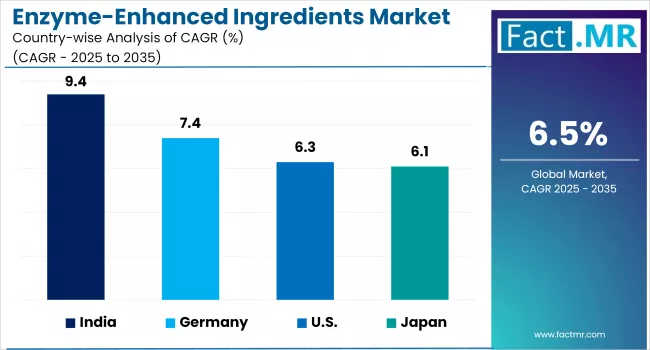
The enzyme-enhanced ingredients market is led by the United States, driven by advanced biotechnology scientific studies, a vibrant functional foods industry, and the growing popularity of clean-label and digestion-focused products. Due to the increased prevalence of obesity and gut health issues, there is a growing demand for plant-based nutraceuticals, dairy alternatives, and protein-rich snacks that use enzymes.
Enzyme blends have become commonly used in bakery, beverages and sports nutrition as a result of the FDA GRAS status, which established accepted safety, and the use of innovation, friendly policies. Pairing enzymes with phytonutrients is gaining momentum due to the increasing use of AI-powered formulation engines.
Tailored Health and EU Regulations Boost German Enzyme Ingredient Uptake
Germany leads in enzyme-driven food innovation due to stringent EU food health claims laws and an adult consumer base focused on probiotics, lactose and gluten intolerance, and plant-based diets. Recent demand in bakery, baby food and medical nutrition product shapes the market.
Use of microbial enzymes and transglutaminase as a targeted technology in food tech BfR (Federal Institute for Risk Assessment) guidelines promote improvements in incorporating microbial enzymes including those derived by microbial fermentation of Aspergillus niger and Trichoderma reesei into cleaner formulations. BASF and DSM increase production of enzyme isolates that are precision fermented and specific to vegan foods.
India’s Traditional Fermentation and Dairy Sector Fuel Innovation
The Indian enzyme-improved ingredients market is growing rapidly, driven by the large dairy industry, traditional use of fermentation (idli, dosa, curd), and developing awareness of lactose intolerance. Multinational and local companies are enhancing shelf lives, protein yield, and digestibility in dairy, pulses, and meat by deploying enzymes.
The Food Safety and Standards Authority of India (FSSAI) has simplified the process of enzyme approvals and also expedited market access. New enzymes, such as phytases and proteases, are being incorporated into plant-based formulations to minimize anti-nutrients.
Category-Wise Analysis
Protease Enzymes Boost Texture, Nutrient Release, and Process Efficiency
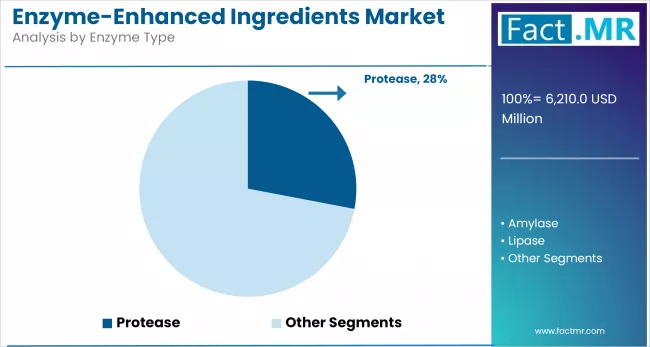
Proteases are essential in the processing of food by hydrolyzing proteins that enhance digestion and development of flavor as well as handling of the dough. In bakery and proteins rich food industries, proteases are used to alter gluten networks in improving softness and prolong shelf-life. This ongoing advancement of protease specificity and stability in different pH and temperatures is creating novel applications to both commodity and specialty foods.
Microbial-Based Sources Power Scalable and Sustainable Enzyme Production
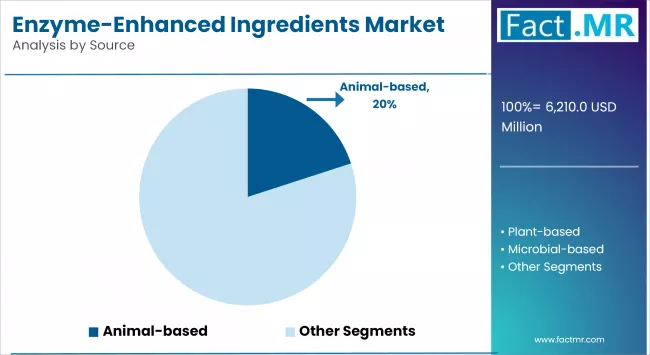
Enzymes produced by microbes are gaining prominence due to their simplicity in their production, high-yield, and flexibility in mass production. These are usually bacteria or fungi, which allow uniform enzyme performance and quality in food applications.
They have a high growth cycle and can be engineered to produce a specific enzyme at high rates, thus are highly desirable in controlled food products. Besides, they respond to the increased consumer desire to consume clean-label and non-animal ingredients, especially in the formulation of vegan and kosher products.
Bakery Applications Embrace Enzymes to Replace Additives and Elevate Quality
Enzyme-based solutions to improve machinability, volume, and the crumb structure of a dough are gaining popularity within the bakery industry where no chemicals are introduced into foods. With the increasing influence of clean-label trends, which are prompting bakers to take emulsifiers and conditioners out of their products, enzymes can be used as natural commercial aid.
Enzymes help bakers meet production efficiency targets while also addressing consumer expectations, whether for industrial bread-making or artisanal products.
Competitive Analysis
Enzyme-fortified ingredients market is characterized by active innovation where firms focus on developing formulations that enhance digestibility, flavor enhancement, and nutrient bio-availability. The focus of market players is on new enzyme synergies, which allow customizing the ingredients with modern tendencies towards clean labels and functional foods.
One of the competitive factor is the ability to scale and cost-efficiency during production. Companies that possess most developed fermentation process and enzyme stabilization competence achieve significant advantage. Collaborative regional production and enzyme transportation technology such as encapsulation, further differentiate firms seeking larger market shares across developed and emerging markets.
Competing brands are also focusing on certain segments in the diet, including gluten-free, vegetarian, and keto diets. This ability to diversify in a more strategic manner, stands as an indication of the industry shifting away toward precision rather than generic application of services toward niche consumer needs.
Key players in the market are Novozymes, DuPont Nutrition & Biosciences (IFF), DSM-Firmenich, AB Enzymes, Chr. Hansen, Kerry Group, BASF, Advanced Enzyme Technologies, Amano Enzyme, Biocatalysts, Corbion, Cargill, Archer Daniels Midland Company (ADM), and other players.
Recent Development
- In April 2025, Amano Enzyme unveiled Veramax™ G3, an enzyme that enables oat-based beverages to qualify as "no sugar" (≤ 0.5 g/100 mL) by precisely converting starch into maltotriose enhancing sweetness and preserving mouthfeel without added sugar.
- In March 2025, DSM‑Firmenich’s Maxiren®EVO is a next‑generation fermentation‑produced coagulant enzyme. It targets αs1-casein to deliver improved cheese texture, stretch, flavor, and yield specifically enhancing sliceability and mozzarella performance.
Methodology and Industry Tracking Approach
The research by Fact.MR on the enzyme-enhanced ingredients market was based on feedbacks of more than 2,000 players in 14 nations. According to a high-impact survey of 60 stakeholders of functional food formulators, dietary supplement brands, and bio-fermentation researchers during October 2025, high-efficiency enzymes, precision blends, and scalable fermentation solutions designed in terms of clean-label formulations have been found to rise in demand.
The speedier uptake was characterized between July 2024 and June 2025 because of the advent of the shelf-stable enzyme aggregate, non-GMO enzyme fermentation starters, and acid-resisting enzymatic carrier.
Manufacturers began to implement sustainable methods of enzyme production since 2018, when traceability and environmental impact became the prominent subject of discussion.
Fact.MR has provided detailed information about the price points of key manufacturers of the Enzyme-Enhanced Ingredients Market positioned across regions, sales growth, production capacity, and speculative technological expansion, in the recently published report.
Segmentation of Enzyme-enhanced ingredients market
-
By Enzyme Type :
- Protease
- Amylase
- Lipase
- Cellulase
- Lactase
- Others (e.g., Phytase)
-
By Source :
- Animal-based
- Plant-based
- Microbial-based
- Synthetic
-
By Functionality :
- Digestibility Enhancement
- Flavor & Texture Improvement
- Bioavailability Boost
- Shelf-life Extension
- Nutrient Retention
- Fat & Sugar Replacement
- Allergen Reduction
- Clean Label Formulation
-
By Application :
- Bakery
- Dairy
- Meat & Poultry
- Infant Nutrition
- Functional Beverages
- Confectionery
- Plant-based Meat Alternatives
- Dietary Supplements
-
By End Use Industry :
- Food & Beverage
- Nutraceuticals
- Sports Nutrition
- Pharmaceuticals
- Personal Care & Cosmetics
- Animal Feed
- Biotechnology
-
By Region :
- North America
- Latin America
- Western Europe
- Eastern Europe
- East Asia
- South Asia & Pacific
- Middle East & Africa
Table of Content
- Executive Summary
- Global Market Outlook
- Demand-side Trends
- Supply-side Trends
- Technology Roadmap Analysis
- Analysis and Recommendations
- Market Overview
- Market Coverage / Taxonomy
- Market Definition / Scope / Limitations
- Market Background
- Market Dynamics
- Drivers
- Restraints
- Opportunity
- Trends
- Scenario Forecast
- Demand in Optimistic Scenario
- Demand in Likely Scenario
- Demand in Conservative Scenario
- Opportunity Map Analysis
- Product Life Cycle Analysis
- Supply Chain Analysis
- Supply Side Participants and their Roles
- Producers
- Mid-Level Participants (Traders/ Agents/ Brokers)
- Wholesalers and Distributors
- Value Added and Value Created at Node in the Supply Chain
- List of Component Suppliers
- List of Existing and Potential Buyers
- Supply Side Participants and their Roles
- Investment Feasibility Matrix
- Value Chain Analysis
- Profit Margin Analysis
- Wholesalers and Distributors
- Retailers
- PESTLE and Porter’s Analysis
- Regulatory Landscape
- By Key Regions
- By Key Countries
- Production and Consumption Statistics
- Import and Export Statistics
- Market Dynamics
- Global Market Analysis 2020-2024 and Forecast, 2025-2035
- Historical Market Size Value (USD Mn) & Volume (Tons) Analysis, 2020-2024
- Current and Future Market Size Value (USD Mn) & Volume (Tons) Projections, 2025-2035
- Y-o-Y Growth Trend Analysis
- Absolute $ Opportunity Analysis
- Global Market Pricing Analysis 2020-2024 and Forecast 2025-2035
- Global Market Analysis 2020-2024 and Forecast 2025-2035, By Enzyme Type
- Introduction / Key Findings
- Historical Market Size Value (USD Mn) & Volume (Tons) Analysis By Enzyme Type, 2020-2024
- Current and Future Market Size Value (USD Mn) & Volume (Tons) Analysis and Forecast By Enzyme Type, 2025-2035
- Protease
- Amylase
- Lipase
- Cellulase
- Lactase
- Others (e.g., Phytase)
- Y-o-Y Growth Trend Analysis By Enzyme Type, 2020-2024
- Absolute $ Opportunity Analysis By Enzyme Type, 2025-2035
- Global Market Analysis 2020-2024 and Forecast 2025-2035, By Source
- Introduction / Key Findings
- Historical Market Size Value (USD Mn) & Volume (Tons) Analysis By Source, 2020-2024
- Current and Future Market Size Value (USD Mn) & Volume (Tons) Analysis and Forecast By Source, 2025-2035
- Animal-based
- Plant-based
- Microbial-based
- Synthetic
- Y-o-Y Growth Trend Analysis By Source, 2020-2024
- Absolute $ Opportunity Analysis By Source, 2025-2035
- Global Market Analysis 2020-2024 and Forecast 2025-2035, By Functionality
- Introduction / Key Findings
- Historical Market Size Value (USD Mn) & Volume (Tons) Analysis By Functionality, 2020-2024
- Current and Future Market Size Value (USD Mn) & Volume (Tons) Analysis and Forecast By Functionality, 2025-2035
- Digestibility Enhancement
- Flavor & Texture Improvement
- Bioavailability Boost
- Shelf-life Extension
- Nutrient Retention
- Fat & Sugar Replacement
- Allergen Reduction
- Clean Label Formulation
- Y-o-Y Growth Trend Analysis By Functionality, 2020-2024
- Absolute $ Opportunity Analysis By Functionality, 2025-2035
- Global Market Analysis 2020-2024 and Forecast 2025-2035, By Application
- Introduction / Key Findings
- Historical Market Size Value (USD Mn) & Volume (Tons) Analysis By Application, 2020-2024
- Current and Future Market Size Value (USD Mn) & Volume (Tons) Analysis and Forecast By Application, 2025-2035
- Bakery
- Dairy
- Meat & Poultry
- Infant Nutrition
- Functional Beverages
- Confectionery
- Plant-based Meat Alternatives
- Dietary Supplements
- Y-o-Y Growth Trend Analysis By Application, 2020-2024
- Absolute $ Opportunity Analysis By Application, 2025-2035
- Global Market Analysis 2020-2024 and Forecast 2025-2035, By End Use Industry
- Introduction / Key Findings
- Historical Market Size Value (USD Mn) & Volume (Tons) Analysis By End Use Industry, 2020-2024
- Current and Future Market Size Value (USD Mn) & Volume (Tons) Analysis and Forecast By End Use Industry, 2025-2035
- Food & Beverage
- Nutraceuticals
- Sports Nutrition
- Pharmaceuticals
- Personal Care & Cosmetics
- Animal Feed
- Biotechnology
- Y-o-Y Growth Trend Analysis By End Use Industry, 2020-2024
- Absolute $ Opportunity Analysis By End Use Industry, 2025-2035
- Global Market Analysis 2020-2024 and Forecast 2025-2035, By Region
- Introduction
- Historical Market Size Value (USD Mn) & Volume (Tons) Analysis By Region, 2020-2024
- Current Market Size Value (USD Mn) & Volume (Tons) Analysis and Forecast By Region, 2025-2035
- North America
- Latin America
- Western Europe
- East Asia
- South Asia Pacific
- Eastern Europe
- Middle East & Africa
- Market Attractiveness Analysis By Region
- North America Market Analysis 2020-2024 and Forecast 2025-2035, By Country
- Historical Market Size Value (USD Mn) & Volume (Tons) Trend Analysis By Market Taxonomy, 2020-2024
- Market Size Value (USD Mn) & Volume (Tons) Forecast By Market Taxonomy, 2025-2035
- By Country
- U.S.
- Canada
- Mexico
- By Enzyme Type
- By Source
- By Functionality
- By Application
- By End Use Industry
- By Country
- Market Attractiveness Analysis
- By Country
- By Enzyme Type
- By Source
- By Functionality
- By Application
- By End Use Industry
- Key Takeaways
- Latin America Market Analysis 2020-2024 and Forecast 2025-2035, By Country
- Historical Market Size Value (USD Mn) & Volume (Tons) Trend Analysis By Market Taxonomy, 2020-2024
- Market Size Value (USD Mn) & Volume (Tons) Forecast By Market Taxonomy, 2025-2035
- By Country
- Brazil
- Chile
- Rest of Latin America
- By Enzyme Type
- By Source
- By Functionality
- By Application
- By End Use Industry
- By Country
- Market Attractiveness Analysis
- By Country
- By Enzyme Type
- By Source
- By Functionality
- By Application
- By End Use Industry
- Key Takeaways
- Western Europe Market Analysis 2020-2024 and Forecast 2025-2035, By Country
- Historical Market Size Value (USD Mn) & Volume (Tons) Trend Analysis By Market Taxonomy, 2020-2024
- Market Size Value (USD Mn) & Volume (Tons) Forecast By Market Taxonomy, 2025-2035
- By Country
- Germany
- Italy
- France
- U.K.
- Spain
- Russia
- BENELUX
- Rest of Europe
- By Enzyme Type
- By Source
- By Functionality
- By Application
- By End Use Industry
- By Country
- Market Attractiveness Analysis
- By Country
- By Enzyme Type
- By Source
- By Functionality
- By Application
- By End Use Industry
- Key Takeaways
- East Asia Market Analysis 2020-2024 and Forecast 2025-2035, By Country
- Historical Market Size Value (USD Mn) & Volume (Tons) Trend Analysis By Market Taxonomy, 2020-2024
- Market Size Value (USD Mn) & Volume (Tons) Forecast By Market Taxonomy, 2025-2035
- By Country
- China
- Japan
- South Korea
- By Enzyme Type
- By Source
- By Functionality
- By Application
- By End Use Industry
- By Country
- Market Attractiveness Analysis
- By Country
- By Enzyme Type
- By Source
- By Functionality
- By Application
- By End Use Industry
- Key Takeaways
- South Asia Pacific Market Analysis 2020-2024 and Forecast 2025-2035, By Country
- Historical Market Size Value (USD Mn) & Volume (Tons) Trend Analysis By Market Taxonomy, 2020-2024
- Market Size Value (USD Mn) & Volume (Tons) Forecast By Market Taxonomy, 2025-2035
- By Country
- India
- ASEAN Countries
- Australia & New Zealand
- Rest of South Asia Pacific
- By Enzyme Type
- By Source
- By Functionality
- By Application
- By End Use Industry
- By Country
- Market Attractiveness Analysis
- By Country
- By Enzyme Type
- By Source
- By Functionality
- By Application
- By End Use Industry
- Key Takeaways
- Eastern Europe Market Analysis 2020-2024 and Forecast 2025-2035, By Country
- Historical Market Size Value (USD Mn) & Volume (Tons) Trend Analysis By Market Taxonomy, 2020-2024
- Market Size Value (USD Mn) & Volume (Tons) Forecast By Market Taxonomy, 2025-2035
- By Country
- Russia
- Poland
- Hungary
- Balkan & Baltics
- Rest of Eastern Europe
- By Enzyme Type
- By Source
- By Functionality
- By Application
- By End Use Industry
- By Country
- Market Attractiveness Analysis
- By Country
- By Enzyme Type
- By Source
- By Functionality
- By Application
- By End Use Industry
- Key Takeaways
- Middle East & Africa Market Analysis 2020-2024 and Forecast 2025-2035, By Country
- Historical Market Size Value (USD Mn) & Volume (Tons) Trend Analysis By Market Taxonomy, 2020-2024
- Market Size Value (USD Mn) & Volume (Tons) Forecast By Market Taxonomy, 2025-2035
- By Country
- KSA
- Other GCC Countries
- Turkiye
- South Africa
- Rest of MEA
- By Enzyme Type
- By Source
- By Functionality
- By Application
- By End Use Industry
- By Country
- Market Attractiveness Analysis
- By Country
- By Enzyme Type
- By Source
- By Functionality
- By Application
- By End Use Industry
- Key Takeaways
- Key Countries Market Analysis
- U.S.
- Pricing Analysis
- Market Share Analysis, 2024
- By Enzyme Type
- By Source
- By Functionality
- By Application
- By End Use Industry
- Germany
- Pricing Analysis
- Market Share Analysis, 2024
- By Enzyme Type
- By Source
- By Functionality
- By Application
- By End Use Industry
- India
- Pricing Analysis
- Market Share Analysis, 2024
- By Enzyme Type
- By Source
- By Functionality
- By Application
- By End Use Industry
- China
- Pricing Analysis
- Market Share Analysis, 2024
- By Enzyme Type
- By Source
- By Functionality
- By Application
- By End Use Industry
- Japan
- Pricing Analysis
- Market Share Analysis, 2024
- By Enzyme Type
- By Source
- By Functionality
- By Application
- By End Use Industry
- U.S.
- Market Structure Analysis
- Competition Dashboard
- Competition Benchmarking
- Market Share Analysis of Top Players
- By Regional
- By Enzyme Type
- By Source
- By Functionality
- By Application
- By End Use Industry
- Competition Analysis
- Competition Deep Dive
- Novozymes
- Overview
- Product Portfolio
- Profitability by Market Segments (Product/Age /Sales Channel/Region)
- Sales Footprint
- Strategy Overview
- Marketing Strategy
- Product Strategy
- Channel Strategy
- DuPont Nutrition & Biosciences (IFF)
- Overview
- Product Portfolio
- Profitability by Market Segments (Product/Age /Sales Channel/Region)
- Sales Footprint
- Strategy Overview
- Marketing Strategy
- Product Strategy
- Channel Strategy
- DSM-Firmenich
- Overview
- Product Portfolio
- Profitability by Market Segments (Product/Age /Sales Channel/Region)
- Sales Footprint
- Strategy Overview
- Marketing Strategy
- Product Strategy
- Channel Strategy
- AB Enzymes
- Overview
- Product Portfolio
- Profitability by Market Segments (Product/Age /Sales Channel/Region)
- Sales Footprint
- Strategy Overview
- Marketing Strategy
- Product Strategy
- Channel Strategy
- Chr. Hansen
- Overview
- Product Portfolio
- Profitability by Market Segments (Product/Age /Sales Channel/Region)
- Sales Footprint
- Strategy Overview
- Marketing Strategy
- Product Strategy
- Channel Strategy
- Kerry Group
- Overview
- Product Portfolio
- Profitability by Market Segments (Product/Age /Sales Channel/Region)
- Sales Footprint
- Strategy Overview
- Marketing Strategy
- Product Strategy
- Channel Strategy
- BASF
- Overview
- Product Portfolio
- Profitability by Market Segments (Product/Age /Sales Channel/Region)
- Sales Footprint
- Strategy Overview
- Marketing Strategy
- Product Strategy
- Channel Strategy
- Advanced Enzyme Technologies
- Overview
- Product Portfolio
- Profitability by Market Segments (Product/Age /Sales Channel/Region)
- Sales Footprint
- Strategy Overview
- Marketing Strategy
- Product Strategy
- Channel Strategy
- Amano Enzyme
- Overview
- Product Portfolio
- Profitability by Market Segments (Product/Age /Sales Channel/Region)
- Sales Footprint
- Strategy Overview
- Marketing Strategy
- Product Strategy
- Channel Strategy
- Biocatalysts
- Overview
- Product Portfolio
- Profitability by Market Segments (Product/Age /Sales Channel/Region)
- Sales Footprint
- Strategy Overview
- Marketing Strategy
- Product Strategy
- Channel Strategy
- Corbion
- Overview
- Product Portfolio
- Profitability by Market Segments (Product/Age /Sales Channel/Region)
- Sales Footprint
- Strategy Overview
- Marketing Strategy
- Product Strategy
- Channel Strategy
- Cargill
- Overview
- Product Portfolio
- Profitability by Market Segments (Product/Age /Sales Channel/Region)
- Sales Footprint
- Strategy Overview
- Marketing Strategy
- Product Strategy
- Channel Strategy
- Archer Daniels Midland Company (ADM)
- Overview
- Product Portfolio
- Profitability by Market Segments (Product/Age /Sales Channel/Region)
- Sales Footprint
- Strategy Overview
- Marketing Strategy
- Product Strategy
- Channel Strategy
- Novozymes
- Competition Deep Dive
- Assumptions & Acronyms Used
- Research Methodology
List Of Table
- Table 1: Global Market Value (USD Mn) Forecast by Region, 2020 to 2035
- Table 2: Global Market Volume (Tons) Forecast by Region, 2020 to 2035
- Table 3: Global Market Value (USD Mn) Forecast by Enzyme Type, 2020 to 2035
- Table 4: Global Market Volume (Tons) Forecast by Enzyme Type, 2020 to 2035
- Table 5: Global Market Value (USD Mn) Forecast by Source, 2020 to 2035
- Table 6: Global Market Volume (Tons) Forecast by Source, 2020 to 2035
- Table 7: Global Market Value (USD Mn) Forecast by Functionality, 2020 to 2035
- Table 8: Global Market Volume (Tons) Forecast by Functionality, 2020 to 2035
- Table 9: Global Market Value (USD Mn) Forecast by Application, 2020 to 2035
- Table 10: Global Market Volume (Tons) Forecast by Application, 2020 to 2035
- Table 11: Global Market Value (USD Mn) Forecast by End Use Industry, 2020 to 2035
- Table 12: Global Market Volume (Tons) Forecast by End Use Industry, 2020 to 2035
- Table 13: North America Market Value (USD Mn) Forecast by Country, 2020 to 2035
- Table 14: North America Market Volume (Tons) Forecast by Country, 2020 to 2035
- Table 15: North America Market Value (USD Mn) Forecast by Enzyme Type, 2020 to 2035
- Table 16: North America Market Volume (Tons) Forecast by Enzyme Type, 2020 to 2035
- Table 17: North America Market Value (USD Mn) Forecast by Source, 2020 to 2035
- Table 18: North America Market Volume (Tons) Forecast by Source, 2020 to 2035
- Table 19: North America Market Value (USD Mn) Forecast by Functionality, 2020 to 2035
- Table 20: North America Market Volume (Tons) Forecast by Functionality, 2020 to 2035
- Table 21: North America Market Value (USD Mn) Forecast by Application, 2020 to 2035
- Table 22: North America Market Volume (Tons) Forecast by Application, 2020 to 2035
- Table 23: North America Market Value (USD Mn) Forecast by End Use Industry, 2020 to 2035
- Table 24: North America Market Volume (Tons) Forecast by End Use Industry, 2020 to 2035
- Table 25: Latin America Market Value (USD Mn) Forecast by Country, 2020 to 2035
- Table 26: Latin America Market Volume (Tons) Forecast by Country, 2020 to 2035
- Table 27: Latin America Market Value (USD Mn) Forecast by Enzyme Type, 2020 to 2035
- Table 28: Latin America Market Volume (Tons) Forecast by Enzyme Type, 2020 to 2035
- Table 29: Latin America Market Value (USD Mn) Forecast by Source, 2020 to 2035
- Table 30: Latin America Market Volume (Tons) Forecast by Source, 2020 to 2035
- Table 31: Latin America Market Value (USD Mn) Forecast by Functionality, 2020 to 2035
- Table 32: Latin America Market Volume (Tons) Forecast by Functionality, 2020 to 2035
- Table 33: Latin America Market Value (USD Mn) Forecast by Application, 2020 to 2035
- Table 34: Latin America Market Volume (Tons) Forecast by Application, 2020 to 2035
- Table 35: Latin America Market Value (USD Mn) Forecast by End Use Industry, 2020 to 2035
- Table 36: Latin America Market Volume (Tons) Forecast by End Use Industry, 2020 to 2035
- Table 37: Western Europe Market Value (USD Mn) Forecast by Country, 2020 to 2035
- Table 38: Western Europe Market Volume (Tons) Forecast by Country, 2020 to 2035
- Table 39: Western Europe Market Value (USD Mn) Forecast by Enzyme Type, 2020 to 2035
- Table 40: Western Europe Market Volume (Tons) Forecast by Enzyme Type, 2020 to 2035
- Table 41: Western Europe Market Value (USD Mn) Forecast by Source, 2020 to 2035
- Table 42: Western Europe Market Volume (Tons) Forecast by Source, 2020 to 2035
- Table 43: Western Europe Market Value (USD Mn) Forecast by Functionality, 2020 to 2035
- Table 44: Western Europe Market Volume (Tons) Forecast by Functionality, 2020 to 2035
- Table 45: Western Europe Market Value (USD Mn) Forecast by Application, 2020 to 2035
- Table 46: Western Europe Market Volume (Tons) Forecast by Application, 2020 to 2035
- Table 47: Western Europe Market Value (USD Mn) Forecast by End Use Industry, 2020 to 2035
- Table 48: Western Europe Market Volume (Tons) Forecast by End Use Industry, 2020 to 2035
- Table 49: East Asia Market Value (USD Mn) Forecast by Country, 2020 to 2035
- Table 50: East Asia Market Volume (Tons) Forecast by Country, 2020 to 2035
- Table 51: East Asia Market Value (USD Mn) Forecast by Enzyme Type, 2020 to 2035
- Table 52: East Asia Market Volume (Tons) Forecast by Enzyme Type, 2020 to 2035
- Table 53: East Asia Market Value (USD Mn) Forecast by Source, 2020 to 2035
- Table 54: East Asia Market Volume (Tons) Forecast by Source, 2020 to 2035
- Table 55: East Asia Market Value (USD Mn) Forecast by Functionality, 2020 to 2035
- Table 56: East Asia Market Volume (Tons) Forecast by Functionality, 2020 to 2035
- Table 57: East Asia Market Value (USD Mn) Forecast by Application, 2020 to 2035
- Table 58: East Asia Market Volume (Tons) Forecast by Application, 2020 to 2035
- Table 59: East Asia Market Value (USD Mn) Forecast by End Use Industry, 2020 to 2035
- Table 60: East Asia Market Volume (Tons) Forecast by End Use Industry, 2020 to 2035
- Table 61: South Asia Pacific Market Value (USD Mn) Forecast by Country, 2020 to 2035
- Table 62: South Asia Pacific Market Volume (Tons) Forecast by Country, 2020 to 2035
- Table 63: South Asia Pacific Market Value (USD Mn) Forecast by Enzyme Type, 2020 to 2035
- Table 64: South Asia Pacific Market Volume (Tons) Forecast by Enzyme Type, 2020 to 2035
- Table 65: South Asia Pacific Market Value (USD Mn) Forecast by Source, 2020 to 2035
- Table 66: South Asia Pacific Market Volume (Tons) Forecast by Source, 2020 to 2035
- Table 67: South Asia Pacific Market Value (USD Mn) Forecast by Functionality, 2020 to 2035
- Table 68: South Asia Pacific Market Volume (Tons) Forecast by Functionality, 2020 to 2035
- Table 69: South Asia Pacific Market Value (USD Mn) Forecast by Application, 2020 to 2035
- Table 70: South Asia Pacific Market Volume (Tons) Forecast by Application, 2020 to 2035
- Table 71: South Asia Pacific Market Value (USD Mn) Forecast by End Use Industry, 2020 to 2035
- Table 72: South Asia Pacific Market Volume (Tons) Forecast by End Use Industry, 2020 to 2035
- Table 73: Eastern Europe Market Value (USD Mn) Forecast by Country, 2020 to 2035
- Table 74: Eastern Europe Market Volume (Tons) Forecast by Country, 2020 to 2035
- Table 75: Eastern Europe Market Value (USD Mn) Forecast by Enzyme Type, 2020 to 2035
- Table 76: Eastern Europe Market Volume (Tons) Forecast by Enzyme Type, 2020 to 2035
- Table 77: Eastern Europe Market Value (USD Mn) Forecast by Source, 2020 to 2035
- Table 78: Eastern Europe Market Volume (Tons) Forecast by Source, 2020 to 2035
- Table 79: Eastern Europe Market Value (USD Mn) Forecast by Functionality, 2020 to 2035
- Table 80: Eastern Europe Market Volume (Tons) Forecast by Functionality, 2020 to 2035
- Table 81: Eastern Europe Market Value (USD Mn) Forecast by Application, 2020 to 2035
- Table 82: Eastern Europe Market Volume (Tons) Forecast by Application, 2020 to 2035
- Table 83: Eastern Europe Market Value (USD Mn) Forecast by End Use Industry, 2020 to 2035
- Table 84: Eastern Europe Market Volume (Tons) Forecast by End Use Industry, 2020 to 2035
- Table 85: Middle East & Africa Market Value (USD Mn) Forecast by Country, 2020 to 2035
- Table 86: Middle East & Africa Market Volume (Tons) Forecast by Country, 2020 to 2035
- Table 87: Middle East & Africa Market Value (USD Mn) Forecast by Enzyme Type, 2020 to 2035
- Table 88: Middle East & Africa Market Volume (Tons) Forecast by Enzyme Type, 2020 to 2035
- Table 89: Middle East & Africa Market Value (USD Mn) Forecast by Source, 2020 to 2035
- Table 90: Middle East & Africa Market Volume (Tons) Forecast by Source, 2020 to 2035
- Table 91: Middle East & Africa Market Value (USD Mn) Forecast by Functionality, 2020 to 2035
- Table 92: Middle East & Africa Market Volume (Tons) Forecast by Functionality, 2020 to 2035
- Table 93: Middle East & Africa Market Value (USD Mn) Forecast by Application, 2020 to 2035
- Table 94: Middle East & Africa Market Volume (Tons) Forecast by Application, 2020 to 2035
- Table 95: Middle East & Africa Market Value (USD Mn) Forecast by End Use Industry, 2020 to 2035
- Table 96: Middle East & Africa Market Volume (Tons) Forecast by End Use Industry, 2020 to 2035
List Of Figures
- Figure 1: Global Market Volume (Tons) Forecast 2020 to 2035
- Figure 2: Global Market Pricing Analysis
- Figure 3: Global Market Value (USD Mn) Forecast 2020 to 2035
- Figure 4: Global Market Value Share and BPS Analysis by Enzyme Type, 2025 and 2035
- Figure 5: Global Market Y-o-Y Growth Comparison by Enzyme Type, 2025 to 2035
- Figure 6: Global Market Attractiveness Analysis by Enzyme Type
- Figure 7: Global Market Value Share and BPS Analysis by Source, 2025 and 2035
- Figure 8: Global Market Y-o-Y Growth Comparison by Source, 2025 to 2035
- Figure 9: Global Market Attractiveness Analysis by Source
- Figure 10: Global Market Value Share and BPS Analysis by Functionality, 2025 and 2035
- Figure 11: Global Market Y-o-Y Growth Comparison by Functionality, 2025 to 2035
- Figure 12: Global Market Attractiveness Analysis by Functionality
- Figure 13: Global Market Value Share and BPS Analysis by Application, 2025 and 2035
- Figure 14: Global Market Y-o-Y Growth Comparison by Application, 2025 to 2035
- Figure 15: Global Market Attractiveness Analysis by Application
- Figure 16: Global Market Value Share and BPS Analysis by End Use Industry, 2025 and 2035
- Figure 17: Global Market Y-o-Y Growth Comparison by End Use Industry, 2025 to 2035
- Figure 18: Global Market Attractiveness Analysis by End Use Industry
- Figure 19: Global Market Value (USD Mn) Share and BPS Analysis by Region, 2025 and 2035
- Figure 20: Global Market Y-o-Y Growth Comparison by Region, 2025 to 2035
- Figure 21: Global Market Attractiveness Analysis by Region
- Figure 22: North America Market Incremental $ Opportunity, 2025 to 2035
- Figure 23: Latin America Market Incremental $ Opportunity, 2025 to 2035
- Figure 24: Western Europe Market Incremental $ Opportunity, 2025 to 2035
- Figure 25: East Asia Market Incremental $ Opportunity, 2025 to 2035
- Figure 26: South Asia Pacific Market Incremental $ Opportunity, 2025 to 2035
- Figure 27: Eastern Europe Market Incremental $ Opportunity, 2025 to 2035
- Figure 28: Middle East & Africa Market Incremental $ Opportunity, 2025 to 2035
- Figure 29: North America Market Value Share and BPS Analysis by Country, 2025 and 2035
- Figure 30: North America Market Value Share and BPS Analysis by Enzyme Type, 2025 and 2035
- Figure 31: North America Market Y-o-Y Growth Comparison by Enzyme Type, 2025 to 2035
- Figure 32: North America Market Attractiveness Analysis by Enzyme Type
- Figure 33: North America Market Value Share and BPS Analysis by Source, 2025 and 2035
- Figure 34: North America Market Y-o-Y Growth Comparison by Source, 2025 to 2035
- Figure 35: North America Market Attractiveness Analysis by Source
- Figure 36: North America Market Value Share and BPS Analysis by Functionality, 2025 and 2035
- Figure 37: North America Market Y-o-Y Growth Comparison by Functionality, 2025 to 2035
- Figure 38: North America Market Attractiveness Analysis by Functionality
- Figure 39: North America Market Value Share and BPS Analysis by Application, 2025 and 2035
- Figure 40: North America Market Y-o-Y Growth Comparison by Application, 2025 to 2035
- Figure 41: North America Market Attractiveness Analysis by Application
- Figure 42: North America Market Value Share and BPS Analysis by End Use Industry, 2025 and 2035
- Figure 43: North America Market Y-o-Y Growth Comparison by End Use Industry, 2025 to 2035
- Figure 44: North America Market Attractiveness Analysis by End Use Industry
- Figure 45: Latin America Market Value Share and BPS Analysis by Country, 2025 and 2035
- Figure 46: Latin America Market Value Share and BPS Analysis by Enzyme Type, 2025 and 2035
- Figure 47: Latin America Market Y-o-Y Growth Comparison by Enzyme Type, 2025 to 2035
- Figure 48: Latin America Market Attractiveness Analysis by Enzyme Type
- Figure 49: Latin America Market Value Share and BPS Analysis by Source, 2025 and 2035
- Figure 50: Latin America Market Y-o-Y Growth Comparison by Source, 2025 to 2035
- Figure 51: Latin America Market Attractiveness Analysis by Source
- Figure 52: Latin America Market Value Share and BPS Analysis by Functionality, 2025 and 2035
- Figure 53: Latin America Market Y-o-Y Growth Comparison by Functionality, 2025 to 2035
- Figure 54: Latin America Market Attractiveness Analysis by Functionality
- Figure 55: Latin America Market Value Share and BPS Analysis by Application, 2025 and 2035
- Figure 56: Latin America Market Y-o-Y Growth Comparison by Application, 2025 to 2035
- Figure 57: Latin America Market Attractiveness Analysis by Application
- Figure 58: Latin America Market Value Share and BPS Analysis by End Use Industry, 2025 and 2035
- Figure 59: Latin America Market Y-o-Y Growth Comparison by End Use Industry, 2025 to 2035
- Figure 60: Latin America Market Attractiveness Analysis by End Use Industry
- Figure 61: Western Europe Market Value Share and BPS Analysis by Country, 2025 and 2035
- Figure 62: Western Europe Market Value Share and BPS Analysis by Enzyme Type, 2025 and 2035
- Figure 63: Western Europe Market Y-o-Y Growth Comparison by Enzyme Type, 2025 to 2035
- Figure 64: Western Europe Market Attractiveness Analysis by Enzyme Type
- Figure 65: Western Europe Market Value Share and BPS Analysis by Source, 2025 and 2035
- Figure 66: Western Europe Market Y-o-Y Growth Comparison by Source, 2025 to 2035
- Figure 67: Western Europe Market Attractiveness Analysis by Source
- Figure 68: Western Europe Market Value Share and BPS Analysis by Functionality, 2025 and 2035
- Figure 69: Western Europe Market Y-o-Y Growth Comparison by Functionality, 2025 to 2035
- Figure 70: Western Europe Market Attractiveness Analysis by Functionality
- Figure 71: Western Europe Market Value Share and BPS Analysis by Application, 2025 and 2035
- Figure 72: Western Europe Market Y-o-Y Growth Comparison by Application, 2025 to 2035
- Figure 73: Western Europe Market Attractiveness Analysis by Application
- Figure 74: Western Europe Market Value Share and BPS Analysis by End Use Industry, 2025 and 2035
- Figure 75: Western Europe Market Y-o-Y Growth Comparison by End Use Industry, 2025 to 2035
- Figure 76: Western Europe Market Attractiveness Analysis by End Use Industry
- Figure 77: East Asia Market Value Share and BPS Analysis by Country, 2025 and 2035
- Figure 78: East Asia Market Value Share and BPS Analysis by Enzyme Type, 2025 and 2035
- Figure 79: East Asia Market Y-o-Y Growth Comparison by Enzyme Type, 2025 to 2035
- Figure 80: East Asia Market Attractiveness Analysis by Enzyme Type
- Figure 81: East Asia Market Value Share and BPS Analysis by Source, 2025 and 2035
- Figure 82: East Asia Market Y-o-Y Growth Comparison by Source, 2025 to 2035
- Figure 83: East Asia Market Attractiveness Analysis by Source
- Figure 84: East Asia Market Value Share and BPS Analysis by Functionality, 2025 and 2035
- Figure 85: East Asia Market Y-o-Y Growth Comparison by Functionality, 2025 to 2035
- Figure 86: East Asia Market Attractiveness Analysis by Functionality
- Figure 87: East Asia Market Value Share and BPS Analysis by Application, 2025 and 2035
- Figure 88: East Asia Market Y-o-Y Growth Comparison by Application, 2025 to 2035
- Figure 89: East Asia Market Attractiveness Analysis by Application
- Figure 90: East Asia Market Value Share and BPS Analysis by End Use Industry, 2025 and 2035
- Figure 91: East Asia Market Y-o-Y Growth Comparison by End Use Industry, 2025 to 2035
- Figure 92: East Asia Market Attractiveness Analysis by End Use Industry
- Figure 93: South Asia Pacific Market Value Share and BPS Analysis by Country, 2025 and 2035
- Figure 94: South Asia Pacific Market Value Share and BPS Analysis by Enzyme Type, 2025 and 2035
- Figure 95: South Asia Pacific Market Y-o-Y Growth Comparison by Enzyme Type, 2025 to 2035
- Figure 96: South Asia Pacific Market Attractiveness Analysis by Enzyme Type
- Figure 97: South Asia Pacific Market Value Share and BPS Analysis by Source, 2025 and 2035
- Figure 98: South Asia Pacific Market Y-o-Y Growth Comparison by Source, 2025 to 2035
- Figure 99: South Asia Pacific Market Attractiveness Analysis by Source
- Figure 100: South Asia Pacific Market Value Share and BPS Analysis by Functionality, 2025 and 2035
- Figure 101: South Asia Pacific Market Y-o-Y Growth Comparison by Functionality, 2025 to 2035
- Figure 102: South Asia Pacific Market Attractiveness Analysis by Functionality
- Figure 103: South Asia Pacific Market Value Share and BPS Analysis by Application, 2025 and 2035
- Figure 104: South Asia Pacific Market Y-o-Y Growth Comparison by Application, 2025 to 2035
- Figure 105: South Asia Pacific Market Attractiveness Analysis by Application
- Figure 106: South Asia Pacific Market Value Share and BPS Analysis by End Use Industry, 2025 and 2035
- Figure 107: South Asia Pacific Market Y-o-Y Growth Comparison by End Use Industry, 2025 to 2035
- Figure 108: South Asia Pacific Market Attractiveness Analysis by End Use Industry
- Figure 109: Eastern Europe Market Value Share and BPS Analysis by Country, 2025 and 2035
- Figure 110: Eastern Europe Market Value Share and BPS Analysis by Enzyme Type, 2025 and 2035
- Figure 111: Eastern Europe Market Y-o-Y Growth Comparison by Enzyme Type, 2025 to 2035
- Figure 112: Eastern Europe Market Attractiveness Analysis by Enzyme Type
- Figure 113: Eastern Europe Market Value Share and BPS Analysis by Source, 2025 and 2035
- Figure 114: Eastern Europe Market Y-o-Y Growth Comparison by Source, 2025 to 2035
- Figure 115: Eastern Europe Market Attractiveness Analysis by Source
- Figure 116: Eastern Europe Market Value Share and BPS Analysis by Functionality, 2025 and 2035
- Figure 117: Eastern Europe Market Y-o-Y Growth Comparison by Functionality, 2025 to 2035
- Figure 118: Eastern Europe Market Attractiveness Analysis by Functionality
- Figure 119: Eastern Europe Market Value Share and BPS Analysis by Application, 2025 and 2035
- Figure 120: Eastern Europe Market Y-o-Y Growth Comparison by Application, 2025 to 2035
- Figure 121: Eastern Europe Market Attractiveness Analysis by Application
- Figure 122: Eastern Europe Market Value Share and BPS Analysis by End Use Industry, 2025 and 2035
- Figure 123: Eastern Europe Market Y-o-Y Growth Comparison by End Use Industry, 2025 to 2035
- Figure 124: Eastern Europe Market Attractiveness Analysis by End Use Industry
- Figure 125: Middle East & Africa Market Value Share and BPS Analysis by Country, 2025 and 2035
- Figure 126: Middle East & Africa Market Value Share and BPS Analysis by Enzyme Type, 2025 and 2035
- Figure 127: Middle East & Africa Market Y-o-Y Growth Comparison by Enzyme Type, 2025 to 2035
- Figure 128: Middle East & Africa Market Attractiveness Analysis by Enzyme Type
- Figure 129: Middle East & Africa Market Value Share and BPS Analysis by Source, 2025 and 2035
- Figure 130: Middle East & Africa Market Y-o-Y Growth Comparison by Source, 2025 to 2035
- Figure 131: Middle East & Africa Market Attractiveness Analysis by Source
- Figure 132: Middle East & Africa Market Value Share and BPS Analysis by Functionality, 2025 and 2035
- Figure 133: Middle East & Africa Market Y-o-Y Growth Comparison by Functionality, 2025 to 2035
- Figure 134: Middle East & Africa Market Attractiveness Analysis by Functionality
- Figure 135: Middle East & Africa Market Value Share and BPS Analysis by Application, 2025 and 2035
- Figure 136: Middle East & Africa Market Y-o-Y Growth Comparison by Application, 2025 to 2035
- Figure 137: Middle East & Africa Market Attractiveness Analysis by Application
- Figure 138: Middle East & Africa Market Value Share and BPS Analysis by End Use Industry, 2025 and 2035
- Figure 139: Middle East & Africa Market Y-o-Y Growth Comparison by End Use Industry, 2025 to 2035
- Figure 140: Middle East & Africa Market Attractiveness Analysis by End Use Industry
- Figure 141: Global Market - Tier Structure Analysis
- Figure 142: Global Market - Company Share Analysis
- FAQs -
What was the global Enzyme-enhanced ingredients market size reported by Fact.MR for 2025?
The global enzyme-enhanced ingredients market was valued at USD 6,210 million in 2025.
Who are the major players operating in the enzyme-enhanced ingredients market?
Prominent players in the market are Novozymes, DuPont Nutrition & Biosciences (IFF), DSM-Firmenich, AB Enzymes, Chr. Hansen, Kerry Group, BASF, Advanced Enzyme Technologies, Amano Enzyme, Biocatalysts, Corbion, Cargill, and Archer Daniels Midland Company (ADM).
What is the Estimated Valuation of the enzyme-enhanced ingredients market in 2035?
The market is expected to reach a valuation of USD 11,657 million in 2035.
What value CAGR did the Enzyme-enhanced ingredients market exhibit over the last five years?
The historic growth rate of the Enzyme-enhanced ingredients market was 4.1% from 2020-2024.