MFGM Ingredients Market
MFGM Ingredients Market Analysis, By Source, By Formulation, By Functionality, By Extraction Method, By Application, By End User, By Distribution Channel, and Region - Market Insights 2025 to 2035
The Cow Milk segment is projected to grow at a CAGR of 10.6%, whereas another segment Buffalo Milk is likely to grow at 10.2%. In terms of countries US is projected to grow at 8.6%, followed by Germany at 7.9% and France to grow at 7.4%.
MFGM Ingredients Market Outlook (2025 to 2035)
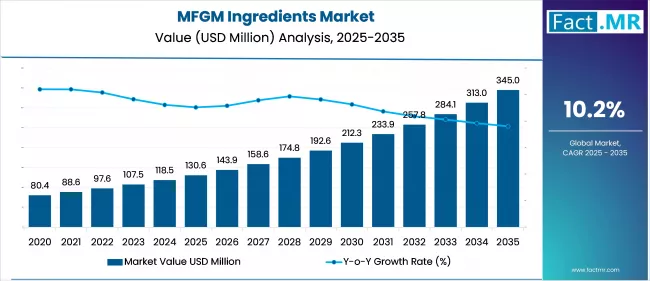
The global MFGM ingredients market is expected to reach USD 345 million by 2035, up from USD 118.5 million in 2024. During the forecast period 2025 to 2035, the industry is projected to expand at a CAGR of 10.2%, driven by surging demand for premium infant formulas, growing clinical validation of cognitive and immune health benefits, and increasing adoption across functional dairy.
Manufacturers have adopted advanced extraction technologies, while regulatory frameworks have progressed to support innovation. Collectively, these dynamics have positioned MFGM as a strategic asset in high-value nutrition portfolios.
What has driven the increasing demand for MFGM ingredients in global functional nutrition markets?
The key growth factors in the MFGM ingredients market include increasing health awareness, a surge in demand for functional and fortified foods, and a greater focus on nutrition at an early age. The structural similarity of MFGM with constituents present in human breast milk has significantly contributed to its use in infant milk supplements.
Growing consumer interest in brain health, immune support, and digestive wellness has influenced manufacturers to reformulate their offerings. To meet these shifting health demands, companies are increasingly incorporating milk fat globule membrane (MFGM) into a wider range of products.
Development in food processing and biotechnology has enhanced the extraction and utilization process for making MFGM, making it even more commercially feasible. Also, heightened visibility through clinical studies has increased consumer confidence and supported broader market adoption.
What key trends have shaped the growth of the MFGM Ingredients Market in recent years?
Several emerging trends have been experienced in the market, including a shift toward personalized nutrition and a growing preference for clean-label products that focus on natural ingredients and avoid processed components. There has been an increased interest in functional foods among consumers seeking holistic well-being, which has contributed to the use of MFGM in dairy drinks, as well as in yogurts, as health supplements.
Advances in encapsulation and formulation technology have enabled the better preservation of the bioactive properties of MFGM. Collaborations between research institutions and food companies have played a key role in advancing scientific understanding and exploration of MFGM. Recently, the use of MFGM in adult nutrition, particularly in health attributes such as cognitive support and muscle recovery, has also received increased attention.
What have been the major restraints limiting growth in the global MFGM Ingredients Market recently?
Despite the promising outlook, the MFGM ingredients market encounters a few challenges. The cost of production involving extraction and purification limits availability and volume. High cost and specialized technology create entry barriers for smaller manufacturers.
Along with inconsistencies in milk supply and variability in raw milk quality, product reliability can be compromised. The differing regulations across global markets present an obstacle to standardization and broader commercialization.
Consumer awareness in certain regions, along with skepticism of functional ingredients, may also hinder adoption. Addressing these issues will require investment in cost-effective technologies, the establishment of clear labels, and continued efforts to educate consumers about the benefits of MFGM.
Which regions have driven the strongest growth in the MFGM Ingredients Market since 2020 and why?
The North America market has recorded a considerable growth in MFGM ingredients supported by extensive dairy industry and significant demand for infant nutrition and functional foods. The regulatory approvals and consumer education have encouraged the product development whereas the mature R&D facility has facilitated innovation and commercialization of MFGM based products in the region.
East Asia has recorded growth in recent years in terms of MFGM ingredients, driven by increases in disposable incomes, urbanization, and greater focus on mindful eating among both children and adults. There has been a high demand for premium dairy and health products among consumers. The region has also seen increased investment, local production, and product development.
Western Europe continues to drive steady demand for MFGM ingredients, aided by its emphasis on premium nutrition, a well-established dairy processing sector, and a health-aware consumer base. This sustained interest reflects the region's commitment to functional food innovation and quality-driven dietary preferences.
Regulatory settings have favored functional ingredients, and food producers have introduced MFGM-enriched foodstuffs in both infant nutrition and the functional dairy sector to keep pace with developments in wellness.
Country-wise Outlook
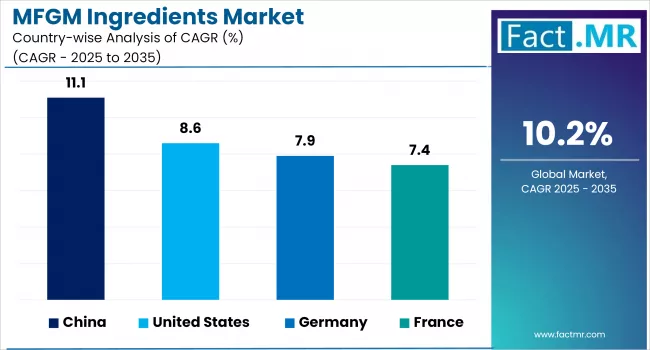
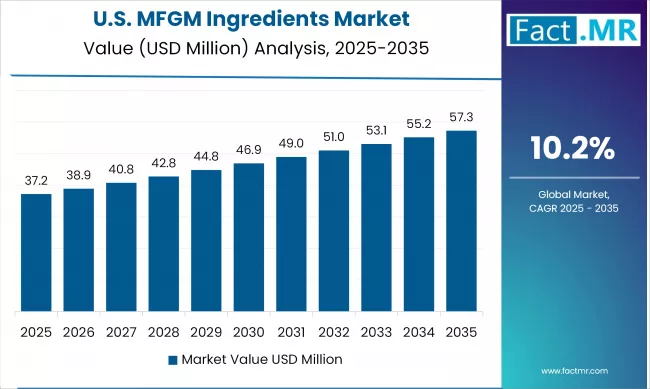
Health-Conscious Consumers and Functional Ingredients Boost U.S. MFGM Ingredients Market
The U.S. market of MFGM ingredients has experienced continuous growth, and this has been fueled by the shift in preferences of the consumers to nutrient-enriched and functional foods. The growing demand of wellness and clean-label ingredients has made large-scale food producers invest in natural food preservatives such as MFGM ingredients.
This development is based on a wider shift in consumer eating patterns, which are shifting towards health- focused and transparent choices. High quality bread like artisan and organic bread that in many cases contain MFGM ingredients and which are free of additives has become widely accepted.
Besides, the increased popularity of convenience-based products, including frozen dough, revealed the advantages of MFGM ingredients in enhancing the shelf life while preserving the quality, taste, and flavor.
Clean-Label Compliance and Dairy Innovation Propel Germany’s MFGM Ingredients Market
In Germany, MFGM ingredients market has been influenced by high regulatory compliance and increasing consumer demand to buy clean-label products. Growing concerns over food safety in Europe, coupled with consumer preference for additive-free and organic products, have prompted food manufacturers to increasingly adopt natural preservatives.
This shift reflects the industry's effort to align with evolving consumer expectations for clean-label and health-conscious food options. MFGM components have been applied in both dairy and bakery sectors, as it helps preserve the stored food, prevents spoilage and retains the flavor and texture of food.
With the emergence of clean-label regulations, producers have implemented the use of MFGM ingredients into their formulations to maintain product integrity, as well as provide natural and sustainable preservation options to the consumer.
Culinary Heritage and Premiumization Drive France’s MFGM Ingredients Market
MFGM ingredients market in France has been influenced by the country’s established food culture and a shift in consumer preferences toward high-quality, clean-label food and beverages. The demand for naturally derived, minimally processed food ingredients has encouraged the incorporation of MFGM components into traditional dairy and bakery products.
This trend highlights a broader movement toward clean-label formulations and functional nutrition in everyday foods. The French market has been inclining towards health-oriented and transparent consumption patterns, drawing interest from manufacturers keen at integrating MFGM ingredients and building more nutritionally rich products while maintaining authenticity.
This trend of premiumization and the increasing demand in clean labels has made the MFGM ingredients a notable addition to the evolving food landscape in France.
Category-Wise Market Outlook
Cow Milk Holds Strong as a Nutritional Benchmark Backed by Scale and Functional Versatility
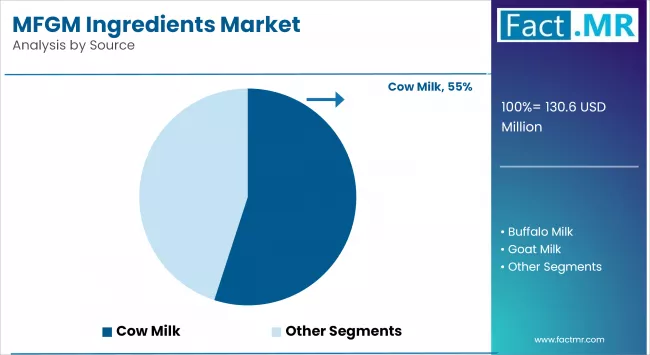
Cow milk remains the leading source in the MFGM ingredients market, recognized for its established nutritional profile and functional adaptability. Its broad application among different sections of consumers and global availability have strengthened its position, especially on a large scale in the food and nutrition sectors.
Cow milk is used in both traditional and current formulations, as it contains proteins, calcium and key micronutrients that continue to support its relevance. Cow milk is also more suitable for higher-end processing and enrichment practices as demand increases in clean-label products, fortified cow dairy products and functional wellness products.
Its longstanding association as a reliable, healthy body food or staple attained through the controlled production capabilities of dairy commercial operations has led to its use in infant formulas, clinical nutrition, and general wellness products across multiple markets.
Powdered Format Advances as Shelf Stability and Application Flexibility Dominate
The powdered MFGM has been observed to grow at an accelerated rate, driven by formulation, which is enhanced by extended shelf life, transportation, and incorporation flexibility, in the context of infant formulas, supplements, and clinical foods.
This format has attracted manufacturers keen on an efficient, scalable, and export-ready solution to ingredients. The ease of administration, as well as integration of the formulation, has also contributed to demand in areas where liquid-based formulations face logistical challenges.
The powdered forms are well-suited for supporting online and direct-to-consumer product development initiatives, making them a practical choice in the context of shifting global distribution patterns.
Cognitive Health Gains Traction with Infant Nutrition and Aging Brain Focus
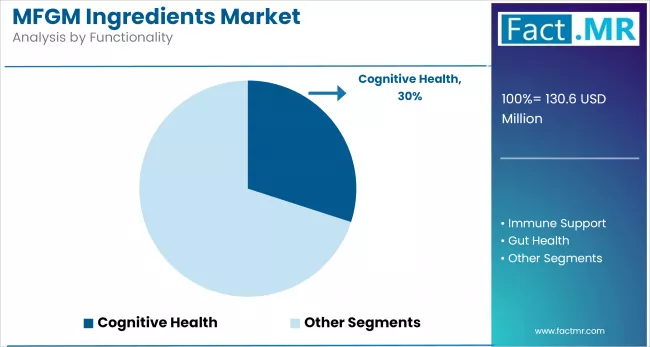
Cognitive health is emerging as a key area of focus within the functional applications of the MFGM ingredients market. This growing interest is fueled by consumer demand for nutrition that supports brain function across various age groups.
This trend is linked to emerging scientific evidence highlighting the role of MFGM in brain development in infants and preserving cognitive functions in older people. Creativity in early-life nutrition, particularly formula products that aim to reflect the cognitive advantages of breast milk, has played a critical catalytic role in demand.
Simultaneously, the trend toward cognitive-benefiting supplements to older cohorts in North America, Europe, and East Asia has increased the scope of this functionality, making MFGM the pillar of a neuro-supportive diet.
Competitive Analysis
Competitive Outlook: MFGM Ingredients Market
The market of MFGM (milk fat globule membrane) ingredients has been shaped by dairy co-operatives and global nutrition food companies that have specialized in early-life and functional food applications. The NZMP brand of Fonterra has placed a priority on science-based dairy ingredients specifically designed to support infant nutrition in markets such as China.
FrieslandCampina Ingredients increased the supply of MFGM and whey protein isolate to supply global consumers as the demand of special ingredients rises. Arla Foods Ingredients has launched Lacprodan Premium MFGM-10, a dry-blend MFGM ingredient to reduce energy consumption and production costs in formulation manufacturing.
Glanbia Nutritionals has created a new concentrate containing whey protein with MFGM phospholipids called NeoShield which aims at helping in immune and cognitive support in toddler years, children, and maternal health. The Lactalis Ingredients, that is a subsidiary of the Lactalis Group, has used its presence on an international level to be able to offer high-quality dairy ingredients to use in different applications.
Kerry Group has made innovations in the field of taste and nutritional offerings with ingredients that provide value in terms of taste and nutritional categorization to food and beverages. DMK Group has also been supplying various dairy products that cover the food industry requirements such as milk powders and cheeses.
Tatua Co-operative Dairy Company has been developing dairy ingredients of high value, including phospholipid concentrates rich in MFGM elements. Hilmar Cheese Company maintained a presence in cheese production and whey protein supply, whereas Bega Cheese Ltd has marketed a wide array of dairy products, contributing to the overall landscape of the MFGM ingredients market.
Key players in the MFGM Ingredients industry include Fonterra Co-operative Group, FrieslandCampina, Arla Foods Ingredients Group, Glanbia plc, Lactalis Ingredients, Kerry Group, DMK Group, Tatua Co-operative Dairy Company, Hilmar Cheese Company, and Bega Cheese Ltd.
Recent Development
- In April 2025, Arla Foods Ingredients launched the Whey360 campaign, highlighting the benefits of MFGM beyond infant nutrition. The initiative showcases MFGM-enriched products, including squeezable cheese, UHT drinks, and high-protein yogurts, targeting both adults and children. This campaign aligns with the EU's recognition of MFGM as a non-novel food, facilitating its broader application in functional nutrition.
- In January 2024, FrieslandCampina Ingredients received approval from Thailand's FDA for its Vivinal® MFGM ingredient. This approval enables the incorporation of Vivinal® MFGM into premium infant milk formulas in Thailand, a market where 74% of new launches now include bioactive ingredients.
Fact.MR has provided detailed information about the price points of key manufacturers of the MFGM Ingredients Market, positioned across regions, including sales growth, production capacity, and speculative technological expansion, in the recently published report.
Methodology and Industry Tracking Approach
The 2025 global MFGM ingredients market report by Fact.MR presents a new standard in strategic market analysis. It delivers a highly detailed view of the expanding role of MFGM ingredients in modern foodservice, next-generation dairy formulations, and responsible nutrition models.
Based on insights from more than 7,500 respondents across 35 countries, the report incorporates the perspectives of decision-makers, technical experts, and category innovators. Research was conducted from July 2024 to June 2025, capturing shifts in milk origin preferences, as well as advancements in processing technologies such as energy-saving microfiltration, and regulatory developments related to labeling and trade.
Fact.MR has continuously tracked this market since 2018. Supported by over 250 validated sources and advanced modeling techniques, the report equips processors, food strategists, and investors with actionable, forward-focused intelligence.
Segmentation of MFGM Ingredients Market Research
-
By Source :
- Cow Milk
- Buffalo Milk
- Goat Milk
- Camel Milk
- Yak Milk
-
By Formulation Type :
- Powdered
- Liquid
-
By Functionality :
- Cognitive Health
- Immune Support
- Gut Health
- Skin Rejuvenation (Cosmetics)
- Neurodevelopment (Infants)
-
By Extraction Method :
- Membrane Filtration
- Enzymatic Treatment
- Ultrafiltration
- Mechanical Separation
- Others
-
By Application :
- Infant Nutrition
- Dairy Products
- Functional Foods & Beverages
- Nutritional Supplements
- Pharmaceuticals & Cosmetics
-
By End User :
- Food Industry
- Healthcare Sector
- Research Institutions
- Cosmetic Industry
-
By Distribution Channel :
- Online Retailers
- Supermarkets/Hypermarkets
- Specialty Stores
- Direct Sales
-
By Region :
- North America
- Latin America
- Western Europe
- Eastern Europe
- East Asia
- South Asia & Pacific
- Middle East & Africa
Table of Content
- Executive Summary
- Global Market Outlook
- Demand-side Trends
- Supply-side Trends
- Technology Roadmap Analysis
- Analysis and Recommendations
- Market Overview
- Market Coverage / Taxonomy
- Market Definition / Scope / Limitations
- Market Background
- Market Dynamics
- Drivers
- Restraints
- Opportunity
- Trends
- Scenario Forecast
- Demand in Optimistic Scenario
- Demand in Likely Scenario
- Demand in Conservative Scenario
- Opportunity Map Analysis
- Product Life Cycle Analysis
- Supply Chain Analysis
- Supply Side Participants and their Roles
- Producers
- Mid-Level Participants (Traders/ Agents/ Brokers)
- Wholesalers and Distributors
- Value Added and Value Created at Node in the Supply Chain
- List of Raw Material Suppliers
- List of Existing and Potential Buyers
- Supply Side Participants and their Roles
- Investment Feasibility Matrix
- Value Chain Analysis
- Profit Margin Analysis
- Wholesalers and Distributors
- Retailers
- PESTLE and Porter’s Analysis
- Regulatory Landscape
- By Key Regions
- By Key Countries
- Production and Consumption Statistics
- Import and Export Statistics
- Market Dynamics
- Global Market Analysis 2020 to 2024 and Forecast, 2025 to 2035
- Historical Market Size Value (USD Mn) & Volume (Tons) Analysis, 2020 to 2024
- Current and Future Market Size Value (USD Mn) & Volume (Tons) Projections, 2025 to 2035
- Y-o-Y Growth Trend Analysis
- Absolute $ Opportunity Analysis
- Global Market Pricing Analysis 2020 to 2024 and Forecast 2025 to 2035
- Global Market Analysis 2020 to 2024 and Forecast 2025 to 2035, By Source
- Introduction / Key Findings
- Historical Market Size Value (USD Mn) & Volume (Tons) Analysis By Source, 2020 to 2024
- Current and Future Market Size Value (USD Mn) & Volume (Tons) Analysis and Forecast By Source, 2025 to 2035
- Cow Milk
- Buffalo Milk
- Goat Milk
- Camel Milk
- Yak Milk
- Y-o-Y Growth Trend Analysis By Source, 2020 to 2024
- Absolute $ Opportunity Analysis By Source, 2025 to 2035
- Global Market Analysis 2020 to 2024 and Forecast 2025 to 2035, By Formulation Type
- Introduction / Key Findings
- Historical Market Size Value (USD Mn) & Volume (Tons) Analysis By Formulation Type, 2020 to 2024
- Current and Future Market Size Value (USD Mn) & Volume (Tons) Analysis and Forecast By Formulation Type, 2025 to 2035
- Powdered
- Liquid
- Y-o-Y Growth Trend Analysis By Formulation Type, 2020 to 2024
- Absolute $ Opportunity Analysis By Formulation Type, 2025 to 2035
- Global Market Analysis 2020 to 2024 and Forecast 2025 to 2035, By Functionality
- Introduction / Key Findings
- Historical Market Size Value (USD Mn) & Volume (Tons) Analysis By Functionality, 2020 to 2024
- Current and Future Market Size Value (USD Mn) & Volume (Tons) Analysis and Forecast By Functionality, 2025 to 2035
- Cognitive Health
- Immune Support
- Gut Health
- Skin Rejuvenation (Cosmetics)
- Neurodevelopment (Infants)
- Y-o-Y Growth Trend Analysis By Functionality, 2020 to 2024
- Absolute $ Opportunity Analysis By Functionality, 2025 to 2035
- Global Market Analysis 2020 to 2024 and Forecast 2025 to 2035, By Extraction Method
- Introduction / Key Findings
- Historical Market Size Value (USD Mn) & Volume (Tons) Analysis By Extraction Method, 2020 to 2024
- Current and Future Market Size Value (USD Mn) & Volume (Tons) Analysis and Forecast By Extraction Method, 2025 to 2035
- Membrane Filtration
- Enzymatic Treatment
- Ultrafiltration
- Mechanical Separation
- Others
- Y-o-Y Growth Trend Analysis By Extraction Method, 2020 to 2024
- Absolute $ Opportunity Analysis By Extraction Method, 2025 to 2035
- Global Market Analysis 2020 to 2024 and Forecast 2025 to 2035, By Application
- Introduction / Key Findings
- Historical Market Size Value (USD Mn) & Volume (Tons) Analysis By Application, 2020 to 2024
- Current and Future Market Size Value (USD Mn) & Volume (Tons) Analysis and Forecast By Application, 2025 to 2035
- Infant Nutrition
- Dairy Products
- Functional Foods & Beverages
- Nutritional Supplements
- Pharmaceuticals & Cosmetics
- Y-o-Y Growth Trend Analysis By Application, 2020 to 2024
- Absolute $ Opportunity Analysis By Application, 2025 to 2035
- Global Market Analysis 2020 to 2024 and Forecast 2025 to 2035, By End User
- Introduction / Key Findings
- Historical Market Size Value (USD Mn) & Volume (Tons) Analysis By End User, 2020 to 2024
- Current and Future Market Size Value (USD Mn) & Volume (Tons) Analysis and Forecast By End User, 2025 to 2035
- Food Industry
- Healthcare Sector
- Research Institutions
- Cosmetic Industry
- Y-o-Y Growth Trend Analysis By End User, 2020 to 2024
- Absolute $ Opportunity Analysis By End User, 2025 to 2035
- Global Market Analysis 2020 to 2024 and Forecast 2025 to 2035, By Distribution Channel
- Introduction / Key Findings
- Historical Market Size Value (USD Mn) & Volume (Tons) Analysis By Distribution Channel, 2020 to 2024
- Current and Future Market Size Value (USD Mn) & Volume (Tons) Analysis and Forecast By Distribution Channel, 2025 to 2035
- Online Retailers
- Supermarkets/Hypermarkets
- Specialty Stores
- Direct Sales
- Y-o-Y Growth Trend Analysis By Distribution Channel, 2020 to 2024
- Absolute $ Opportunity Analysis By Distribution Channel, 2025 to 2035
- Global Market Analysis 2020 to 2024 and Forecast 2025 to 2035, By Region
- Introduction
- Historical Market Size Value (USD Mn) & Volume (Tons) Analysis By Region, 2020 to 2024
- Current Market Size Value (USD Mn) & Volume (Tons) Analysis and Forecast By Region, 2025 to 2035
- North America
- Latin America
- Europe
- East Asia
- South Asia
- Oceania
- MEA
- Market Attractiveness Analysis By Region
- North America Market Analysis 2020 to 2024 and Forecast 2025 to 2035, By Country
- Historical Market Size Value (USD Mn) & Volume (Tons) Trend Analysis By Market Taxonomy, 2020 to 2024
- Market Size Value (USD Mn) & Volume (Tons) Forecast By Market Taxonomy, 2025 to 2035
- By Country
- U.S.
- Canada
- By Source
- By Formulation Type
- By Functionality
- By Extraction Method
- By Application
- By End User
- By Distribution Channel
- By Country
- Market Attractiveness Analysis
- By Country
- By Source
- By Formulation Type
- By Functionality
- By Extraction Method
- By Application
- By End User
- By Distribution Channel
- Key Takeaways
- Latin America Market Analysis 2020 to 2024 and Forecast 2025 to 2035, By Country
- Historical Market Size Value (USD Mn) & Volume (Tons) Trend Analysis By Market Taxonomy, 2020 to 2024
- Market Size Value (USD Mn) & Volume (Tons) Forecast By Market Taxonomy, 2025 to 2035
- By Country
- Brazil
- Mexico
- Argentina
- Chile
- Peru
- Rest of Latin America
- By Source
- By Formulation Type
- By Functionality
- By Extraction Method
- By Application
- By End User
- By Distribution Channel
- By Country
- Market Attractiveness Analysis
- By Country
- By Source
- By Formulation Type
- By Functionality
- By Extraction Method
- By Application
- By End User
- By Distribution Channel
- Key Takeaways
- Europe Market Analysis 2020 to 2024 and Forecast 2025 to 2035, By Country
- Historical Market Size Value (USD Mn) & Volume (Tons) Trend Analysis By Market Taxonomy, 2020 to 2024
- Market Size Value (USD Mn) & Volume (Tons) Forecast By Market Taxonomy, 2025 to 2035
- By Country
- Germany
- Italy
- France
- U.K.
- Spain
- Russia
- BENELUX
- Rest of Europe
- By Source
- By Formulation Type
- By Functionality
- By Extraction Method
- By Application
- By End User
- By Distribution Channel
- By Country
- Market Attractiveness Analysis
- By Country
- By Source
- By Formulation Type
- By Functionality
- By Extraction Method
- By Application
- By End User
- By Distribution Channel
- Key Takeaways
- East Asia Market Analysis 2020 to 2024 and Forecast 2025 to 2035, By Country
- Historical Market Size Value (USD Mn) & Volume (Tons) Trend Analysis By Market Taxonomy, 2020 to 2024
- Market Size Value (USD Mn) & Volume (Tons) Forecast By Market Taxonomy, 2025 to 2035
- By Country
- China
- Japan
- South Korea
- By Source
- By Formulation Type
- By Functionality
- By Extraction Method
- By Application
- By End User
- By Distribution Channel
- By Country
- Market Attractiveness Analysis
- By Country
- By Source
- By Formulation Type
- By Functionality
- By Extraction Method
- By Application
- By End User
- By Distribution Channel
- Key Takeaways
- South Asia Market Analysis 2020 to 2024 and Forecast 2025 to 2035, By Country
- Historical Market Size Value (USD Mn) & Volume (Tons) Trend Analysis By Market Taxonomy, 2020 to 2024
- Market Size Value (USD Mn) & Volume (Tons) Forecast By Market Taxonomy, 2025 to 2035
- By Country
- India
- Thailand
- Malaysia
- Indonesia
- Rest of South Asia
- By Source
- By Formulation Type
- By Functionality
- By Extraction Method
- By Application
- By End User
- By Distribution Channel
- By Country
- Market Attractiveness Analysis
- By Country
- By Source
- By Formulation Type
- By Functionality
- By Extraction Method
- By Application
- By End User
- By Distribution Channel
- Key Takeaways
- Oceania Market Analysis 2020 to 2024 and Forecast 2025 to 2035, By Country
- Historical Market Size Value (USD Mn) & Volume (Tons) Trend Analysis By Market Taxonomy, 2020 to 2024
- Market Size Value (USD Mn) & Volume (Tons) Forecast By Market Taxonomy, 2025 to 2035
- By Country
- Australia
- New Zealand
- By Source
- By Formulation Type
- By Functionality
- By Extraction Method
- By Application
- By End User
- By Distribution Channel
- By Country
- Market Attractiveness Analysis
- By Country
- By Source
- By Formulation Type
- By Functionality
- By Extraction Method
- By Application
- By End User
- By Distribution Channel
- Key Takeaways
- MEA Market Analysis 2020 to 2024 and Forecast 2025 to 2035, By Country
- Historical Market Size Value (USD Mn) & Volume (Tons) Trend Analysis By Market Taxonomy, 2020 to 2024
- Market Size Value (USD Mn) & Volume (Tons) Forecast By Market Taxonomy, 2025 to 2035
- By Country
- GCC
- Rest of MEA
- By Source
- By Formulation Type
- By Functionality
- By Extraction Method
- By Application
- By End User
- By Distribution Channel
- By Country
- Market Attractiveness Analysis
- By Country
- By Source
- By Formulation Type
- By Functionality
- By Extraction Method
- By Application
- By End User
- By Distribution Channel
- Key Takeaways
- Key Countries Market Analysis
- Value (USD Mn) & Volume (Tons)ed States
- Pricing Analysis
- Market Share Analysis, 2024
- By Source
- By Formulation Type
- By Functionality
- By Extraction Method
- By Application
- By End User
- By Distribution Channel
- Germany
- Pricing Analysis
- Market Share Analysis, 2024
- By Source
- By Formulation Type
- By Functionality
- By Extraction Method
- By Application
- By End User
- By Distribution Channel
- France
- Pricing Analysis
- Market Share Analysis, 2024
- By Source
- By Formulation Type
- By Functionality
- By Extraction Method
- By Application
- By End User
- By Distribution Channel
- China
- Pricing Analysis
- Market Share Analysis, 2024
- By Source
- By Formulation Type
- By Functionality
- By Extraction Method
- By Application
- By End User
- By Distribution Channel
- Japan
- Pricing Analysis
- Market Share Analysis, 2024
- By Source
- By Formulation Type
- By Functionality
- By Extraction Method
- By Application
- By End User
- By Distribution Channel
- Value (USD Mn) & Volume (Tons)ed States
- Market Structure Analysis
- Competition Dashboard
- Competition Benchmarking
- Market Share Analysis of Top Players
- By Regional
- By Source
- By Formulation Type
- By Functionality
- By Extraction Method
- By Application
- By End User
- By Distribution Channel
- Competition Analysis
- Competition Deep Dive
- Fonterra Co-operative Group
- Overview
- Product Portfolio
- Profitability by Market Segments (Product/Age /Sales Channel/Region)
- Sales Footprint
- Strategy Overview
- Marketing Strategy
- Product Strategy
- Channel Strategy
- FrieslandCampina
- Overview
- Product Portfolio
- Profitability by Market Segments (Product/Age /Sales Channel/Region)
- Sales Footprint
- Strategy Overview
- Marketing Strategy
- Product Strategy
- Channel Strategy
- Arla Foods Ingredients Group
- Overview
- Product Portfolio
- Profitability by Market Segments (Product/Age /Sales Channel/Region)
- Sales Footprint
- Strategy Overview
- Marketing Strategy
- Product Strategy
- Channel Strategy
- Glanbia plc
- Overview
- Product Portfolio
- Profitability by Market Segments (Product/Age /Sales Channel/Region)
- Sales Footprint
- Strategy Overview
- Marketing Strategy
- Product Strategy
- Channel Strategy
- Lactalis Ingredients
- Overview
- Product Portfolio
- Profitability by Market Segments (Product/Age /Sales Channel/Region)
- Sales Footprint
- Strategy Overview
- Marketing Strategy
- Product Strategy
- Channel Strategy
- Kerry Group
- Overview
- Product Portfolio
- Profitability by Market Segments (Product/Age /Sales Channel/Region)
- Sales Footprint
- Strategy Overview
- Marketing Strategy
- Product Strategy
- Channel Strategy
- DMK Group
- Overview
- Product Portfolio
- Profitability by Market Segments (Product/Age /Sales Channel/Region)
- Sales Footprint
- Strategy Overview
- Marketing Strategy
- Product Strategy
- Channel Strategy
- Tatua Co-operative Dairy Company
- Overview
- Product Portfolio
- Profitability by Market Segments (Product/Age /Sales Channel/Region)
- Sales Footprint
- Strategy Overview
- Marketing Strategy
- Product Strategy
- Channel Strategy
- Hilmar Cheese Company
- Overview
- Product Portfolio
- Profitability by Market Segments (Product/Age /Sales Channel/Region)
- Sales Footprint
- Strategy Overview
- Marketing Strategy
- Product Strategy
- Channel Strategy
- Bega Cheese Ltd
- Overview
- Product Portfolio
- Profitability by Market Segments (Product/Age /Sales Channel/Region)
- Sales Footprint
- Strategy Overview
- Marketing Strategy
- Product Strategy
- Channel Strategy
- Fonterra Co-operative Group
- Competition Deep Dive
- Assumptions & Acronyms Used
- Research Methodology
List Of Table
- Table 1: Global Market Value (USD Mn) Forecast by Region, 2020 to 2035
- Table 2: Global Market Volume (Tons) Forecast by Region, 2020 to 2035
- Table 3: Global Market Value (USD Mn) Forecast by Source, 2020 to 2035
- Table 4: Global Market Volume (Tons) Forecast by Source, 2020 to 2035
- Table 5: Global Market Value (USD Mn) Forecast by Formulation Type, 2020 to 2035
- Table 6: Global Market Volume (Tons) Forecast by Formulation Type, 2020 to 2035
- Table 7: Global Market Value (USD Mn) Forecast by Functionality, 2020 to 2035
- Table 8: Global Market Volume (Tons) Forecast by Functionality, 2020 to 2035
- Table 9: Global Market Value (USD Mn) Forecast by Extraction Method, 2020 to 2035
- Table 10: Global Market Volume (Tons) Forecast by Extraction Method, 2020 to 2035
- Table 11: Global Market Value (USD Mn) Forecast by Application, 2020 to 2035
- Table 12: Global Market Volume (Tons) Forecast by Application, 2020 to 2035
- Table 13: Global Market Value (USD Mn) Forecast by End User, 2020 to 2035
- Table 14: Global Market Volume (Tons) Forecast by End User, 2020 to 2035
- Table 15: Global Market Value (USD Mn) Forecast by Distribution Channel, 2020 to 2035
- Table 16: Global Market Volume (Tons) Forecast by Distribution Channel, 2020 to 2035
- Table 17: North America Market Value (USD Mn) Forecast by Country, 2020 to 2035
- Table 18: North America Market Volume (Tons) Forecast by Country, 2020 to 2035
- Table 19: North America Market Value (USD Mn) Forecast by Source, 2020 to 2035
- Table 20: North America Market Volume (Tons) Forecast by Source, 2020 to 2035
- Table 21: North America Market Value (USD Mn) Forecast by Formulation Type, 2020 to 2035
- Table 22: North America Market Volume (Tons) Forecast by Formulation Type, 2020 to 2035
- Table 23: North America Market Value (USD Mn) Forecast by Functionality, 2020 to 2035
- Table 24: North America Market Volume (Tons) Forecast by Functionality, 2020 to 2035
- Table 25: North America Market Value (USD Mn) Forecast by Extraction Method, 2020 to 2035
- Table 26: North America Market Volume (Tons) Forecast by Extraction Method, 2020 to 2035
- Table 27: North America Market Value (USD Mn) Forecast by Application, 2020 to 2035
- Table 28: North America Market Volume (Tons) Forecast by Application, 2020 to 2035
- Table 29: North America Market Value (USD Mn) Forecast by End User, 2020 to 2035
- Table 30: North America Market Volume (Tons) Forecast by End User, 2020 to 2035
- Table 31: North America Market Value (USD Mn) Forecast by Distribution Channel, 2020 to 2035
- Table 32: North America Market Volume (Tons) Forecast by Distribution Channel, 2020 to 2035
- Table 33: Latin America Market Value (USD Mn) Forecast by Country, 2020 to 2035
- Table 34: Latin America Market Volume (Tons) Forecast by Country, 2020 to 2035
- Table 35: Latin America Market Value (USD Mn) Forecast by Source, 2020 to 2035
- Table 36: Latin America Market Volume (Tons) Forecast by Source, 2020 to 2035
- Table 37: Latin America Market Value (USD Mn) Forecast by Formulation Type, 2020 to 2035
- Table 38: Latin America Market Volume (Tons) Forecast by Formulation Type, 2020 to 2035
- Table 39: Latin America Market Value (USD Mn) Forecast by Functionality, 2020 to 2035
- Table 40: Latin America Market Volume (Tons) Forecast by Functionality, 2020 to 2035
- Table 41: Latin America Market Value (USD Mn) Forecast by Extraction Method, 2020 to 2035
- Table 42: Latin America Market Volume (Tons) Forecast by Extraction Method, 2020 to 2035
- Table 43: Latin America Market Value (USD Mn) Forecast by Application, 2020 to 2035
- Table 44: Latin America Market Volume (Tons) Forecast by Application, 2020 to 2035
- Table 45: Latin America Market Value (USD Mn) Forecast by End User, 2020 to 2035
- Table 46: Latin America Market Volume (Tons) Forecast by End User, 2020 to 2035
- Table 47: Latin America Market Value (USD Mn) Forecast by Distribution Channel, 2020 to 2035
- Table 48: Latin America Market Volume (Tons) Forecast by Distribution Channel, 2020 to 2035
- Table 49: Europe Market Value (USD Mn) Forecast by Country, 2020 to 2035
- Table 50: Europe Market Volume (Tons) Forecast by Country, 2020 to 2035
- Table 51: Europe Market Value (USD Mn) Forecast by Source, 2020 to 2035
- Table 52: Europe Market Volume (Tons) Forecast by Source, 2020 to 2035
- Table 53: Europe Market Value (USD Mn) Forecast by Formulation Type, 2020 to 2035
- Table 54: Europe Market Volume (Tons) Forecast by Formulation Type, 2020 to 2035
- Table 55: Europe Market Value (USD Mn) Forecast by Functionality, 2020 to 2035
- Table 56: Europe Market Volume (Tons) Forecast by Functionality, 2020 to 2035
- Table 57: Europe Market Value (USD Mn) Forecast by Extraction Method, 2020 to 2035
- Table 58: Europe Market Volume (Tons) Forecast by Extraction Method, 2020 to 2035
- Table 59: Europe Market Value (USD Mn) Forecast by Application, 2020 to 2035
- Table 60: Europe Market Volume (Tons) Forecast by Application, 2020 to 2035
- Table 61: Europe Market Value (USD Mn) Forecast by End User, 2020 to 2035
- Table 62: Europe Market Volume (Tons) Forecast by End User, 2020 to 2035
- Table 63: Europe Market Value (USD Mn) Forecast by Distribution Channel, 2020 to 2035
- Table 64: Europe Market Volume (Tons) Forecast by Distribution Channel, 2020 to 2035
- Table 65: East Asia Market Value (USD Mn) Forecast by Country, 2020 to 2035
- Table 66: East Asia Market Volume (Tons) Forecast by Country, 2020 to 2035
- Table 67: East Asia Market Value (USD Mn) Forecast by Source, 2020 to 2035
- Table 68: East Asia Market Volume (Tons) Forecast by Source, 2020 to 2035
- Table 69: East Asia Market Value (USD Mn) Forecast by Formulation Type, 2020 to 2035
- Table 70: East Asia Market Volume (Tons) Forecast by Formulation Type, 2020 to 2035
- Table 71: East Asia Market Value (USD Mn) Forecast by Functionality, 2020 to 2035
- Table 72: East Asia Market Volume (Tons) Forecast by Functionality, 2020 to 2035
- Table 73: East Asia Market Value (USD Mn) Forecast by Extraction Method, 2020 to 2035
- Table 74: East Asia Market Volume (Tons) Forecast by Extraction Method, 2020 to 2035
- Table 75: East Asia Market Value (USD Mn) Forecast by Application, 2020 to 2035
- Table 76: East Asia Market Volume (Tons) Forecast by Application, 2020 to 2035
- Table 77: East Asia Market Value (USD Mn) Forecast by End User, 2020 to 2035
- Table 78: East Asia Market Volume (Tons) Forecast by End User, 2020 to 2035
- Table 79: East Asia Market Value (USD Mn) Forecast by Distribution Channel, 2020 to 2035
- Table 80: East Asia Market Volume (Tons) Forecast by Distribution Channel, 2020 to 2035
- Table 81: South Asia Market Value (USD Mn) Forecast by Country, 2020 to 2035
- Table 82: South Asia Market Volume (Tons) Forecast by Country, 2020 to 2035
- Table 83: South Asia Market Value (USD Mn) Forecast by Source, 2020 to 2035
- Table 84: South Asia Market Volume (Tons) Forecast by Source, 2020 to 2035
- Table 85: South Asia Market Value (USD Mn) Forecast by Formulation Type, 2020 to 2035
- Table 86: South Asia Market Volume (Tons) Forecast by Formulation Type, 2020 to 2035
- Table 87: South Asia Market Value (USD Mn) Forecast by Functionality, 2020 to 2035
- Table 88: South Asia Market Volume (Tons) Forecast by Functionality, 2020 to 2035
- Table 89: South Asia Market Value (USD Mn) Forecast by Extraction Method, 2020 to 2035
- Table 90: South Asia Market Volume (Tons) Forecast by Extraction Method, 2020 to 2035
- Table 91: South Asia Market Value (USD Mn) Forecast by Application, 2020 to 2035
- Table 92: South Asia Market Volume (Tons) Forecast by Application, 2020 to 2035
- Table 93: South Asia Market Value (USD Mn) Forecast by End User, 2020 to 2035
- Table 94: South Asia Market Volume (Tons) Forecast by End User, 2020 to 2035
- Table 95: South Asia Market Value (USD Mn) Forecast by Distribution Channel, 2020 to 2035
- Table 96: South Asia Market Volume (Tons) Forecast by Distribution Channel, 2020 to 2035
- Table 97: Oceania Market Value (USD Mn) Forecast by Country, 2020 to 2035
- Table 98: Oceania Market Volume (Tons) Forecast by Country, 2020 to 2035
- Table 99: Oceania Market Value (USD Mn) Forecast by Source, 2020 to 2035
- Table 100: Oceania Market Volume (Tons) Forecast by Source, 2020 to 2035
- Table 101: Oceania Market Value (USD Mn) Forecast by Formulation Type, 2020 to 2035
- Table 102: Oceania Market Volume (Tons) Forecast by Formulation Type, 2020 to 2035
- Table 103: Oceania Market Value (USD Mn) Forecast by Functionality, 2020 to 2035
- Table 104: Oceania Market Volume (Tons) Forecast by Functionality, 2020 to 2035
- Table 105: Oceania Market Value (USD Mn) Forecast by Extraction Method, 2020 to 2035
- Table 106: Oceania Market Volume (Tons) Forecast by Extraction Method, 2020 to 2035
- Table 107: Oceania Market Value (USD Mn) Forecast by Application, 2020 to 2035
- Table 108: Oceania Market Volume (Tons) Forecast by Application, 2020 to 2035
- Table 109: Oceania Market Value (USD Mn) Forecast by End User, 2020 to 2035
- Table 110: Oceania Market Volume (Tons) Forecast by End User, 2020 to 2035
- Table 111: Oceania Market Value (USD Mn) Forecast by Distribution Channel, 2020 to 2035
- Table 112: Oceania Market Volume (Tons) Forecast by Distribution Channel, 2020 to 2035
- Table 113: MEA Market Value (USD Mn) Forecast by Country, 2020 to 2035
- Table 114: MEA Market Volume (Tons) Forecast by Country, 2020 to 2035
- Table 115: MEA Market Value (USD Mn) Forecast by Source, 2020 to 2035
- Table 116: MEA Market Volume (Tons) Forecast by Source, 2020 to 2035
- Table 117: MEA Market Value (USD Mn) Forecast by Formulation Type, 2020 to 2035
- Table 118: MEA Market Volume (Tons) Forecast by Formulation Type, 2020 to 2035
- Table 119: MEA Market Value (USD Mn) Forecast by Functionality, 2020 to 2035
- Table 120: MEA Market Volume (Tons) Forecast by Functionality, 2020 to 2035
- Table 121: MEA Market Value (USD Mn) Forecast by Extraction Method, 2020 to 2035
- Table 122: MEA Market Volume (Tons) Forecast by Extraction Method, 2020 to 2035
- Table 123: MEA Market Value (USD Mn) Forecast by Application, 2020 to 2035
- Table 124: MEA Market Volume (Tons) Forecast by Application, 2020 to 2035
- Table 125: MEA Market Value (USD Mn) Forecast by End User, 2020 to 2035
- Table 126: MEA Market Volume (Tons) Forecast by End User, 2020 to 2035
- Table 127: MEA Market Value (USD Mn) Forecast by Distribution Channel, 2020 to 2035
- Table 128: MEA Market Volume (Tons) Forecast by Distribution Channel, 2020 to 2035
List Of Figures
- Figure 1: Global Market Volume (Tons) Forecast 2020 to 2035
- Figure 2: Global Market Pricing Analysis
- Figure 3: Global Market Value (USD Mn) Forecast 2020 to 2035
- Figure 4: Global Market Value Share and BPS Analysis by Source, 2025 and 2035
- Figure 5: Global Market Y-o-Y Growth Comparison by Source, 2025 to 2035
- Figure 6: Global Market Attractiveness Analysis by Source
- Figure 7: Global Market Value Share and BPS Analysis by Formulation Type, 2025 and 2035
- Figure 8: Global Market Y-o-Y Growth Comparison by Formulation Type, 2025 to 2035
- Figure 9: Global Market Attractiveness Analysis by Formulation Type
- Figure 10: Global Market Value Share and BPS Analysis by Functionality, 2025 and 2035
- Figure 11: Global Market Y-o-Y Growth Comparison by Functionality, 2025 to 2035
- Figure 12: Global Market Attractiveness Analysis by Functionality
- Figure 13: Global Market Value Share and BPS Analysis by Extraction Method, 2025 and 2035
- Figure 14: Global Market Y-o-Y Growth Comparison by Extraction Method, 2025 to 2035
- Figure 15: Global Market Attractiveness Analysis by Extraction Method
- Figure 16: Global Market Value Share and BPS Analysis by Application, 2025 and 2035
- Figure 17: Global Market Y-o-Y Growth Comparison by Application, 2025 to 2035
- Figure 18: Global Market Attractiveness Analysis by Application
- Figure 19: Global Market Value Share and BPS Analysis by End User, 2025 and 2035
- Figure 20: Global Market Y-o-Y Growth Comparison by End User, 2025 to 2035
- Figure 21: Global Market Attractiveness Analysis by End User
- Figure 22: Global Market Value Share and BPS Analysis by Distribution Channel, 2025 and 2035
- Figure 23: Global Market Y-o-Y Growth Comparison by Distribution Channel, 2025 to 2035
- Figure 24: Global Market Attractiveness Analysis by Distribution Channel
- Figure 25: Global Market Value (USD Mn) Share and BPS Analysis by Region, 2025 and 2035
- Figure 26: Global Market Y-o-Y Growth Comparison by Region, 2025 to 2035
- Figure 27: Global Market Attractiveness Analysis by Region
- Figure 28: North America Market Incremental $ Opportunity, 2025 to 2035
- Figure 29: Latin America Market Incremental $ Opportunity, 2025 to 2035
- Figure 30: Europe Market Incremental $ Opportunity, 2025 to 2035
- Figure 31: East Asia Market Incremental $ Opportunity, 2025 to 2035
- Figure 32: South Asia Market Incremental $ Opportunity, 2025 to 2035
- Figure 33: Oceania Market Incremental $ Opportunity, 2025 to 2035
- Figure 34: MEA Market Incremental $ Opportunity, 2025 to 2035
- Figure 35: North America Market Value Share and BPS Analysis by Country, 2025 and 2035
- Figure 36: North America Market Value Share and BPS Analysis by Source, 2025 and 2035
- Figure 37: North America Market Y-o-Y Growth Comparison by Source, 2025 to 2035
- Figure 38: North America Market Attractiveness Analysis by Source
- Figure 39: North America Market Value Share and BPS Analysis by Formulation Type, 2025 and 2035
- Figure 40: North America Market Y-o-Y Growth Comparison by Formulation Type, 2025 to 2035
- Figure 41: North America Market Attractiveness Analysis by Formulation Type
- Figure 42: North America Market Value Share and BPS Analysis by Functionality, 2025 and 2035
- Figure 43: North America Market Y-o-Y Growth Comparison by Functionality, 2025 to 2035
- Figure 44: North America Market Attractiveness Analysis by Functionality
- Figure 45: North America Market Value Share and BPS Analysis by Extraction Method, 2025 and 2035
- Figure 46: North America Market Y-o-Y Growth Comparison by Extraction Method, 2025 to 2035
- Figure 47: North America Market Attractiveness Analysis by Extraction Method
- Figure 48: North America Market Value Share and BPS Analysis by Application, 2025 and 2035
- Figure 49: North America Market Y-o-Y Growth Comparison by Application, 2025 to 2035
- Figure 50: North America Market Attractiveness Analysis by Application
- Figure 51: North America Market Value Share and BPS Analysis by End User, 2025 and 2035
- Figure 52: North America Market Y-o-Y Growth Comparison by End User, 2025 to 2035
- Figure 53: North America Market Attractiveness Analysis by End User
- Figure 54: North America Market Value Share and BPS Analysis by Distribution Channel, 2025 and 2035
- Figure 55: North America Market Y-o-Y Growth Comparison by Distribution Channel, 2025 to 2035
- Figure 56: North America Market Attractiveness Analysis by Distribution Channel
- Figure 57: Latin America Market Value Share and BPS Analysis by Country, 2025 and 2035
- Figure 58: Latin America Market Value Share and BPS Analysis by Source, 2025 and 2035
- Figure 59: Latin America Market Y-o-Y Growth Comparison by Source, 2025 to 2035
- Figure 60: Latin America Market Attractiveness Analysis by Source
- Figure 61: Latin America Market Value Share and BPS Analysis by Formulation Type, 2025 and 2035
- Figure 62: Latin America Market Y-o-Y Growth Comparison by Formulation Type, 2025 to 2035
- Figure 63: Latin America Market Attractiveness Analysis by Formulation Type
- Figure 64: Latin America Market Value Share and BPS Analysis by Functionality, 2025 and 2035
- Figure 65: Latin America Market Y-o-Y Growth Comparison by Functionality, 2025 to 2035
- Figure 66: Latin America Market Attractiveness Analysis by Functionality
- Figure 67: Latin America Market Value Share and BPS Analysis by Extraction Method, 2025 and 2035
- Figure 68: Latin America Market Y-o-Y Growth Comparison by Extraction Method, 2025 to 2035
- Figure 69: Latin America Market Attractiveness Analysis by Extraction Method
- Figure 70: Latin America Market Value Share and BPS Analysis by Application, 2025 and 2035
- Figure 71: Latin America Market Y-o-Y Growth Comparison by Application, 2025 to 2035
- Figure 72: Latin America Market Attractiveness Analysis by Application
- Figure 73: Latin America Market Value Share and BPS Analysis by End User, 2025 and 2035
- Figure 74: Latin America Market Y-o-Y Growth Comparison by End User, 2025 to 2035
- Figure 75: Latin America Market Attractiveness Analysis by End User
- Figure 76: Latin America Market Value Share and BPS Analysis by Distribution Channel, 2025 and 2035
- Figure 77: Latin America Market Y-o-Y Growth Comparison by Distribution Channel, 2025 to 2035
- Figure 78: Latin America Market Attractiveness Analysis by Distribution Channel
- Figure 79: Europe Market Value Share and BPS Analysis by Country, 2025 and 2035
- Figure 80: Europe Market Value Share and BPS Analysis by Source, 2025 and 2035
- Figure 81: Europe Market Y-o-Y Growth Comparison by Source, 2025 to 2035
- Figure 82: Europe Market Attractiveness Analysis by Source
- Figure 83: Europe Market Value Share and BPS Analysis by Formulation Type, 2025 and 2035
- Figure 84: Europe Market Y-o-Y Growth Comparison by Formulation Type, 2025 to 2035
- Figure 85: Europe Market Attractiveness Analysis by Formulation Type
- Figure 86: Europe Market Value Share and BPS Analysis by Functionality, 2025 and 2035
- Figure 87: Europe Market Y-o-Y Growth Comparison by Functionality, 2025 to 2035
- Figure 88: Europe Market Attractiveness Analysis by Functionality
- Figure 89: Europe Market Value Share and BPS Analysis by Extraction Method, 2025 and 2035
- Figure 90: Europe Market Y-o-Y Growth Comparison by Extraction Method, 2025 to 2035
- Figure 91: Europe Market Attractiveness Analysis by Extraction Method
- Figure 92: Europe Market Value Share and BPS Analysis by Application, 2025 and 2035
- Figure 93: Europe Market Y-o-Y Growth Comparison by Application, 2025 to 2035
- Figure 94: Europe Market Attractiveness Analysis by Application
- Figure 95: Europe Market Value Share and BPS Analysis by End User, 2025 and 2035
- Figure 96: Europe Market Y-o-Y Growth Comparison by End User, 2025 to 2035
- Figure 97: Europe Market Attractiveness Analysis by End User
- Figure 98: Europe Market Value Share and BPS Analysis by Distribution Channel, 2025 and 2035
- Figure 99: Europe Market Y-o-Y Growth Comparison by Distribution Channel, 2025 to 2035
- Figure 100: Europe Market Attractiveness Analysis by Distribution Channel
- Figure 101: East Asia Market Value Share and BPS Analysis by Country, 2025 and 2035
- Figure 102: East Asia Market Value Share and BPS Analysis by Source, 2025 and 2035
- Figure 103: East Asia Market Y-o-Y Growth Comparison by Source, 2025 to 2035
- Figure 104: East Asia Market Attractiveness Analysis by Source
- Figure 105: East Asia Market Value Share and BPS Analysis by Formulation Type, 2025 and 2035
- Figure 106: East Asia Market Y-o-Y Growth Comparison by Formulation Type, 2025 to 2035
- Figure 107: East Asia Market Attractiveness Analysis by Formulation Type
- Figure 108: East Asia Market Value Share and BPS Analysis by Functionality, 2025 and 2035
- Figure 109: East Asia Market Y-o-Y Growth Comparison by Functionality, 2025 to 2035
- Figure 110: East Asia Market Attractiveness Analysis by Functionality
- Figure 111: East Asia Market Value Share and BPS Analysis by Extraction Method, 2025 and 2035
- Figure 112: East Asia Market Y-o-Y Growth Comparison by Extraction Method, 2025 to 2035
- Figure 113: East Asia Market Attractiveness Analysis by Extraction Method
- Figure 114: East Asia Market Value Share and BPS Analysis by Application, 2025 and 2035
- Figure 115: East Asia Market Y-o-Y Growth Comparison by Application, 2025 to 2035
- Figure 116: East Asia Market Attractiveness Analysis by Application
- Figure 117: East Asia Market Value Share and BPS Analysis by End User, 2025 and 2035
- Figure 118: East Asia Market Y-o-Y Growth Comparison by End User, 2025 to 2035
- Figure 119: East Asia Market Attractiveness Analysis by End User
- Figure 120: East Asia Market Value Share and BPS Analysis by Distribution Channel, 2025 and 2035
- Figure 121: East Asia Market Y-o-Y Growth Comparison by Distribution Channel, 2025 to 2035
- Figure 122: East Asia Market Attractiveness Analysis by Distribution Channel
- Figure 123: South Asia Market Value Share and BPS Analysis by Country, 2025 and 2035
- Figure 124: South Asia Market Value Share and BPS Analysis by Source, 2025 and 2035
- Figure 125: South Asia Market Y-o-Y Growth Comparison by Source, 2025 to 2035
- Figure 126: South Asia Market Attractiveness Analysis by Source
- Figure 127: South Asia Market Value Share and BPS Analysis by Formulation Type, 2025 and 2035
- Figure 128: South Asia Market Y-o-Y Growth Comparison by Formulation Type, 2025 to 2035
- Figure 129: South Asia Market Attractiveness Analysis by Formulation Type
- Figure 130: South Asia Market Value Share and BPS Analysis by Functionality, 2025 and 2035
- Figure 131: South Asia Market Y-o-Y Growth Comparison by Functionality, 2025 to 2035
- Figure 132: South Asia Market Attractiveness Analysis by Functionality
- Figure 133: South Asia Market Value Share and BPS Analysis by Extraction Method, 2025 and 2035
- Figure 134: South Asia Market Y-o-Y Growth Comparison by Extraction Method, 2025 to 2035
- Figure 135: South Asia Market Attractiveness Analysis by Extraction Method
- Figure 136: South Asia Market Value Share and BPS Analysis by Application, 2025 and 2035
- Figure 137: South Asia Market Y-o-Y Growth Comparison by Application, 2025 to 2035
- Figure 138: South Asia Market Attractiveness Analysis by Application
- Figure 139: South Asia Market Value Share and BPS Analysis by End User, 2025 and 2035
- Figure 140: South Asia Market Y-o-Y Growth Comparison by End User, 2025 to 2035
- Figure 141: South Asia Market Attractiveness Analysis by End User
- Figure 142: South Asia Market Value Share and BPS Analysis by Distribution Channel, 2025 and 2035
- Figure 143: South Asia Market Y-o-Y Growth Comparison by Distribution Channel, 2025 to 2035
- Figure 144: South Asia Market Attractiveness Analysis by Distribution Channel
- Figure 145: Oceania Market Value Share and BPS Analysis by Country, 2025 and 2035
- Figure 146: Oceania Market Value Share and BPS Analysis by Source, 2025 and 2035
- Figure 147: Oceania Market Y-o-Y Growth Comparison by Source, 2025 to 2035
- Figure 148: Oceania Market Attractiveness Analysis by Source
- Figure 149: Oceania Market Value Share and BPS Analysis by Formulation Type, 2025 and 2035
- Figure 150: Oceania Market Y-o-Y Growth Comparison by Formulation Type, 2025 to 2035
- Figure 151: Oceania Market Attractiveness Analysis by Formulation Type
- Figure 152: Oceania Market Value Share and BPS Analysis by Functionality, 2025 and 2035
- Figure 153: Oceania Market Y-o-Y Growth Comparison by Functionality, 2025 to 2035
- Figure 154: Oceania Market Attractiveness Analysis by Functionality
- Figure 155: Oceania Market Value Share and BPS Analysis by Extraction Method, 2025 and 2035
- Figure 156: Oceania Market Y-o-Y Growth Comparison by Extraction Method, 2025 to 2035
- Figure 157: Oceania Market Attractiveness Analysis by Extraction Method
- Figure 158: Oceania Market Value Share and BPS Analysis by Application, 2025 and 2035
- Figure 159: Oceania Market Y-o-Y Growth Comparison by Application, 2025 to 2035
- Figure 160: Oceania Market Attractiveness Analysis by Application
- Figure 161: Oceania Market Value Share and BPS Analysis by End User, 2025 and 2035
- Figure 162: Oceania Market Y-o-Y Growth Comparison by End User, 2025 to 2035
- Figure 163: Oceania Market Attractiveness Analysis by End User
- Figure 164: Oceania Market Value Share and BPS Analysis by Distribution Channel, 2025 and 2035
- Figure 165: Oceania Market Y-o-Y Growth Comparison by Distribution Channel, 2025 to 2035
- Figure 166: Oceania Market Attractiveness Analysis by Distribution Channel
- Figure 167: MEA Market Value Share and BPS Analysis by Country, 2025 and 2035
- Figure 168: MEA Market Value Share and BPS Analysis by Source, 2025 and 2035
- Figure 169: MEA Market Y-o-Y Growth Comparison by Source, 2025 to 2035
- Figure 170: MEA Market Attractiveness Analysis by Source
- Figure 171: MEA Market Value Share and BPS Analysis by Formulation Type, 2025 and 2035
- Figure 172: MEA Market Y-o-Y Growth Comparison by Formulation Type, 2025 to 2035
- Figure 173: MEA Market Attractiveness Analysis by Formulation Type
- Figure 174: MEA Market Value Share and BPS Analysis by Functionality, 2025 and 2035
- Figure 175: MEA Market Y-o-Y Growth Comparison by Functionality, 2025 to 2035
- Figure 176: MEA Market Attractiveness Analysis by Functionality
- Figure 177: MEA Market Value Share and BPS Analysis by Extraction Method, 2025 and 2035
- Figure 178: MEA Market Y-o-Y Growth Comparison by Extraction Method, 2025 to 2035
- Figure 179: MEA Market Attractiveness Analysis by Extraction Method
- Figure 180: MEA Market Value Share and BPS Analysis by Application, 2025 and 2035
- Figure 181: MEA Market Y-o-Y Growth Comparison by Application, 2025 to 2035
- Figure 182: MEA Market Attractiveness Analysis by Application
- Figure 183: MEA Market Value Share and BPS Analysis by End User, 2025 and 2035
- Figure 184: MEA Market Y-o-Y Growth Comparison by End User, 2025 to 2035
- Figure 185: MEA Market Attractiveness Analysis by End User
- Figure 186: MEA Market Value Share and BPS Analysis by Distribution Channel, 2025 and 2035
- Figure 187: MEA Market Y-o-Y Growth Comparison by Distribution Channel, 2025 to 2035
- Figure 188: MEA Market Attractiveness Analysis by Distribution Channel
- Figure 189: Global Market - Tier Structure Analysis
- Figure 190: Global Market - Company Share Analysis
- FAQs -
What was the Global MFGM Ingredients Market Size Reported by Fact.MR for 2024?
The global MFGM ingredients market was valued at USD 118.5 Million in 2024.
Who are the Major Players Operating in the MFGM Ingredients Market?
Prominent players in the market are Fonterra Co-operative Group, FrieslandCampina, Arla Foods Ingredients Group, Glanbia plc, among others.
What is the Estimated Valuation of the MFGM Ingredients Market in 2035?
The market is expected to reach a valuation of USD 345 Million in 2035.
What Value CAGR did the MFGM Ingredients Market Exhibit Over the Last Five Years?
The historic growth rate of the MFGM ingredients market was 9.3% from 2020 to 2024.