Europe Foam Densifier Market (2026 - 2036)
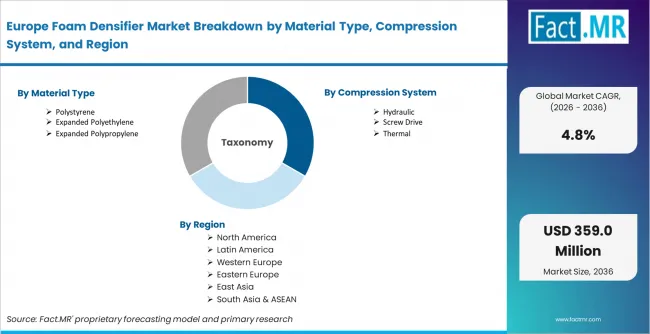
The Europe Foam Densifier Market is segmented by Material Type (Polystyrene, Expanded Polyethylene, Expanded Polypropylene, Expanded Polyisocyanurate, Polyurethane, and Others), Compression System (Hydraulic, Screw Drive, Thermal, and Hybrid), Capacity (<50 Kg/h, 50 Kg/h-100 Kg/h, 100 Kg/h-200 Kg/h, 300 Kg/h-400 Kg/h, and Above 400 Kg/h), End User (Recycling Facilities, Packaging Manufacturers, Waste Management Companies, and Industrial Processing Units), and Mobility Type (Stationary Foam Densifiers, Portable Foam Densifiers, and Trailer-mounted Foam Densifiers) and Region. Forecast for 2026 to 2036.
Fact.MR opines that the Europe foam densifier market is moving through a major upgrade phase. EU foam recovery regulations are increasing pressure on recycling facilities and packaging manufacturers. Many operators are replacing low-capacity compactors with hydraulic and screw-drive densifiers that handle larger foam waste volumes more efficiently.
Europe Foam Densifier Market Forecast and Outlook By Fact.MR
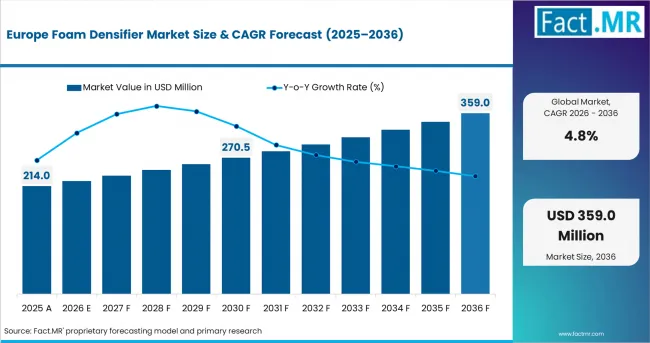
- In 2025, the Europe foam densifier market stood at USD 214 million.
- According to Fact.MR analysis, the market is expected to reach USD 225 million in 2026 and nearly USD 359 million by 2036.
- The industry is forecast to expand at 4.8% CAGR during the assessment period.
| Metric | Value |
|---|---|
| Estimated Value in 2026 | USD 225 million |
| Forecast Value in 2036 | USD 359 million |
| Forecast CAGR (2026 to 2036) | 4.8% |
Summary of Europe Foam Densifier Market
- Demand Drivers
- Recycling facilities and waste management companies in Germany and France are increasing foam densifier investment. Stricter foam recovery rules are raising disposal costs for untreated foam waste.
- Packaging manufacturers across Europe are installing hydraulic and screw-drive densifiers. Companies want to process foam waste directly at production sites and lower transport costs.
- Industrial facilities are upgrading toward higher-capacity densifiers. Foam waste volumes are rising beyond the handling limits of older low-capacity systems.
- Key Segments Analyzed
- By Material Type: Polystyrene market holds 38% share in 2026. Packaging and food service industries generate large foam waste volumes across European recycling facilities.
- By Compression System: Hydraulic densifiers account for 45% share in 2026. Operators prefer stronger compression performance for large-scale foam processing.
- By Capacity: The 100 Kg/h to 200 Kg/h range holds 35% share in 2026. Mid-sized recycling facilities prefer balanced throughput without very high equipment cost.
- By End User: Recycling facilities hold 50% share in 2026. Centralized foam waste collection increasing across Europe.
- By Mobility Type: Stationary foam densifiers account for 55% share in 2026. High-throughput recycling sites require continuous processing operations.
- By Geography: Germany is projected to grow at 5.1% CAGR through 2036. Foam recovery regulations are increasing densifier investment across recycling networks.
- Analyst Opinion at Fact.MR
- Shambhu Nath Jha, Principal Consultant at Fact.MR, opines, ' CXOs will see rising pressure from EU foam recovery targets across recycling and packaging operations. Recycling facilities and packaging manufacturers are accelerating investment in higher-capacity densifiers.’
- Strategic Implications
- Foam densifier manufacturers should focus on Germany and France. Recycling facilities and packaging manufacturers are investing in new equipment as recovery rules become stricter.
- Companies should offer more hydraulic and screw-drive systems in the 100 Kg/h to 200 Kg/h range. Mid-sized recycling operators need affordable equipment with enough processing capacity .
- Manufacturers should expand trailer-mounted and portable densifier product lines. Waste management companies need flexible systems for foam waste collection across different locations.
Around USD 134 million in additional revenue opportunity is expected to enter the market by 2036. Stricter foam recycling regulations across Europe are increasing demand for advanced densification systems. Packaging companies and recycling operators are using higher-capacity systems to cut waste handling costs and recover more material. Smaller recycling facilities facing investment challenges while replacing older processing systems.
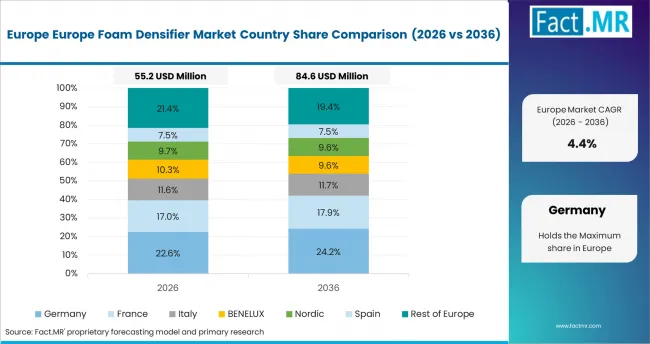
Germany is expected to lead market with 5.1% CAGR by 2036 as recycling operators are adding more EPS and EPP processing capacity as packaging waste rules require better foam recovery. France is likely to witness 4.9% CAGR as packaging waste reforms raise foam densifier demand across licensed waste collection and recycling facilities. The United Kingdom is anticipated to expand at 4.8% CAGR as packaging recovery operators invest in densifiers to handle rising foam waste volumes more efficiently. Italy is projected to record 4.5% CAGR as EPS recovery targets support higher processing capacity across regional recycling networks. Spain is expected to grow at 4.4% CAGR through 2036 as municipal transfer stations and recycling facilities adopt higher-output foam densifiers to manage rising foam waste volumes.
Segmental Analysis
Europe Foam Densifier Market Analysis by Material Type
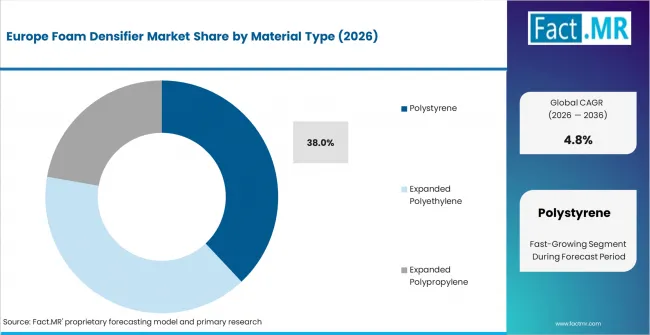
Polystyrene accounts for 38% share in 2026 because EPS remains the leading foam waste stream across European recycling networks. Food packaging and protective packaging applications generating high EPS waste volumes across commercial and industrial sectors.
- EPS Densification Demand: Recycling facilities are increasing investment in EPS densification systems to improve foam recovery efficiency and secondary material value.
- EPP and EPE Processing Growth: Demand for densifiers compatible with multiple foam materials is increasing across industrial packaging operations.
- BEWI RAW–Unipol merger strengthens EPS recycling ecosystem: BEWI RAW and Unipol merged to create one of Europe’s largest EPS raw material platforms, supporting circular foam and densification-linked recycling value chains. [1]
Europe Foam Densifier Market Analysis by Compression System
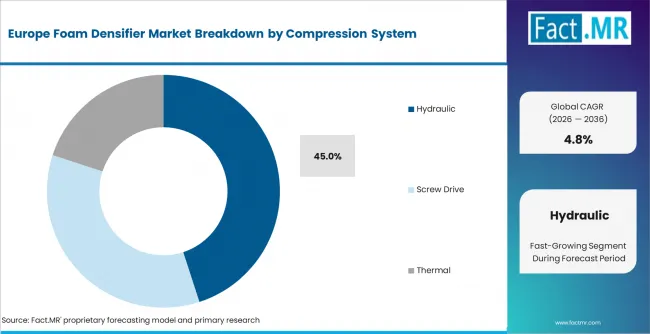
Hydraulic densifiers represent 45% share in 2026 as stronger compression force and stable performance use in high-volume recycling operations. Large recycling facilities preferring hydraulic systems for continuous foam processing activity.
- Screw-drive System Expansion: Screw-drive densifiers are gaining adoption across packaging production sites due to lower maintenance requirements and quieter operation.
- Thermal Densifier Development: Food packaging and logistics facilities are increasing adoption of thermal densifiers for controlled foam waste processing.
- Hybrid System Emergence: Hybrid densifier systems are gaining interest across facilities processing mixed foam waste streams with varying material density.
Europe Foam Densifier Market Analysis by Capacity
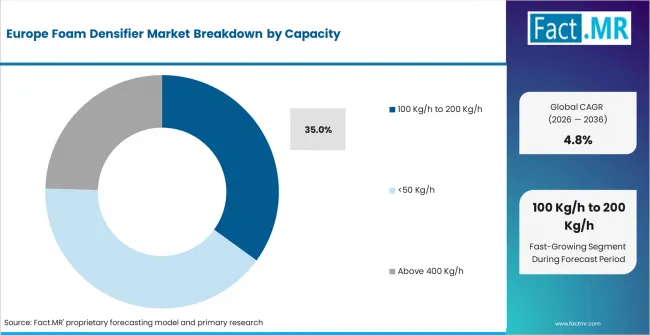
The 100 Kg/h to 200 Kg/h range contributes 35% share in 2026 because it matches the processing requirements of mid-sized recycling facilities and packaging operators. The segment offers enough processing capacity at a lower cost than large industrial systems.
- Low-capacity Segment Stability: Smaller densifiers seeing demand across retail and small commercial locations handling moderate foam waste volumes.
- High-capacity Industrial Demand: Large recycling hubs are increasing investment in above-400 Kg/h systems to manage regional foam collection networks.
- Borealis is investing over €100 million in its Burghausen, Germany site: The project will triple production capacity for Daploy™ HMS PP recyclable foam materials. The material is used in automotive, packaging, and construction applications. [2]
Europe Foam Densifier Market Analysis by End User
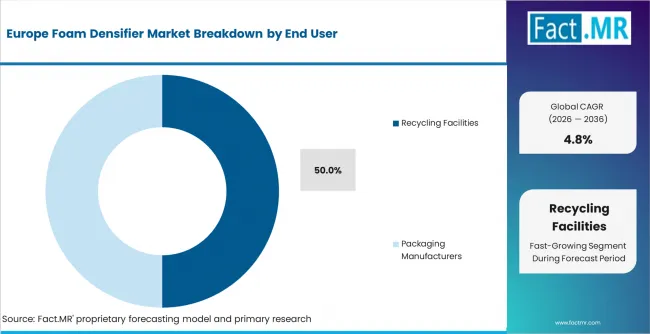
Recycling facilities generate 50% share in 2026 as centralized foam processing operations require higher densification capacity and continuous equipment usage. Large recycling sites remain the leading equipment spending centers across the market.
- Packaging Manufacturer Investment: Packaging companies are increasing on-site foam densification to process production waste and lower disposal expenses.
- Waste Management Fleet Growth: Waste collection companies are expanding portable and trailer-mounted densifier fleets across multiple collection routes.
- BEWI RAW shapes future of EPS in Europe: BEWI RAW has merged with Unipol to strengthen its position as a leading EPS raw material supplier in Europe. The company operates multiple production sites with large-scale annual capacity. It focuses on recycled content EPS and circular economy solutions. [3]
Europe Foam Densifier Market Analysis by Mobility Type
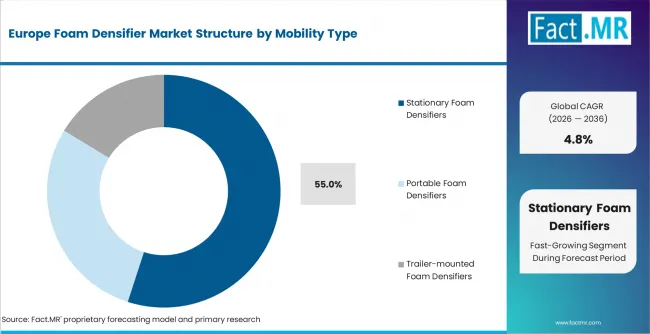
Stationary foam densifiers capture 55% share in 2026 as large recycling operations require continuous processing performance and stable installation infrastructure. Permanent systems remain the preferred choice for high-volume facilities.
- Portable Densifier Adoption: Commercial facilities and logistics operators are increasing portable densifier usage for moderate foam waste volumes.
- Trailer-mounted System Growth: Waste management companies are expanding trailer-mounted densifier deployment across distributed collection networks.
- Foamit Group doubles foam glass capacity at Onsøy plant: Foamit Group has invested around €10 million to expand its Onsøy plant in Norway, doubling its foam glass manufacturing capacity to about 280,000 m³ per year. [4]
Drivers, Restraints, and Opportunities
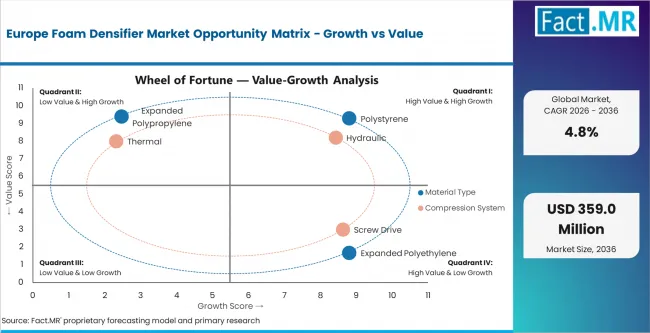
Europe foam densifier market is moving beyond a small recycling equipment category. Foam recovery regulations across Europe are increasing investment in densification infrastructure at recycling facilities and packaging manufacturing sites. Operators are accelerating equipment upgrades as compliance timelines become stricter across major European markets.
Low-capacity compactors are gradually losing share across medium and large recycling facilities. Hydraulic and screw-drive densifiers with higher throughput are becoming the preferred choice for EPS and EPP foam waste processing. Higher equipment prices are being balanced by lower transportation costs and improved recycling efficiency for densified foam blocks.
- Foam Recovery Compliance Growth: Recycling operators across Europe are increasing densifier investment to meet stricter foam recovery and recycling targets.
- EPS Recycling Expansion: Packaging manufacturers and recycling facilities are expanding EPS processing capacity as foam packaging waste volumes increasing.
- Foam densifier role in Europe EPE/EPS recycling: The European foam recycling sector is increasingly adopting foam densifiers to solve the core challenge of EPS and EPE waste, which is extremely bulky and mostly air. Foam densifiers compress and melt foam waste into dense blocks or ingots, reducing volume by up to 90:1 and making transport and recycling economically viable. [3]
Regional Analysis
The Europe foam densifier market is assessed across Western Europe covering Germany, France, the United Kingdom, Spain, and Italy along with BENELUX, Nordic Countries, and Rest of Europe, segmented by foam recycling infrastructure maturity, packaging waste regulation timelines, recycling facility investment activity, and end-user equipment penetration levels. The full report offers market attractiveness analysis by country and sub-region.
.webp)
| Country | CAGR (2026 to 2036) |
|---|---|
| Germany | 5.1% |
| France | 4.9% |
| United Kingdom | 4.8% |
| Italy | 4.5% |
| Spain | 4.4% |
Source: Fact.MR analysis, based on proprietary forecasting model and primary research
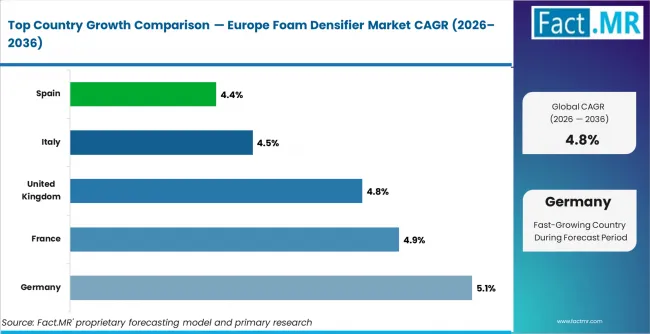
Europe Foam Densifier Market Analysis

Europe leads foam densifier adoption due to strong recycling policies and expanding foam recovery infrastructure. Packaging manufacturers and recycling operators are increasing investment in densification systems as foam waste collection volumes rising across the region.
- Germany: Recycling modernization programs are supporting 5.1% CAGR through 2036 in Germany. Large recycling facilities are replacing older compactors with higher-capacity densifiers to improve EPS and EPP recovery efficiency. Demand remains strongest across industrial and dual-system recycling operations. Municipal recycling centers are also increasing hydraulic densifier deployment to manage growing foam packaging waste volumes across urban collection networks.
- France: Foam densifier demand in France is expected to rise at 4.9% CAGR through 2036. Commercial waste operators are investing in screw-drive and portable systems to handle rising packaging foam waste across collection networks. Mid-capacity densifiers are gaining use in regional recycling facilities because they offer enough output at a manageable cost. Food packaging and retail distribution companies are also processing more foam waste on-site.
- United Kingdom: Stronger packaging recovery efforts are pushing the United Kingdom market toward 4.8% CAGR through 2036. Packaging manufacturers are increasing on-site foam processing capacity to lower disposal costs and improve recycling performance. Portable densifier systems are also becoming more common in logistics and retail waste operations. Recycling companies are focusing more on flexible densification equipment across distributed collection routes.
- Italy: Northern industrial regions are driving Italy toward 4.5% CAGR through 2036. Recycling facilities and packaging operators are adding more densification capacity as manufacturing and logistics companies generate more foam waste. Hydraulic systems are gaining wider adoption across larger recycling sites. Industrial packaging waste from automotive and appliance manufacturing is also supporting higher densifier demand.
- Spain: Spain is forecast to expand at 4.4% CAGR through 2036. Municipal recycling operators are increasing investment in foam processing equipment as urban packaging waste volumes and sustainable packaging adoption continue growing. Stationary densifiers are becoming more common across regional transfer stations and sorting facilities. Mid-range systems are also witnessing stronger demand across municipal waste collection infrastructure upgrades.
Fact.MR's Europe foam densifier market analysis covers Germany, France, the United Kingdom, Italy, Spain, BENELUX, Nordic Countries, and the rest of Europe. Readers can find country-level recycling investment trends, foam recovery infrastructure analysis, and densifier demand benchmarks across compression systems and end-user segments.
Competitive Aligners for Market Players
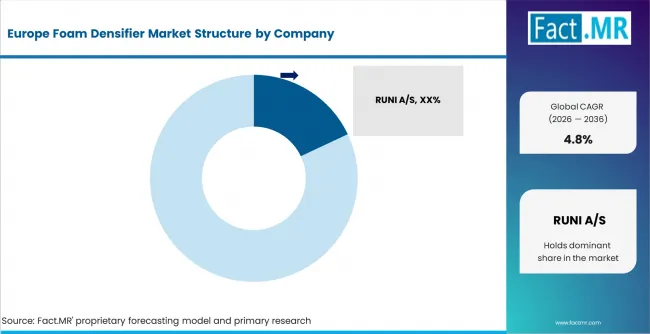
Competition in the Europe foam densifier market is now centered on processing capacity and compliance. Recycling operators need hydraulic and screw-drive systems that recover more foam from high-volume collection networks. Equipment suppliers with reliable installation support and quick maintenance can win long-term recycling contracts.
Mid-capacity densifiers are seeing demand across Germany, France and the United Kingdom. Recycling facilities prefer systems that offer good output at manageable operating cost. Portable and trailer-mounted densifiers are useful for waste collection companies that handle foam waste across several urban and industrial routes.
Packaging manufacturers are becoming important for densifier suppliers. Many companies are investing in on-site foam processing to cut transport costs and meet recycling rules. Compact design and easy operation are important selection factors across production facilities and logistics centers. Manufacturers with hydraulic technology and multi-material foam processing can compete better across regional recycling markets. Service support and equipment reliability are important because recycling operators need continuous processing with lower downtime risk. Germany and France offer the best commercial opportunity as foam recovery investment and recycling infrastructure upgrades increase.
Key Players
- RUNI A/S
- Heger GmbH
- KBM ApS
- INTCO Recycling
- Comitec
Bibliography
- [1] BEWI. (2025, September 2). Not just another EPS supplier. BEWI RAW is shaping the future.
- [2] Borealis. (2025, June 4). Borealis invests over €100 million to triple production of recyclable foam innovation in Burghausen, Germany.
- [3] BEWI Invest. (2025, February 6). Merger to create leading EPS raw material company, facilitating growth of downstream business.
- [4] Foamit Group. (2024). Foamit Group doubles its foam glass manufacturing capacity at the Onsøy plant.
- [5] Greenmax Recycling. (2024). The current situation of EPE foam recycling in Europe and the feasibility of using foam densifier.
This Report Addresses
- Strategic intelligence on Europe foam densifier demand across material type, compression system, capacity, end user, and mobility type segments.
- Market forecast from USD 225 million in 2026 to USD 359 million by 2036 at 4.8% CAGR. The market creates USD 134 million absolute dollar opportunity during the forecast period.
- Growth opportunity analysis across Germany, France, the United Kingdom, Italy, and Spain linked to EU PPWR foam recovery compliance and densifier fleet replacement cycles.
- Segment analysis with country-level CAGR forecasts and leading segment share benchmarks for 2026.
- Regional outlook covering EU PPWR enforcement timelines, VerpackG Phase 3 quota impacts, UK EPR activation effects, and foam densifier infrastructure investment across European recycling networks.
- Competitive analysis of RUNI A/S, INTCO Recycling, Recycling Equipment Corporation, RUNI A/S, Demand Products Inc., Comitec, VITA RECYCLES, and Wedo Machinery.
- Regulatory analysis covering EU Packaging and Packaging Waste Regulation 2025 foam recovery requirements, German Verpackungsgesetz Phase 3 obligations, and UK Extended Producer Responsibility for Packaging fee structures.
- Report delivery in PDF and Excel formats supported by recycling facility investment benchmarks, densifier installation data, and interviews with foam recycling operations managers and waste management equipment distributors.
Europe Foam Densifier Market Definition
The Europe foam densifier market covers industrial equipment that compresses expanded foam materials including polystyrene, polyethylene, and polyurethane into dense blocks or logs for efficient transport and downstream recycling. These systems are deployed at recycling facilities, packaging manufacturer sites, and waste management operations to reduce foam volume and lower disposal costs.
Europe Foam Densifier Market Inclusions
The study covers European market forecasts from 2026 to 2036 across material type, compression system, capacity, end user, and mobility type segments. It includes hydraulic, screw-drive, thermal, and hybrid foam densifiers deployed at recycling facilities, packaging manufacturers, waste management companies, and industrial processing units across Western and Eastern Europe.
Europe Foam Densifier Market Exclusions
The study excludes general waste compactors and balers not specifically designed for foam material densification. It omits foam shredders, granulators, and dissolution equipment used in chemical recycling outside mechanical densification processes. Densifier spare parts and replacement components sold independently of complete equipment units fall outside study scope.
Europe Foam Densifier Market Research Methodology
- Primary Research
- Primary research includes interviews with operations managers at recycling facilities and packaging manufacturer waste sites across Germany and France. Equipment purchase decision-makers at waste management companies and industrial processing units across Italy and Spain are covered separately.
- Desk Research
- Desk research uses public disclosures from RUNI A/S, INTCO Recycling, and Recycling Equipment Corporation. It includes EU Packaging and Packaging Waste Regulation enforcement documentation, Eurostat packaging waste data from 2024, and national waste infrastructure investment program reports covering 2024 and 2025.
- Market-Sizing and Forecasting
- Market sizing applies a hybrid top-down and bottom-up model. Foam densifier unit sales benchmarks and recycling facility foam waste throughput data by country form the base inputs. Segment forecasts are built separately for compression system tiers across end-user and capacity categories.
- Data Validation and Update Cycle
- Data validation uses recycling facility capital expenditure disclosures and densifier unit installation benchmarks cross-checked against 2024 and 2025 Eurostat packaging waste infrastructure statistics. Findings are validated through interviews with foam recycling facility managers and densifier equipment distributors.
Scope of the Report

| Attribute | Details |
|---|---|
| Quantitative Units | USD 225 million (2026) to USD 359 million (2036), at a CAGR of 4.8% |
| Market Definition | Mechanical and thermal foam compression equipment deployed at recycling facilities, packaging manufacturer sites, and waste management operations to reduce expanded foam material volume and prepare densified blocks for secondary processing across European markets. |
| Material Type Segmentation | Polystyrene, Expanded Polyethylene, Expanded Polypropylene, Expanded Polyisocyanurate, Polyurethane, Others |
| Compression System Segmentation | Hydraulic, Screw Drive, Thermal, Hybrid |
| Capacity Segmentation | <50 Kg/h, 50 Kg/h–100 Kg/h, 100 Kg/h–200 Kg/h, 300 Kg/h–400 Kg/h, Above 400 Kg/h |
| End User Segmentation | Recycling Facilities, Packaging Manufacturers, Waste Management Companies, Industrial Processing Units |
| Mobility Type Segmentation | Stationary Foam Densifiers, Portable Foam Densifiers, Trailer-mounted Foam Densifiers |
| Regions Covered | Western Europe, Eastern Europe |
| Countries Covered | Germany, France, United Kingdom, Italy, Spain, BENELUX, Nordic Countries, Portugal, and Rest of Europe |
| Key Companies Profiled | RUNI A/S, Heger GmbH, Demand Products Inc., INTCO Recycling, Comitec, Recycling Equipment Corporation, RUNI A/S, VITA RECYCLES, Wedo Machinery |
| Forecast Period | 2026 to 2036 |
| Approach | Hybrid top-down and bottom-up model using Eurostat packaging waste data, foam densifier unit sales benchmarks, EU PPWR compliance program investment disclosures, and primary interviews with recycling facility operations managers and packaging manufacturer waste equipment specifiers. |
Europe Foam Densifier Market by Segments
-
By Material Type
- Polystyrene
- Expanded Polyethylene
- Expanded Polypropylene
- Expanded Polyisocyanurate
- Polyurethane
- Others
-
By Compression System
- Hydraulic
- Screw Drive
- Thermal
- Hybrid
-
By Capacity
- <50 Kg/h
- 50 Kg/h–100 Kg/h
- 100 Kg/h–200 Kg/h
- 300 Kg/h–400 Kg/h
- Above 400 Kg/h
-
By End User
- Recycling Facilities
- Packaging Manufacturers
- Waste Management Companies
- Industrial Processing Units
-
By Mobility Type
- Stationary Foam Densifiers
- Portable Foam Densifiers
- Trailer-mounted Foam Densifiers
-
By Region
- Western Europe
- Germany
- France
- United Kingdom
- Italy
- Spain
- BENELUX
- Nordic Countries
- Portugal
- Rest of Western Europe
- Eastern Europe
- Poland
- Hungary
- Romania
- Balkan and Baltic
- Rest of Eastern Europe
- Frequently Asked Questions -
How large is the Europe foam densifier market in 2025?
The Europe foam densifier market was valued at USD 214 million in 2025.
What will the Europe foam densifier market size be in 2026?
Based on Fact.MR analysis, demand for foam densifiers is estimated to grow to USD 225 million in 2026.
What is the projected Europe foam densifier market size by 2036?
The Europe foam densifier market is projected to reach USD 359 million by 2036, generating USD 134 million in absolute dollar opportunity over the forecast period.
What is the expected CAGR for the Europe foam densifier market from 2026 to 2036?
Fact.MR projects a CAGR of 4.8% for the Europe foam densifier market during the 2026 to 2036 forecast period.
Which compression system segment leads the Europe foam densifier market?
Hydraulic densifiers lead with 45% share in 2026 due to their high compression force output that enables continuous large-batch foam processing at recycling facilities handling mixed EPS and EPP waste streams.
Which end user holds the largest share in the Europe foam densifier market?
Recycling facilities account for 50% share in 2026 as centralized foam waste processing operations generate the highest per-site equipment investment across the market through EU PPWR compliance-driven densifier purchases.
Which country shows the fastest growth in the Europe foam densifier market?
Germany leads at 5.1% CAGR through 2036 as VerpackG Phase 3 foam recovery quotas raise certified densification throughput requirements at approximately 1,400 licensed dual-system recycling facilities across the country.
Table of Content
- Executive Summary
- Global Market Outlook
- Demand to side Trends
- Supply to side Trends
- Technology Roadmap Analysis
- Analysis and Recommendations
- Market Overview
- Market Coverage / Taxonomy
- Market Definition / Scope / Limitations
- Research Methodology
- Chapter Orientation
- Analytical Lens and Working Hypotheses
- Market Structure, Signals, and Trend Drivers
- Benchmarking and Cross-market Comparability
- Market Sizing, Forecasting, and Opportunity Mapping
- Research Design and Evidence Framework
- Desk Research Programme (Secondary Evidence)
- Company Annual and Sustainability Reports
- Peer-reviewed Journals and Academic Literature
- Corporate Websites, Product Literature, and Technical Notes
- Earnings Decks and Investor Briefings
- Statutory Filings and Regulatory Disclosures
- Technical White Papers and Standards Notes
- Trade Journals, Industry Magazines, and Analyst Briefs
- Conference Proceedings, Webinars, and Seminar Materials
- Government Statistics Portals and Public Data Releases
- Press Releases and Reputable Media Coverage
- Specialist Newsletters and Curated Briefings
- Sector Databases and Reference Repositories
- Fact.MR Internal Proprietary Databases and Historical Market Datasets
- Subscription Datasets and Paid Sources
- Social Channels, Communities, and Digital Listening Inputs
- Additional Desk Sources
- Expert Input and Fieldwork (Primary Evidence)
- Primary Modes
- Qualitative Interviews and Expert Elicitation
- Quantitative Surveys and Structured Data Capture
- Blended Approach
- Why Primary Evidence is Used
- Field Techniques
- Interviews
- Surveys
- Focus Groups
- Observational and In-context Research
- Social and Community Interactions
- Stakeholder Universe Engaged
- C-suite Leaders
- Board Members
- Presidents and Vice Presidents
- R&D and Innovation Heads
- Technical Specialists
- Domain Subject-matter Experts
- Scientists
- Physicians and Other Healthcare Professionals
- Governance, Ethics, and Data Stewardship
- Research Ethics
- Data Integrity and Handling
- Primary Modes
- Tooling, Models, and Reference Databases
- Desk Research Programme (Secondary Evidence)
- Data Engineering and Model Build
- Data Acquisition and Ingestion
- Cleaning, Normalisation, and Verification
- Synthesis, Triangulation, and Analysis
- Quality Assurance and Audit Trail
- Market Background
- Market Dynamics
- Drivers
- Restraints
- Opportunity
- Trends
- Scenario Forecast
- Demand in Optimistic Scenario
- Demand in Likely Scenario
- Demand in Conservative Scenario
- Opportunity Map Analysis
- Product Life Cycle Analysis
- Supply Chain Analysis
- Investment Feasibility Matrix
- Value Chain Analysis
- PESTLE and Porter’s Analysis
- Regulatory Landscape
- Regional Parent Market Outlook
- Production and Consumption Statistics
- Import and Export Statistics
- Market Dynamics
- Global Market Analysis 2021 to 2025 and Forecast, 2026 to 2036
- Historical Market Size Value (USD Million) Analysis, 2021 to 2025
- Current and Future Market Size Value (USD Million) Projections, 2026 to 2036
- Y to o to Y Growth Trend Analysis
- Absolute $ Opportunity Analysis
- Global Market Pricing Analysis 2021 to 2025 and Forecast 2026 to 2036
- Global Market Analysis 2021 to 2025 and Forecast 2026 to 2036, By Type
- Introduction / Key Findings
- Historical Market Size Value (USD Million) Analysis By Type , 2021 to 2025
- Current and Future Market Size Value (USD Million) Analysis and Forecast By Type , 2026 to 2036
- Boscalid
- Fluopyram
- Penthiopyrad
- Fluxapyroxad
- Isofetamid
- Other Types
- Boscalid
- Y to o to Y Growth Trend Analysis By Type , 2021 to 2025
- Absolute $ Opportunity Analysis By Type , 2026 to 2036
- Global Market Analysis 2021 to 2025 and Forecast 2026 to 2036, By Application
- Introduction / Key Findings
- Historical Market Size Value (USD Million) Analysis By Application, 2021 to 2025
- Current and Future Market Size Value (USD Million) Analysis and Forecast By Application, 2026 to 2036
- Grains & Cereals
- Oilseed
- Fruits & Vegetables
- Turf & Ornamentals
- Commercial Crops
- Grains & Cereals
- Y to o to Y Growth Trend Analysis By Application, 2021 to 2025
- Absolute $ Opportunity Analysis By Application, 2026 to 2036
- Global Market Analysis 2021 to 2025 and Forecast 2026 to 2036, By Formulation
- Introduction / Key Findings
- Historical Market Size Value (USD Million) Analysis By Formulation, 2021 to 2025
- Current and Future Market Size Value (USD Million) Analysis and Forecast By Formulation, 2026 to 2036
- Suspension Concentrates
- Emulsifiable Concentrates
- Water-Dispersible Granules
- Seed Treatment Formulations
- Suspension Concentrates
- Y to o to Y Growth Trend Analysis By Formulation, 2021 to 2025
- Absolute $ Opportunity Analysis By Formulation, 2026 to 2036
- Global Market Analysis 2021 to 2025 and Forecast 2026 to 2036, By Treatment Mode
- Introduction / Key Findings
- Historical Market Size Value (USD Million) Analysis By Treatment Mode, 2021 to 2025
- Current and Future Market Size Value (USD Million) Analysis and Forecast By Treatment Mode, 2026 to 2036
- Foliar Spray
- Seed Treatment
- Soil Treatment
- Foliar Spray
- Y to o to Y Growth Trend Analysis By Treatment Mode, 2021 to 2025
- Absolute $ Opportunity Analysis By Treatment Mode, 2026 to 2036
- Global Market Analysis 2021 to 2025 and Forecast 2026 to 2036, By Sales Channel
- Introduction / Key Findings
- Historical Market Size Value (USD Million) Analysis By Sales Channel, 2021 to 2025
- Current and Future Market Size Value (USD Million) Analysis and Forecast By Sales Channel, 2026 to 2036
- Distributor Supply
- Cooperative Retail
- Direct Supplier Contracts
- Distributor Supply
- Y to o to Y Growth Trend Analysis By Sales Channel, 2021 to 2025
- Absolute $ Opportunity Analysis By Sales Channel, 2026 to 2036
- Global Market Analysis 2021 to 2025 and Forecast 2026 to 2036, By Region
- Introduction
- Historical Market Size Value (USD Million) Analysis By Region, 2021 to 2025
- Current Market Size Value (USD Million) Analysis and Forecast By Region, 2026 to 2036
- North America
- Latin America
- Western Europe
- Eastern Europe
- East Asia
- South Asia and Pacific
- Middle East & Africa
- Market Attractiveness Analysis By Region
- North America Market Analysis 2021 to 2025 and Forecast 2026 to 2036, By Country
- Historical Market Size Value (USD Million) Trend Analysis By Market Taxonomy, 2021 to 2025
- Market Size Value (USD Million) Forecast By Market Taxonomy, 2026 to 2036
- By Country
- USA
- Canada
- Mexico
- By Type
- By Application
- By Formulation
- By Treatment Mode
- By Sales Channel
- By Country
- Market Attractiveness Analysis
- By Country
- By Type
- By Application
- By Formulation
- By Treatment Mode
- By Sales Channel
- Key Takeaways
- Latin America Market Analysis 2021 to 2025 and Forecast 2026 to 2036, By Country
- Historical Market Size Value (USD Million) Trend Analysis By Market Taxonomy, 2021 to 2025
- Market Size Value (USD Million) Forecast By Market Taxonomy, 2026 to 2036
- By Country
- Brazil
- Chile
- Rest of Latin America
- By Type
- By Application
- By Formulation
- By Treatment Mode
- By Sales Channel
- By Country
- Market Attractiveness Analysis
- By Country
- By Type
- By Application
- By Formulation
- By Treatment Mode
- By Sales Channel
- Key Takeaways
- Western Europe Market Analysis 2021 to 2025 and Forecast 2026 to 2036, By Country
- Historical Market Size Value (USD Million) Trend Analysis By Market Taxonomy, 2021 to 2025
- Market Size Value (USD Million) Forecast By Market Taxonomy, 2026 to 2036
- By Country
- Germany
- UK
- Italy
- Spain
- France
- Nordic
- BENELUX
- Rest of Western Europe
- By Type
- By Application
- By Formulation
- By Treatment Mode
- By Sales Channel
- By Country
- Market Attractiveness Analysis
- By Country
- By Type
- By Application
- By Formulation
- By Treatment Mode
- By Sales Channel
- Key Takeaways
- Eastern Europe Market Analysis 2021 to 2025 and Forecast 2026 to 2036, By Country
- Historical Market Size Value (USD Million) Trend Analysis By Market Taxonomy, 2021 to 2025
- Market Size Value (USD Million) Forecast By Market Taxonomy, 2026 to 2036
- By Country
- Russia
- Poland
- Hungary
- Balkan & Baltic
- Rest of Eastern Europe
- By Type
- By Application
- By Formulation
- By Treatment Mode
- By Sales Channel
- By Country
- Market Attractiveness Analysis
- By Country
- By Type
- By Application
- By Formulation
- By Treatment Mode
- By Sales Channel
- Key Takeaways
- East Asia Market Analysis 2021 to 2025 and Forecast 2026 to 2036, By Country
- Historical Market Size Value (USD Million) Trend Analysis By Market Taxonomy, 2021 to 2025
- Market Size Value (USD Million) Forecast By Market Taxonomy, 2026 to 2036
- By Country
- China
- Japan
- South Korea
- By Type
- By Application
- By Formulation
- By Treatment Mode
- By Sales Channel
- By Country
- Market Attractiveness Analysis
- By Country
- By Type
- By Application
- By Formulation
- By Treatment Mode
- By Sales Channel
- Key Takeaways
- South Asia and Pacific Market Analysis 2021 to 2025 and Forecast 2026 to 2036, By Country
- Historical Market Size Value (USD Million) Trend Analysis By Market Taxonomy, 2021 to 2025
- Market Size Value (USD Million) Forecast By Market Taxonomy, 2026 to 2036
- By Country
- India
- ASEAN
- Australia & New Zealand
- Rest of South Asia and Pacific
- By Type
- By Application
- By Formulation
- By Treatment Mode
- By Sales Channel
- By Country
- Market Attractiveness Analysis
- By Country
- By Type
- By Application
- By Formulation
- By Treatment Mode
- By Sales Channel
- Key Takeaways
- Middle East & Africa Market Analysis 2021 to 2025 and Forecast 2026 to 2036, By Country
- Historical Market Size Value (USD Million) Trend Analysis By Market Taxonomy, 2021 to 2025
- Market Size Value (USD Million) Forecast By Market Taxonomy, 2026 to 2036
- By Country
- Kingdom of Saudi Arabia
- Other GCC Countries
- Turkiye
- South Africa
- Other African Union
- Rest of Middle East & Africa
- By Type
- By Application
- By Formulation
- By Treatment Mode
- By Sales Channel
- By Country
- Market Attractiveness Analysis
- By Country
- By Type
- By Application
- By Formulation
- By Treatment Mode
- By Sales Channel
- Key Takeaways
- Key Countries Market Analysis
- USA
- Pricing Analysis
- Market Share Analysis, 2025
- By Type
- By Application
- By Formulation
- By Treatment Mode
- By Sales Channel
- Canada
- Pricing Analysis
- Market Share Analysis, 2025
- By Type
- By Application
- By Formulation
- By Treatment Mode
- By Sales Channel
- Mexico
- Pricing Analysis
- Market Share Analysis, 2025
- By Type
- By Application
- By Formulation
- By Treatment Mode
- By Sales Channel
- Brazil
- Pricing Analysis
- Market Share Analysis, 2025
- By Type
- By Application
- By Formulation
- By Treatment Mode
- By Sales Channel
- Chile
- Pricing Analysis
- Market Share Analysis, 2025
- By Type
- By Application
- By Formulation
- By Treatment Mode
- By Sales Channel
- Germany
- Pricing Analysis
- Market Share Analysis, 2025
- By Type
- By Application
- By Formulation
- By Treatment Mode
- By Sales Channel
- UK
- Pricing Analysis
- Market Share Analysis, 2025
- By Type
- By Application
- By Formulation
- By Treatment Mode
- By Sales Channel
- Italy
- Pricing Analysis
- Market Share Analysis, 2025
- By Type
- By Application
- By Formulation
- By Treatment Mode
- By Sales Channel
- Spain
- Pricing Analysis
- Market Share Analysis, 2025
- By Type
- By Application
- By Formulation
- By Treatment Mode
- By Sales Channel
- France
- Pricing Analysis
- Market Share Analysis, 2025
- By Type
- By Application
- By Formulation
- By Treatment Mode
- By Sales Channel
- India
- Pricing Analysis
- Market Share Analysis, 2025
- By Type
- By Application
- By Formulation
- By Treatment Mode
- By Sales Channel
- ASEAN
- Pricing Analysis
- Market Share Analysis, 2025
- By Type
- By Application
- By Formulation
- By Treatment Mode
- By Sales Channel
- Australia & New Zealand
- Pricing Analysis
- Market Share Analysis, 2025
- By Type
- By Application
- By Formulation
- By Treatment Mode
- By Sales Channel
- China
- Pricing Analysis
- Market Share Analysis, 2025
- By Type
- By Application
- By Formulation
- By Treatment Mode
- By Sales Channel
- Japan
- Pricing Analysis
- Market Share Analysis, 2025
- By Type
- By Application
- By Formulation
- By Treatment Mode
- By Sales Channel
- South Korea
- Pricing Analysis
- Market Share Analysis, 2025
- By Type
- By Application
- By Formulation
- By Treatment Mode
- By Sales Channel
- Russia
- Pricing Analysis
- Market Share Analysis, 2025
- By Type
- By Application
- By Formulation
- By Treatment Mode
- By Sales Channel
- Poland
- Pricing Analysis
- Market Share Analysis, 2025
- By Type
- By Application
- By Formulation
- By Treatment Mode
- By Sales Channel
- Hungary
- Pricing Analysis
- Market Share Analysis, 2025
- By Type
- By Application
- By Formulation
- By Treatment Mode
- By Sales Channel
- Kingdom of Saudi Arabia
- Pricing Analysis
- Market Share Analysis, 2025
- By Type
- By Application
- By Formulation
- By Treatment Mode
- By Sales Channel
- Turkiye
- Pricing Analysis
- Market Share Analysis, 2025
- By Type
- By Application
- By Formulation
- By Treatment Mode
- By Sales Channel
- South Africa
- Pricing Analysis
- Market Share Analysis, 2025
- By Type
- By Application
- By Formulation
- By Treatment Mode
- By Sales Channel
- USA
- Market Structure Analysis
- Competition Dashboard
- Competition Benchmarking
- Market Share Analysis of Top Players
- By Regional
- By Type
- By Application
- By Formulation
- By Treatment Mode
- By Sales Channel
- Competition Analysis
- Competition Deep Dive
- BASF SE
- Overview
- Product Portfolio
- Profitability by Market Segments (Product/Age /Sales Channel/Region)
- Sales Footprint
- Strategy Overview
- Marketing Strategy
- Product Strategy
- Channel Strategy
- Bayer AG
- Syngenta Crop Protection AG
- FMC Corporation
- Sumitomo Chemical Co. Ltd.
- BASF SE
- Competition Deep Dive
- Assumptions & Acronyms Used
List Of Table
- Table 1: Global Market Value (USD Million) Forecast by Region, 2021 to 2036
- Table 2: Global Market Value (USD Million) Forecast by Type, 2021 to 2036
- Table 3: Global Market Value (USD Million) Forecast by Application, 2021 to 2036
- Table 4: Global Market Value (USD Million) Forecast by Formulation, 2021 to 2036
- Table 5: Global Market Value (USD Million) Forecast by Treatment Mode, 2021 to 2036
- Table 6: Global Market Value (USD Million) Forecast by Sales Channel, 2021 to 2036
- Table 7: North America Market Value (USD Million) Forecast by Country, 2021 to 2036
- Table 8: North America Market Value (USD Million) Forecast by Type, 2021 to 2036
- Table 9: North America Market Value (USD Million) Forecast by Application, 2021 to 2036
- Table 10: North America Market Value (USD Million) Forecast by Formulation, 2021 to 2036
- Table 11: North America Market Value (USD Million) Forecast by Treatment Mode, 2021 to 2036
- Table 12: North America Market Value (USD Million) Forecast by Sales Channel, 2021 to 2036
- Table 13: Latin America Market Value (USD Million) Forecast by Country, 2021 to 2036
- Table 14: Latin America Market Value (USD Million) Forecast by Type, 2021 to 2036
- Table 15: Latin America Market Value (USD Million) Forecast by Application, 2021 to 2036
- Table 16: Latin America Market Value (USD Million) Forecast by Formulation, 2021 to 2036
- Table 17: Latin America Market Value (USD Million) Forecast by Treatment Mode, 2021 to 2036
- Table 18: Latin America Market Value (USD Million) Forecast by Sales Channel, 2021 to 2036
- Table 19: Western Europe Market Value (USD Million) Forecast by Country, 2021 to 2036
- Table 20: Western Europe Market Value (USD Million) Forecast by Type, 2021 to 2036
- Table 21: Western Europe Market Value (USD Million) Forecast by Application, 2021 to 2036
- Table 22: Western Europe Market Value (USD Million) Forecast by Formulation, 2021 to 2036
- Table 23: Western Europe Market Value (USD Million) Forecast by Treatment Mode, 2021 to 2036
- Table 24: Western Europe Market Value (USD Million) Forecast by Sales Channel, 2021 to 2036
- Table 25: Eastern Europe Market Value (USD Million) Forecast by Country, 2021 to 2036
- Table 26: Eastern Europe Market Value (USD Million) Forecast by Type, 2021 to 2036
- Table 27: Eastern Europe Market Value (USD Million) Forecast by Application, 2021 to 2036
- Table 28: Eastern Europe Market Value (USD Million) Forecast by Formulation, 2021 to 2036
- Table 29: Eastern Europe Market Value (USD Million) Forecast by Treatment Mode, 2021 to 2036
- Table 30: Eastern Europe Market Value (USD Million) Forecast by Sales Channel, 2021 to 2036
- Table 31: East Asia Market Value (USD Million) Forecast by Country, 2021 to 2036
- Table 32: East Asia Market Value (USD Million) Forecast by Type, 2021 to 2036
- Table 33: East Asia Market Value (USD Million) Forecast by Application, 2021 to 2036
- Table 34: East Asia Market Value (USD Million) Forecast by Formulation, 2021 to 2036
- Table 35: East Asia Market Value (USD Million) Forecast by Treatment Mode, 2021 to 2036
- Table 36: East Asia Market Value (USD Million) Forecast by Sales Channel, 2021 to 2036
- Table 37: South Asia and Pacific Market Value (USD Million) Forecast by Country, 2021 to 2036
- Table 38: South Asia and Pacific Market Value (USD Million) Forecast by Type, 2021 to 2036
- Table 39: South Asia and Pacific Market Value (USD Million) Forecast by Application, 2021 to 2036
- Table 40: South Asia and Pacific Market Value (USD Million) Forecast by Formulation, 2021 to 2036
- Table 41: South Asia and Pacific Market Value (USD Million) Forecast by Treatment Mode, 2021 to 2036
- Table 42: South Asia and Pacific Market Value (USD Million) Forecast by Sales Channel, 2021 to 2036
- Table 43: Middle East & Africa Market Value (USD Million) Forecast by Country, 2021 to 2036
- Table 44: Middle East & Africa Market Value (USD Million) Forecast by Type, 2021 to 2036
- Table 45: Middle East & Africa Market Value (USD Million) Forecast by Application, 2021 to 2036
- Table 46: Middle East & Africa Market Value (USD Million) Forecast by Formulation, 2021 to 2036
- Table 47: Middle East & Africa Market Value (USD Million) Forecast by Treatment Mode, 2021 to 2036
- Table 48: Middle East & Africa Market Value (USD Million) Forecast by Sales Channel, 2021 to 2036
List Of Figures
- Figure 1: Global Market Pricing Analysis
- Figure 2: Global Market Value (USD Million) Forecast 2021-2036
- Figure 3: Global Market Value Share and BPS Analysis by Type, 2026 and 2036
- Figure 4: Global Market Y-o-Y Growth Comparison by Type, 2026 to 2036
- Figure 5: Global Market Attractiveness Analysis by Type
- Figure 6: Global Market Value Share and BPS Analysis by Application, 2026 and 2036
- Figure 7: Global Market Y-o-Y Growth Comparison by Application, 2026 to 2036
- Figure 8: Global Market Attractiveness Analysis by Application
- Figure 9: Global Market Value Share and BPS Analysis by Formulation, 2026 and 2036
- Figure 10: Global Market Y-o-Y Growth Comparison by Formulation, 2026 to 2036
- Figure 11: Global Market Attractiveness Analysis by Formulation
- Figure 12: Global Market Value Share and BPS Analysis by Treatment Mode, 2026 and 2036
- Figure 13: Global Market Y-o-Y Growth Comparison by Treatment Mode, 2026 to 2036
- Figure 14: Global Market Attractiveness Analysis by Treatment Mode
- Figure 15: Global Market Value Share and BPS Analysis by Sales Channel, 2026 and 2036
- Figure 16: Global Market Y-o-Y Growth Comparison by Sales Channel, 2026 to 2036
- Figure 17: Global Market Attractiveness Analysis by Sales Channel
- Figure 18: Global Market Value (USD Million) Share and BPS Analysis by Region, 2026 and 2036
- Figure 19: Global Market Y-o-Y Growth Comparison by Region, 2026 to 2036
- Figure 20: Global Market Attractiveness Analysis by Region
- Figure 21: North America Market Incremental Dollar Opportunity, 2026 to 2036
- Figure 22: Latin America Market Incremental Dollar Opportunity, 2026 to 2036
- Figure 23: Western Europe Market Incremental Dollar Opportunity, 2026 to 2036
- Figure 24: Eastern Europe Market Incremental Dollar Opportunity, 2026 to 2036
- Figure 25: East Asia Market Incremental Dollar Opportunity, 2026 to 2036
- Figure 26: South Asia and Pacific Market Incremental Dollar Opportunity, 2026 to 2036
- Figure 27: Middle East & Africa Market Incremental Dollar Opportunity, 2026 to 2036
- Figure 28: North America Market Value Share and BPS Analysis by Country, 2026 and 2036
- Figure 29: North America Market Value Share and BPS Analysis by Type, 2026 and 2036
- Figure 30: North America Market Y-o-Y Growth Comparison by Type, 2026 to 2036
- Figure 31: North America Market Attractiveness Analysis by Type
- Figure 32: North America Market Value Share and BPS Analysis by Application, 2026 and 2036
- Figure 33: North America Market Y-o-Y Growth Comparison by Application, 2026 to 2036
- Figure 34: North America Market Attractiveness Analysis by Application
- Figure 35: North America Market Value Share and BPS Analysis by Formulation, 2026 and 2036
- Figure 36: North America Market Y-o-Y Growth Comparison by Formulation, 2026 to 2036
- Figure 37: North America Market Attractiveness Analysis by Formulation
- Figure 38: North America Market Value Share and BPS Analysis by Treatment Mode, 2026 and 2036
- Figure 39: North America Market Y-o-Y Growth Comparison by Treatment Mode, 2026 to 2036
- Figure 40: North America Market Attractiveness Analysis by Treatment Mode
- Figure 41: North America Market Value Share and BPS Analysis by Sales Channel, 2026 and 2036
- Figure 42: North America Market Y-o-Y Growth Comparison by Sales Channel, 2026 to 2036
- Figure 43: North America Market Attractiveness Analysis by Sales Channel
- Figure 44: Latin America Market Value Share and BPS Analysis by Country, 2026 and 2036
- Figure 45: Latin America Market Value Share and BPS Analysis by Type, 2026 and 2036
- Figure 46: Latin America Market Y-o-Y Growth Comparison by Type, 2026 to 2036
- Figure 47: Latin America Market Attractiveness Analysis by Type
- Figure 48: Latin America Market Value Share and BPS Analysis by Application, 2026 and 2036
- Figure 49: Latin America Market Y-o-Y Growth Comparison by Application, 2026 to 2036
- Figure 50: Latin America Market Attractiveness Analysis by Application
- Figure 51: Latin America Market Value Share and BPS Analysis by Formulation, 2026 and 2036
- Figure 52: Latin America Market Y-o-Y Growth Comparison by Formulation, 2026 to 2036
- Figure 53: Latin America Market Attractiveness Analysis by Formulation
- Figure 54: Latin America Market Value Share and BPS Analysis by Treatment Mode, 2026 and 2036
- Figure 55: Latin America Market Y-o-Y Growth Comparison by Treatment Mode, 2026 to 2036
- Figure 56: Latin America Market Attractiveness Analysis by Treatment Mode
- Figure 57: Latin America Market Value Share and BPS Analysis by Sales Channel, 2026 and 2036
- Figure 58: Latin America Market Y-o-Y Growth Comparison by Sales Channel, 2026 to 2036
- Figure 59: Latin America Market Attractiveness Analysis by Sales Channel
- Figure 60: Western Europe Market Value Share and BPS Analysis by Country, 2026 and 2036
- Figure 61: Western Europe Market Value Share and BPS Analysis by Type, 2026 and 2036
- Figure 62: Western Europe Market Y-o-Y Growth Comparison by Type, 2026 to 2036
- Figure 63: Western Europe Market Attractiveness Analysis by Type
- Figure 64: Western Europe Market Value Share and BPS Analysis by Application, 2026 and 2036
- Figure 65: Western Europe Market Y-o-Y Growth Comparison by Application, 2026 to 2036
- Figure 66: Western Europe Market Attractiveness Analysis by Application
- Figure 67: Western Europe Market Value Share and BPS Analysis by Formulation, 2026 and 2036
- Figure 68: Western Europe Market Y-o-Y Growth Comparison by Formulation, 2026 to 2036
- Figure 69: Western Europe Market Attractiveness Analysis by Formulation
- Figure 70: Western Europe Market Value Share and BPS Analysis by Treatment Mode, 2026 and 2036
- Figure 71: Western Europe Market Y-o-Y Growth Comparison by Treatment Mode, 2026 to 2036
- Figure 72: Western Europe Market Attractiveness Analysis by Treatment Mode
- Figure 73: Western Europe Market Value Share and BPS Analysis by Sales Channel, 2026 and 2036
- Figure 74: Western Europe Market Y-o-Y Growth Comparison by Sales Channel, 2026 to 2036
- Figure 75: Western Europe Market Attractiveness Analysis by Sales Channel
- Figure 76: Eastern Europe Market Value Share and BPS Analysis by Country, 2026 and 2036
- Figure 77: Eastern Europe Market Value Share and BPS Analysis by Type, 2026 and 2036
- Figure 78: Eastern Europe Market Y-o-Y Growth Comparison by Type, 2026 to 2036
- Figure 79: Eastern Europe Market Attractiveness Analysis by Type
- Figure 80: Eastern Europe Market Value Share and BPS Analysis by Application, 2026 and 2036
- Figure 81: Eastern Europe Market Y-o-Y Growth Comparison by Application, 2026 to 2036
- Figure 82: Eastern Europe Market Attractiveness Analysis by Application
- Figure 83: Eastern Europe Market Value Share and BPS Analysis by Formulation, 2026 and 2036
- Figure 84: Eastern Europe Market Y-o-Y Growth Comparison by Formulation, 2026 to 2036
- Figure 85: Eastern Europe Market Attractiveness Analysis by Formulation
- Figure 86: Eastern Europe Market Value Share and BPS Analysis by Treatment Mode, 2026 and 2036
- Figure 87: Eastern Europe Market Y-o-Y Growth Comparison by Treatment Mode, 2026 to 2036
- Figure 88: Eastern Europe Market Attractiveness Analysis by Treatment Mode
- Figure 89: Eastern Europe Market Value Share and BPS Analysis by Sales Channel, 2026 and 2036
- Figure 90: Eastern Europe Market Y-o-Y Growth Comparison by Sales Channel, 2026 to 2036
- Figure 91: Eastern Europe Market Attractiveness Analysis by Sales Channel
- Figure 92: East Asia Market Value Share and BPS Analysis by Country, 2026 and 2036
- Figure 93: East Asia Market Value Share and BPS Analysis by Type, 2026 and 2036
- Figure 94: East Asia Market Y-o-Y Growth Comparison by Type, 2026 to 2036
- Figure 95: East Asia Market Attractiveness Analysis by Type
- Figure 96: East Asia Market Value Share and BPS Analysis by Application, 2026 and 2036
- Figure 97: East Asia Market Y-o-Y Growth Comparison by Application, 2026 to 2036
- Figure 98: East Asia Market Attractiveness Analysis by Application
- Figure 99: East Asia Market Value Share and BPS Analysis by Formulation, 2026 and 2036
- Figure 100: East Asia Market Y-o-Y Growth Comparison by Formulation, 2026 to 2036
- Figure 101: East Asia Market Attractiveness Analysis by Formulation
- Figure 102: East Asia Market Value Share and BPS Analysis by Treatment Mode, 2026 and 2036
- Figure 103: East Asia Market Y-o-Y Growth Comparison by Treatment Mode, 2026 to 2036
- Figure 104: East Asia Market Attractiveness Analysis by Treatment Mode
- Figure 105: East Asia Market Value Share and BPS Analysis by Sales Channel, 2026 and 2036
- Figure 106: East Asia Market Y-o-Y Growth Comparison by Sales Channel, 2026 to 2036
- Figure 107: East Asia Market Attractiveness Analysis by Sales Channel
- Figure 108: South Asia and Pacific Market Value Share and BPS Analysis by Country, 2026 and 2036
- Figure 109: South Asia and Pacific Market Value Share and BPS Analysis by Type, 2026 and 2036
- Figure 110: South Asia and Pacific Market Y-o-Y Growth Comparison by Type, 2026 to 2036
- Figure 111: South Asia and Pacific Market Attractiveness Analysis by Type
- Figure 112: South Asia and Pacific Market Value Share and BPS Analysis by Application, 2026 and 2036
- Figure 113: South Asia and Pacific Market Y-o-Y Growth Comparison by Application, 2026 to 2036
- Figure 114: South Asia and Pacific Market Attractiveness Analysis by Application
- Figure 115: South Asia and Pacific Market Value Share and BPS Analysis by Formulation, 2026 and 2036
- Figure 116: South Asia and Pacific Market Y-o-Y Growth Comparison by Formulation, 2026 to 2036
- Figure 117: South Asia and Pacific Market Attractiveness Analysis by Formulation
- Figure 118: South Asia and Pacific Market Value Share and BPS Analysis by Treatment Mode, 2026 and 2036
- Figure 119: South Asia and Pacific Market Y-o-Y Growth Comparison by Treatment Mode, 2026 to 2036
- Figure 120: South Asia and Pacific Market Attractiveness Analysis by Treatment Mode
- Figure 121: South Asia and Pacific Market Value Share and BPS Analysis by Sales Channel, 2026 and 2036
- Figure 122: South Asia and Pacific Market Y-o-Y Growth Comparison by Sales Channel, 2026 to 2036
- Figure 123: South Asia and Pacific Market Attractiveness Analysis by Sales Channel
- Figure 124: Middle East & Africa Market Value Share and BPS Analysis by Country, 2026 and 2036
- Figure 125: Middle East & Africa Market Value Share and BPS Analysis by Type, 2026 and 2036
- Figure 126: Middle East & Africa Market Y-o-Y Growth Comparison by Type, 2026 to 2036
- Figure 127: Middle East & Africa Market Attractiveness Analysis by Type
- Figure 128: Middle East & Africa Market Value Share and BPS Analysis by Application, 2026 and 2036
- Figure 129: Middle East & Africa Market Y-o-Y Growth Comparison by Application, 2026 to 2036
- Figure 130: Middle East & Africa Market Attractiveness Analysis by Application
- Figure 131: Middle East & Africa Market Value Share and BPS Analysis by Formulation, 2026 and 2036
- Figure 132: Middle East & Africa Market Y-o-Y Growth Comparison by Formulation, 2026 to 2036
- Figure 133: Middle East & Africa Market Attractiveness Analysis by Formulation
- Figure 134: Middle East & Africa Market Value Share and BPS Analysis by Treatment Mode, 2026 and 2036
- Figure 135: Middle East & Africa Market Y-o-Y Growth Comparison by Treatment Mode, 2026 to 2036
- Figure 136: Middle East & Africa Market Attractiveness Analysis by Treatment Mode
- Figure 137: Middle East & Africa Market Value Share and BPS Analysis by Sales Channel, 2026 and 2036
- Figure 138: Middle East & Africa Market Y-o-Y Growth Comparison by Sales Channel, 2026 to 2036
- Figure 139: Middle East & Africa Market Attractiveness Analysis by Sales Channel
- Figure 140: Global Market - Tier Structure Analysis
- Figure 141: Global Market - Company Share Analysis