Flavor Drops Market
Flavor Drops Market Analysis, By Flavor Type (Fruit Flavors, Sweet & Dessert Flavors, Tea-Based Flavors, Spice & Botanical Flavors, and Others), By Content Type, By Sales Channel, By End Use, By Nature, and Region - Market Insights 2025 to 2035
Fruit Flavors are projected to grow at a CAGR of 11.4%, whereas another segment Tea-Based Flavors is likely to grow at 10.6%. In terms of countries U.S. is projected to grow at 11.9%, followed by Germany at 8.0% and U.K. to grow at 9.7%.
Flavor Drops Market Outlook (2025 to 2035)
The global flavor drops market is expected to reach USD 309.7 million by 2035, up from USD 105.3 million in 2024. During the forecast period (2025 to 2035), the industry is projected to expand at a CAGR of 10.3%, driven by rising demand for low-calorie, customizable flavor solutions in functional beverages and health-conscious food applications.
The trending consumer demand towards sugar-free, vegan, clean-label ingredients is driving its adaptations to retail, foodservice, and e-commerce environment, and has turned traditional flavor drops into mass health-conscious consumption and enhancement aids.
Quick Stats for Flavor Drops Market
Attributes | Details |
---|---|
Industry Value (2025) | USD 116.2 Million |
Projected Value (2035) | USD 309.7 Million |
Forecast CAGR (2025 to 2035) | 10.3% |
Leading Segment (2025) | Fruit Flavors (47.6% Market Share) |
Fastest Growing Country (2025 to 2035) | U.S. (11.9% CAGR) |
Top Key Players | Capella Flavors, ESN, Flavor West, Flavorah, GymBeam, GymQueen, Inawera Flavors, LorAnn Oils |
What are the drivers of the Flavor Drops Market?
The flavor drops market is driven by increasing consumer demand for sugar-free and low-calorie products. With the rise in the number of diabetics and obese individuals, flavor drops have become an easy and health-matched alternative to older artificial sweetened drinks and mixers. They are versatile in both alcoholic and non-alcoholic beverages, which contributes to their economic value.
The growing e-commerce and direct-to-consumer approaches are accelerating product exposure and access. Niche flavor innovators are also leveraging the power of influencer marketing, personalization, and a subscription model based on samples to reach younger targets who are digital-native snacking enthusiasts. Such direct access to end-users is shortening product development cycles and enabling them to respond nimbly to changing preferences.
Application possibilities are being expanded through the flavor encapsulation and stabilization of natural extracts via technological innovation. The enhanced dispersion of flavor and shelf stabilization achieved through microencapsulation, as well as the use of water-soluble delivery systems, are being employed by manufacturers.
Such improvements are driving market development in functional beverages, sports nutrition and OTC wellness segments, which are all coming together in terms of the health and indulgence value offering.
What are the regional trends of the Flavor Drops Market?
Consumers in North America well accept sugar-free flavor drops with a mature wellness product environment and a push of new product introductions. In the U.S., it has gained popularity among people who love fitness, followers of the keto diet and clean-label movements. Shopkeepers are becoming interested in special shelves, in particular in vegan and botanical-infused versions.
Europe is an advanced infrastructure environment for regulation and formulation of natural ingredients. Germany and the UK play important roles in innovation through the utilization of botanical research and development, as well as herbal infusions that comply with EU additive requirements. Local brands are incorporating sustainability stories in their targeting of environmentally conscious consumers.
The Asia Pacific is witnessing a surge in adoption due to urbanization and lifestyle shifts. India and Southeast Asia are displaying strong growth in fruit-based and dessert-flavored drops. Cross-border digital commerce and rising disposable incomes are driving the rapid diversification of consumption beyond traditional markets.
What are the challenges and restraining factors of the Flavor Drops Market?
The uncertainty in the regulation of natural flavor labeling and the usage of additives declines the scalability of the market. The organic, natural, and sugar-free labeling variants have different standards practiced in various jurisdictions, and therefore, cross-border trade is complicated, and new product approval is delayed. Such inconsistency works as a compliance and costs burden on international manufacturers.
Solubility and taste stability have technical issues. High levels of formulation expertise are necessary to achieve consistent profile retention across various beverage platforms, particularly in dairy and high-acid formulations. Failing to invest in microencapsulation or emulsion technologies, the products will exhibit decreased performance, which will impact brand loyalty and ongoing purchasing.
Paired with the pressure placed on intellectual property restrictions and the inability to gather raw materials due to high demand and low availability of categories such as botanical extracts and exotic fruits, there is pressure on procurement. SMEs struggle to win long-term purchasing contracts and frequently rely on seasonal supply chains, which intensify prices and impede scaling throughout the year.
Country-Wise Insights
The United States is Driving Mass Customization in Flavor Drops
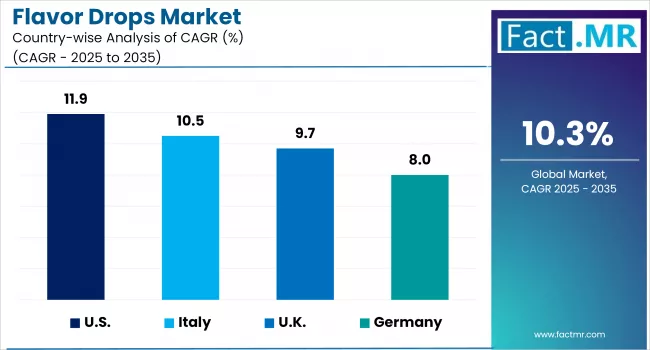
The U.S. has emerged in the lead position in the flavor drops market owing to the advanced food science infrastructure and early adoption by consumers. American businesses are leading the high-velocity trends in the microencapsulation field, zero-calorie sweeteners and integration of functional ingredients. The active health-conscious consumer population offers a welcoming environment to experiment and take products to premium levels in the country.
Due to the increasing awareness of personalised nutrition, fitness programs and convenience, internal demand is being fulfilled. Flavor drops are now gaining their way into mainstream retailing lineups, fitness club chains and functional beverage lines. Consumer trends and the ability to conduct R&D yield great synergy that is used in stimulating future growth in the local markets.
In the export side, American companies are invading Asian and European markets vigorously via the lanes of e-commerce, co-manufacturing agreement, and DTC logistics. They increase competitiveness with global alliances, acquisitions in flavor technology and buying of natural ingredients. It is likely that the U.S. will continue to be an innovation hub of flavor with scalable business results.
Germany is the Innovation Engine for Botanical and Natural Flavor Drops
Germany’s technical leadership in flavor drops stems from its legacy in botanical research, Technical leadership in the field of flavor drop is derived by Germany, as it has a history based on botanical studies and herbal extracts, and its food grade chemical studies. Companies in Germany are coming up with new organic-certified, allergen-free and sustainable flavors that strike a chord in the EU. The technologies of precision fermentation and solvent-free extraction are becoming popular high-impact technologies.
The internal German market has the advantage of the green buyers and good regulation support. Tough regulation of food additives is behind the push of clean-label development and tilting brands to natural and bio-identical. Both retail and institutional foodservice demand is increasing steadily toward health-oriented customization options.
Competitive advantage of Germany companies that are export-oriented lies in their excellent documentations of compliance and traceability. Their tastes are common in the high regulation markets Japan and Canada. Sustainability and biocompatibility provide a challenge to the industry, which is why Germany has been successful over the years in becoming a global associate delivering flavor innovations.
The United Kingdom is the Digital Commerce Powerhouse in Flavor Drops
The flavor drops industry in the UK is thriving, driven by a digital-first mindset among consumers and the flexibility of wellness-focused brands to adapt to evolving preferences. Target flavor solutions are made possible by companies in Great Britain, which are exploiting e-commerce, influencer networks, and healthcare apps. These services are selling sugar-free, vegan, and nootropic-added drops that can suit a range of functionalities.
Home, an increasing tendency in the limitation of alcoholic drinks, home-made drinks, and eating style has twisted on consumer interaction. The British supermarkets are increasingly building up their own-label propositions and start up culture is spurring daring innovations particularly in fruit-based and botanical-based variants. Digital trends meet the wellness one, pushing a product iteration.
The performance of the UK in export trade is supported by elasticity in labeling and quick responsiveness in market flexibility. The new growth corridors are unlocking as a result of the regional trade relations after Brexit particularly with the Gulf region and Southeast Asia. British businesses will tend to test new forms online and replicate them in stores; they will reach operational efficiency and vast scope.
Category-Wise Analysis
Fruit Flavors Dominate as the Go-To Wellness Enhancer
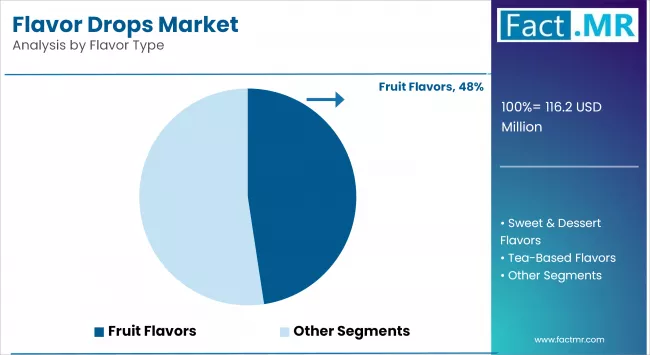
Fruit flavors dominate the market share because they cater to everyone and align with the health and refreshment narrative. Apple, berries, lemon, and tropical flavours are particularly dominant in hydration products, infused waters and cocktail mixers. They are versatile, with very little limitation in their use in foodservice or retail segments, and have a stable acceptance by consumers, irrespective of age and dietary factors.
The future is assured of further expansion due to the introduction of exotic fruits and local blends. Brands are expanding into adventurous palates by developing new portfolios of passionfruit, lychee and calamansi flavours. Likely, the next stage of functional infusion (a mix of vitamins, adaptogens, or electrolytes) will make the fruit flavors more relevant in the areas of wellness, sports nutrition categories, and clean-label beverage development.
Sugar-Free Content Is the Category Growth Catalyst
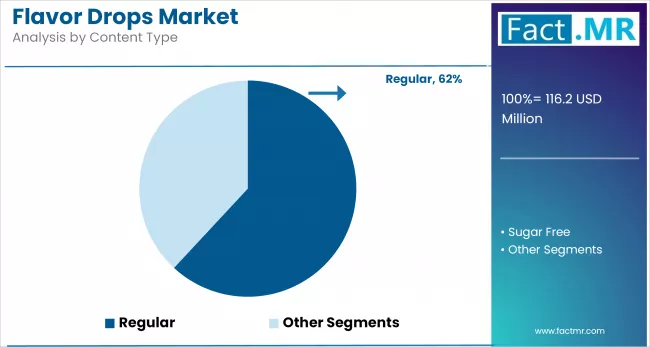
The high growth rate is driven by sugar-free flavor drops, which are fueled by increased awareness of sugar consumption, metabolism, and weight control. These drops address the primary concerns of diabetic and fitness-oriented consumers without compromising taste. The existence of regulatory support for low-sugar diets in many parts of the world favors the penetration of such diets among people of various ages and locations.
In order to satisfy the demands of clean labeling, manufacturers are gradually replacing artificial sweeteners with natural ones (stevia, monk fruit, or erythritol). The success of sugar-free drops within ready-to-drink teas, mocktails, and low-calorie sodas indicates mainstream acceptance. Boosted solubility and freedom of flavor will also become a driving force in this direction.
Competitive Analysis
Key players in the flavor drops industry include Capella Flavors, ESN, Flavor West, Flavorah, GymBeam, GymQueen, Inawera Flavors, LorAnn Oils, Medicine Flower, MyProtein (FlavDrops), NutraBox, Pure Flavour, Real Flavors, SodaStream, and Stur Drinks.
The international flavor drops industry is highly volatile, as new companies and medium-sized organizations challenge older institutions of flavor makers. The flavour technologies are patent-protected and unique; the flavours are broadened, and clean-label formulations are available. Among the defining tools in the brand positioning process are digital marketing techniques, working with influencers, and DTC distribution patterns.
The field of innovation is becoming more intense in microencapsulation, formulation that is absent of sugar, and natural extracts sourcing. Companies are also seeking speedy addition of SKUs and customization of area flavors to cater to the fragmented consumer taste.
The business of procurement tends to move toward ethical supplier choices and chain-of-origin of ingredients, and consolidation patterns would be indicative of a wave of strategic mergers in support of innovation and distribution.
Recent Development
- In May 2024, Wisdom Natural Brands launched its first single-ingredient SweetLeaf Xylitol Reduced-Calorie Sweetener, a natural, 10-calorie sugar replacement tailored for keto and diabetic consumers. This expansion broadened SweetLeaf’s range beyond stevia and monk fruit, meeting retailer demand for baking-friendly substitutes. The product was packaged in re-sealable, recyclable pouches for mainstream grocery channels.
- In November 2024, GymBeam expanded its gaming-centric XBeam line with the launch of Hydrate XP, a vitamin-electrolyte blend offered in Wild Berries, Strawberry Kiwi, and Green Apple. Priced at €17.50, each bottle contained approximately 600 mg of electrolytes and ginseng for recovery. The company promoted the launch through livestream demos and limited-time bundle discounts, diversifying its wellness portfolio.
Fact.MR has provided detailed information about the price points of key manufacturers of the Flavor Drops Market positioned across regions, sales growth, production capacity, and speculative technological expansion, in the recently published report
Methodology and Industry Tracking Approach
The 2025 Flavor Drops Market Report by Fact.MR is based on insights collected from 1,200 stakeholders across 12 countries, with a minimum of 75 respondents per country. Among the participants, 65% were end users, including foodservice buyers, retail procurement teams, beverage formulators, and nutritionists, while the remaining 35% comprised compliance officers, R&D leads, and category managers.
Data collection was conducted between June 2024 and May 2025, focusing on product solubility, flavor retention, sweetener compatibility, labeling compliance, and consumer personalization trends. A regionally balanced calibration model ensured valid cross-market representation across North America, Europe, and the Asia Pacific.
The study integrated data from over 95 sources, including ingredient catalogs, regulatory filings, consumption databases, and white papers on flavor technology. All findings were triangulated to yield reliable estimates and actionable insights.
Fact.MR applied rigorous analytical tools, such as multivariate regression and scenario modeling, to ensure data robustness. With continuous monitoring of the glass adhesives market since 2018, this report provides a comprehensive roadmap for firms seeking a competitive advantage, innovation, and sustainable growth within the sector.
Segmentation of Flavor Drops Market
-
By Flavor Type :
- Fruit Flavors
- Apple
- Cherry
- Berries
- Fruit Punch
- Lemon
- Others
- Sweet & Dessert Flavors
- Chocolate
- Vanilla
- Caramel, Butterscotch
- Tea-Based Flavors
- Spice & Botanical Flavors
- Others
- Fruit Flavors
-
By Content Type :
- Regular
- Sugar Free
-
By Sales Channel :
- Foodservice
- Retail
- Modern Trade
- E-Commerce
- Other Channels
-
By End Use
- Alcoholic Beverages
- Non-Alcoholic Beverages
-
By Nature :
- Organic
- Natural
- Vegan
- Conventional
-
By Region :
- North America
- Latin America
- Western Europe
- Eastern Europe
- East Asia
- South Asia & Pacific
- Middle East & Africa
Table of Content
- Executive Summary
- Global Market Outlook
- Demand-side Trends
- Supply-side Trends
- Technology Roadmap Analysis
- Analysis and Recommendations
- Market Overview
- Market Coverage / Taxonomy
- Market Definition / Scope / Limitations
- Market Background
- Market Dynamics
- Drivers
- Restraints
- Opportunity
- Trends
- Scenario Forecast
- Demand in Optimistic Scenario
- Demand in Likely Scenario
- Demand in Conservative Scenario
- Opportunity Map Analysis
- Product Life Cycle Analysis
- Supply Chain Analysis
- Supply Side Participants and their Roles
- Producers
- Mid-Level Participants (Traders/ Agents/ Brokers)
- Wholesalers and Distributors
- Value Added and Value Created at Node in the Supply Chain
- List of Component Suppliers
- List of Existing and Potential Buyers
- Supply Side Participants and their Roles
- Investment Feasibility Matrix
- Value Chain Analysis
- Profit Margin Analysis
- Wholesalers and Distributors
- Retailers
- PESTLE and Porter’s Analysis
- Regulatory Landscape
- By Key Regions
- By Key Countries
- Production and Consumption Statistics
- Import and Export Statistics
- Market Dynamics
- Global Market Analysis 2020 to 2024 and Forecast, 2025 to 2035
- Historical Market Size Value (USD Mn) & Volume (Liters) Analysis, 2020 to 2024
- Current and Future Market Size Value (USD Mn) & Volume (Liters) Projections, 2025 to 2035
- Y-o-Y Growth Trend Analysis
- Absolute $ Opportunity Analysis
- Global Market Pricing Analysis 2020 to 2024 and Forecast 2025 to 2035
- Global Market Analysis 2020 to 2024 and Forecast 2025 to 2035, By Flavor Type
- Introduction / Key Findings
- Historical Market Size Value (USD Mn) & Volume (Liters) Analysis By Flavor Type, 2020 to 2024
- Current and Future Market Size Value (USD Mn) & Volume (Liters) Analysis and Forecast By Flavor Type, 2025 to 2035
- Fruit Flavors
- Apple
- Cherry
- Berries
- Fruit Punch
- Lemon
- Others
- Sweet & Dessert Flavors
- Chocolate
- Vanilla
- Caramel, Butterscotch
- Tea-Based Flavors
- Spice & Botanical Flavors
- Others
- Fruit Flavors
- Y-o-Y Growth Trend Analysis By Flavor Type, 2020 to 2024
- Absolute $ Opportunity Analysis By Flavor Type, 2025 to 2035
- Global Market Analysis 2020 to 2024 and Forecast 2025 to 2035, By Content Type
- Introduction / Key Findings
- Historical Market Size Value (USD Mn) & Volume (Liters) Analysis By Content Type, 2020 to 2024
- Current and Future Market Size Value (USD Mn) & Volume (Liters) Analysis and Forecast By Content Type, 2025 to 2035
- Regular
- Sugar Free
- Y-o-Y Growth Trend Analysis By Content Type, 2020 to 2024
- Absolute $ Opportunity Analysis By Content Type, 2025 to 2035
- Global Market Analysis 2020 to 2024 and Forecast 2025 to 2035, By Sales Channel
- Introduction / Key Findings
- Historical Market Size Value (USD Mn) & Volume (Liters) Analysis By Sales Channel, 2020 to 2024
- Current and Future Market Size Value (USD Mn) & Volume (Liters) Analysis and Forecast By Sales Channel, 2025 to 2035
- Foodservice
- Retail
- Modern Trade
- E-Commerce
- Other Channels
- Y-o-Y Growth Trend Analysis By Sales Channel, 2020 to 2024
- Absolute $ Opportunity Analysis By Sales Channel, 2025 to 2035
- Global Market Analysis 2020 to 2024 and Forecast 2025 to 2035, By End Use
- Introduction / Key Findings
- Historical Market Size Value (USD Mn) & Volume (Liters) Analysis By End Use, 2020 to 2024
- Current and Future Market Size Value (USD Mn) & Volume (Liters) Analysis and Forecast By End Use, 2025 to 2035
- Alcoholic Beverages
- Non-Alcoholic Beverages
- Y-o-Y Growth Trend Analysis By End Use, 2020 to 2024
- Absolute $ Opportunity Analysis By End Use, 2025 to 2035
- Global Market Analysis 2020 to 2024 and Forecast 2025 to 2035, By Nature
- Introduction / Key Findings
- Historical Market Size Value (USD Mn) & Volume (Liters) Analysis By Nature, 2020 to 2024
- Current and Future Market Size Value (USD Mn) & Volume (Liters) Analysis and Forecast By Nature, 2025 to 2035
- Organic
- Natural
- Vegan
- Conventional
- Y-o-Y Growth Trend Analysis By Nature, 2020 to 2024
- Absolute $ Opportunity Analysis By Nature, 2025 to 2035
- Global Market Analysis 2020 to 2024 and Forecast 2025 to 2035, By Region
- Introduction
- Historical Market Size Value (USD Mn) & Volume (Liters) Analysis By Region, 2020 to 2024
- Current Market Size Value (USD Mn) & Volume (Liters) Analysis and Forecast By Region, 2025 to 2035
- North America
- Latin America
- Western Europe
- East Asia
- South Asia Pacific
- Eastern Europe
- Middle East & Africa
- Market Attractiveness Analysis By Region
- North America Market Analysis 2020 to 2024 and Forecast 2025 to 2035, By Country
- Historical Market Size Value (USD Mn) & Volume (Liters) Trend Analysis By Market Taxonomy, 2020 to 2024
- Market Size Value (USD Mn) & Volume (Liters) Forecast By Market Taxonomy, 2025 to 2035
- By Country
- U.S.
- Canada
- Mexico
- By Flavor Type
- By Content Type
- By Sales Channel
- By End Use
- By Nature
- By Country
- Market Attractiveness Analysis
- By Country
- By Flavor Type
- By Content Type
- By Sales Channel
- By End Use
- By Nature
- Key Takeaways
- Latin America Market Analysis 2020 to 2024 and Forecast 2025 to 2035, By Country
- Historical Market Size Value (USD Mn) & Volume (Liters) Trend Analysis By Market Taxonomy, 2020 to 2024
- Market Size Value (USD Mn) & Volume (Liters) Forecast By Market Taxonomy, 2025 to 2035
- By Country
- Brazil
- Chile
- Rest of Latin America
- By Flavor Type
- By Content Type
- By Sales Channel
- By End Use
- By Nature
- By Country
- Market Attractiveness Analysis
- By Country
- By Flavor Type
- By Content Type
- By Sales Channel
- By End Use
- By Nature
- Key Takeaways
- Western Europe Market Analysis 2020 to 2024 and Forecast 2025 to 2035, By Country
- Historical Market Size Value (USD Mn) & Volume (Liters) Trend Analysis By Market Taxonomy, 2020 to 2024
- Market Size Value (USD Mn) & Volume (Liters) Forecast By Market Taxonomy, 2025 to 2035
- By Country
- Germany
- Italy
- France
- U.K.
- Spain
- Russia
- BENELUX
- Rest of Europe
- By Flavor Type
- By Content Type
- By Sales Channel
- By End Use
- By Nature
- By Country
- Market Attractiveness Analysis
- By Country
- By Flavor Type
- By Content Type
- By Sales Channel
- By End Use
- By Nature
- Key Takeaways
- East Asia Market Analysis 2020 to 2024 and Forecast 2025 to 2035, By Country
- Historical Market Size Value (USD Mn) & Volume (Liters) Trend Analysis By Market Taxonomy, 2020 to 2024
- Market Size Value (USD Mn) & Volume (Liters) Forecast By Market Taxonomy, 2025 to 2035
- By Country
- China
- Japan
- South Korea
- By Flavor Type
- By Content Type
- By Sales Channel
- By End Use
- By Nature
- By Country
- Market Attractiveness Analysis
- By Country
- By Flavor Type
- By Content Type
- By Sales Channel
- By End Use
- By Nature
- Key Takeaways
- South Asia Pacific Market Analysis 2020 to 2024 and Forecast 2025 to 2035, By Country
- Historical Market Size Value (USD Mn) & Volume (Liters) Trend Analysis By Market Taxonomy, 2020 to 2024
- Market Size Value (USD Mn) & Volume (Liters) Forecast By Market Taxonomy, 2025 to 2035
- By Country
- India
- ASEAN Countries
- Australia & New Zealand
- Rest of South Asia Pacific
- By Flavor Type
- By Content Type
- By Sales Channel
- By End Use
- By Nature
- By Country
- Market Attractiveness Analysis
- By Country
- By Flavor Type
- By Content Type
- By Sales Channel
- By End Use
- By Nature
- Key Takeaways
- Eastern Europe Market Analysis 2020 to 2024 and Forecast 2025 to 2035, By Country
- Historical Market Size Value (USD Mn) & Volume (Liters) Trend Analysis By Market Taxonomy, 2020 to 2024
- Market Size Value (USD Mn) & Volume (Liters) Forecast By Market Taxonomy, 2025 to 2035
- By Country
- Russia
- Poland
- Hungary
- Balkan & Baltics
- Rest of Eastern Europe
- By Flavor Type
- By Content Type
- By Sales Channel
- By End Use
- By Nature
- By Country
- Market Attractiveness Analysis
- By Country
- By Flavor Type
- By Content Type
- By Sales Channel
- By End Use
- By Nature
- Key Takeaways
- Middle East & Africa Market Analysis 2020 to 2024 and Forecast 2025 to 2035, By Country
- Historical Market Size Value (USD Mn) & Volume (Liters) Trend Analysis By Market Taxonomy, 2020 to 2024
- Market Size Value (USD Mn) & Volume (Liters) Forecast By Market Taxonomy, 2025 to 2035
- By Country
- KSA
- Other GCC Countries
- Turkiye
- South Africa
- Rest of MEA
- By Flavor Type
- By Content Type
- By Sales Channel
- By End Use
- By Nature
- By Country
- Market Attractiveness Analysis
- By Country
- By Flavor Type
- By Content Type
- By Sales Channel
- By End Use
- By Nature
- Key Takeaways
- Key Countries Market Analysis
- U.S.
- Pricing Analysis
- Market Share Analysis, 2024
- By Flavor Type
- By Content Type
- By Sales Channel
- By End Use
- By Nature
- Germany
- Pricing Analysis
- Market Share Analysis, 2024
- By Flavor Type
- By Content Type
- By Sales Channel
- By End Use
- By Nature
- U.K.
- Pricing Analysis
- Market Share Analysis, 2024
- By Flavor Type
- By Content Type
- By Sales Channel
- By End Use
- By Nature
- U.S.
- Market Structure Analysis
- Competition Dashboard
- Competition Benchmarking
- Market Share Analysis of Top Players
- By Regional
- By Flavor Type
- By Content Type
- By Sales Channel
- By End Use
- By Nature
- Competition Analysis
- Competition Deep Dive
- Capella Flavors
- Overview
- Product Portfolio
- Profitability by Market Segments (Product/Age /Sales Channel/Region)
- Sales Footprint
- Strategy Overview
- Marketing Strategy
- Product Strategy
- Channel Strategy
- ESN
- Overview
- Product Portfolio
- Profitability by Market Segments (Product/Age /Sales Channel/Region)
- Sales Footprint
- Strategy Overview
- Marketing Strategy
- Product Strategy
- Channel Strategy
- Flavor West
- Overview
- Product Portfolio
- Profitability by Market Segments (Product/Age /Sales Channel/Region)
- Sales Footprint
- Strategy Overview
- Marketing Strategy
- Product Strategy
- Channel Strategy
- Flavorah
- Overview
- Product Portfolio
- Profitability by Market Segments (Product/Age /Sales Channel/Region)
- Sales Footprint
- Strategy Overview
- Marketing Strategy
- Product Strategy
- Channel Strategy
- GymBeam
- Overview
- Product Portfolio
- Profitability by Market Segments (Product/Age /Sales Channel/Region)
- Sales Footprint
- Strategy Overview
- Marketing Strategy
- Product Strategy
- Channel Strategy
- GymQueen
- Overview
- Product Portfolio
- Profitability by Market Segments (Product/Age /Sales Channel/Region)
- Sales Footprint
- Strategy Overview
- Marketing Strategy
- Product Strategy
- Channel Strategy
- Inawera Flavors
- Overview
- Product Portfolio
- Profitability by Market Segments (Product/Age /Sales Channel/Region)
- Sales Footprint
- Strategy Overview
- Marketing Strategy
- Product Strategy
- Channel Strategy
- LorAnn Oils
- Overview
- Product Portfolio
- Profitability by Market Segments (Product/Age /Sales Channel/Region)
- Sales Footprint
- Strategy Overview
- Marketing Strategy
- Product Strategy
- Channel Strategy
- Medicine Flower
- Overview
- Product Portfolio
- Profitability by Market Segments (Product/Age /Sales Channel/Region)
- Sales Footprint
- Strategy Overview
- Marketing Strategy
- Product Strategy
- Channel Strategy
- MyProtein (FlavDrops)
- Overview
- Product Portfolio
- Profitability by Market Segments (Product/Age /Sales Channel/Region)
- Sales Footprint
- Strategy Overview
- Marketing Strategy
- Product Strategy
- Channel Strategy
- NutraBox
- Overview
- Product Portfolio
- Profitability by Market Segments (Product/Age /Sales Channel/Region)
- Sales Footprint
- Strategy Overview
- Marketing Strategy
- Product Strategy
- Channel Strategy
- Pure Flavour
- Overview
- Product Portfolio
- Profitability by Market Segments (Product/Age /Sales Channel/Region)
- Sales Footprint
- Strategy Overview
- Marketing Strategy
- Product Strategy
- Channel Strategy
- Real Flavors
- Overview
- Product Portfolio
- Profitability by Market Segments (Product/Age /Sales Channel/Region)
- Sales Footprint
- Strategy Overview
- Marketing Strategy
- Product Strategy
- Channel Strategy
- SodaStream
- Overview
- Product Portfolio
- Profitability by Market Segments (Product/Age /Sales Channel/Region)
- Sales Footprint
- Strategy Overview
- Marketing Strategy
- Product Strategy
- Channel Strategy
- Stur Drinks
- Overview
- Product Portfolio
- Profitability by Market Segments (Product/Age /Sales Channel/Region)
- Sales Footprint
- Strategy Overview
- Marketing Strategy
- Product Strategy
- Channel Strategy
- SweetLeaf
- Overview
- Product Portfolio
- Profitability by Market Segments (Product/Age /Sales Channel/Region)
- Sales Footprint
- Strategy Overview
- Marketing Strategy
- Product Strategy
- Channel Strategy
- The Skinny Food Co
- Overview
- Product Portfolio
- Profitability by Market Segments (Product/Age /Sales Channel/Region)
- Sales Footprint
- Strategy Overview
- Marketing Strategy
- Product Strategy
- Channel Strategy
- Women’s Best
- Overview
- Product Portfolio
- Profitability by Market Segments (Product/Age /Sales Channel/Region)
- Sales Footprint
- Strategy Overview
- Marketing Strategy
- Product Strategy
- Channel Strategy
- Other Market Players
- Overview
- Product Portfolio
- Profitability by Market Segments (Product/Age /Sales Channel/Region)
- Sales Footprint
- Strategy Overview
- Marketing Strategy
- Product Strategy
- Channel Strategy
- Capella Flavors
- Competition Deep Dive
- Assumptions & Acronyms Used
- Research Methodology
List Of Table
- Table 1: Global Market Value (USD Mn) Forecast by Region, 2020 to 2035
- Table 2: Global Market Volume (Liters) Forecast by Region, 2020 to 2035
- Table 3: Global Market Value (USD Mn) Forecast by Flavor Type, 2020 to 2035
- Table 4: Global Market Volume (Liters) Forecast by Flavor Type, 2020 to 2035
- Table 5: Global Market Value (USD Mn) Forecast by Content Type, 2020 to 2035
- Table 6: Global Market Volume (Liters) Forecast by Content Type, 2020 to 2035
- Table 7: Global Market Value (USD Mn) Forecast by Sales Channel, 2020 to 2035
- Table 8: Global Market Volume (Liters) Forecast by Sales Channel, 2020 to 2035
- Table 9: Global Market Value (USD Mn) Forecast by End Use, 2020 to 2035
- Table 10: Global Market Volume (Liters) Forecast by End Use, 2020 to 2035
- Table 11: Global Market Value (USD Mn) Forecast by Nature, 2020 to 2035
- Table 12: Global Market Volume (Liters) Forecast by Nature, 2020 to 2035
- Table 13: North America Market Value (USD Mn) Forecast by Country, 2020 to 2035
- Table 14: North America Market Volume (Liters) Forecast by Country, 2020 to 2035
- Table 15: North America Market Value (USD Mn) Forecast by Flavor Type, 2020 to 2035
- Table 16: North America Market Volume (Liters) Forecast by Flavor Type, 2020 to 2035
- Table 17: North America Market Value (USD Mn) Forecast by Content Type, 2020 to 2035
- Table 18: North America Market Volume (Liters) Forecast by Content Type, 2020 to 2035
- Table 19: North America Market Value (USD Mn) Forecast by Sales Channel, 2020 to 2035
- Table 20: North America Market Volume (Liters) Forecast by Sales Channel, 2020 to 2035
- Table 21: North America Market Value (USD Mn) Forecast by End Use, 2020 to 2035
- Table 22: North America Market Volume (Liters) Forecast by End Use, 2020 to 2035
- Table 23: North America Market Value (USD Mn) Forecast by Nature, 2020 to 2035
- Table 24: North America Market Volume (Liters) Forecast by Nature, 2020 to 2035
- Table 25: Latin America Market Value (USD Mn) Forecast by Country, 2020 to 2035
- Table 26: Latin America Market Volume (Liters) Forecast by Country, 2020 to 2035
- Table 27: Latin America Market Value (USD Mn) Forecast by Flavor Type, 2020 to 2035
- Table 28: Latin America Market Volume (Liters) Forecast by Flavor Type, 2020 to 2035
- Table 29: Latin America Market Value (USD Mn) Forecast by Content Type, 2020 to 2035
- Table 30: Latin America Market Volume (Liters) Forecast by Content Type, 2020 to 2035
- Table 31: Latin America Market Value (USD Mn) Forecast by Sales Channel, 2020 to 2035
- Table 32: Latin America Market Volume (Liters) Forecast by Sales Channel, 2020 to 2035
- Table 33: Latin America Market Value (USD Mn) Forecast by End Use, 2020 to 2035
- Table 34: Latin America Market Volume (Liters) Forecast by End Use, 2020 to 2035
- Table 35: Latin America Market Value (USD Mn) Forecast by Nature, 2020 to 2035
- Table 36: Latin America Market Volume (Liters) Forecast by Nature, 2020 to 2035
- Table 37: Western Europe Market Value (USD Mn) Forecast by Country, 2020 to 2035
- Table 38: Western Europe Market Volume (Liters) Forecast by Country, 2020 to 2035
- Table 39: Western Europe Market Value (USD Mn) Forecast by Flavor Type, 2020 to 2035
- Table 40: Western Europe Market Volume (Liters) Forecast by Flavor Type, 2020 to 2035
- Table 41: Western Europe Market Value (USD Mn) Forecast by Content Type, 2020 to 2035
- Table 42: Western Europe Market Volume (Liters) Forecast by Content Type, 2020 to 2035
- Table 43: Western Europe Market Value (USD Mn) Forecast by Sales Channel, 2020 to 2035
- Table 44: Western Europe Market Volume (Liters) Forecast by Sales Channel, 2020 to 2035
- Table 45: Western Europe Market Value (USD Mn) Forecast by End Use, 2020 to 2035
- Table 46: Western Europe Market Volume (Liters) Forecast by End Use, 2020 to 2035
- Table 47: Western Europe Market Value (USD Mn) Forecast by Nature, 2020 to 2035
- Table 48: Western Europe Market Volume (Liters) Forecast by Nature, 2020 to 2035
- Table 49: East Asia Market Value (USD Mn) Forecast by Country, 2020 to 2035
- Table 50: East Asia Market Volume (Liters) Forecast by Country, 2020 to 2035
- Table 51: East Asia Market Value (USD Mn) Forecast by Flavor Type, 2020 to 2035
- Table 52: East Asia Market Volume (Liters) Forecast by Flavor Type, 2020 to 2035
- Table 53: East Asia Market Value (USD Mn) Forecast by Content Type, 2020 to 2035
- Table 54: East Asia Market Volume (Liters) Forecast by Content Type, 2020 to 2035
- Table 55: East Asia Market Value (USD Mn) Forecast by Sales Channel, 2020 to 2035
- Table 56: East Asia Market Volume (Liters) Forecast by Sales Channel, 2020 to 2035
- Table 57: East Asia Market Value (USD Mn) Forecast by End Use, 2020 to 2035
- Table 58: East Asia Market Volume (Liters) Forecast by End Use, 2020 to 2035
- Table 59: East Asia Market Value (USD Mn) Forecast by Nature, 2020 to 2035
- Table 60: East Asia Market Volume (Liters) Forecast by Nature, 2020 to 2035
- Table 61: South Asia Pacific Market Value (USD Mn) Forecast by Country, 2020 to 2035
- Table 62: South Asia Pacific Market Volume (Liters) Forecast by Country, 2020 to 2035
- Table 63: South Asia Pacific Market Value (USD Mn) Forecast by Flavor Type, 2020 to 2035
- Table 64: South Asia Pacific Market Volume (Liters) Forecast by Flavor Type, 2020 to 2035
- Table 65: South Asia Pacific Market Value (USD Mn) Forecast by Content Type, 2020 to 2035
- Table 66: South Asia Pacific Market Volume (Liters) Forecast by Content Type, 2020 to 2035
- Table 67: South Asia Pacific Market Value (USD Mn) Forecast by Sales Channel, 2020 to 2035
- Table 68: South Asia Pacific Market Volume (Liters) Forecast by Sales Channel, 2020 to 2035
- Table 69: South Asia Pacific Market Value (USD Mn) Forecast by End Use, 2020 to 2035
- Table 70: South Asia Pacific Market Volume (Liters) Forecast by End Use, 2020 to 2035
- Table 71: South Asia Pacific Market Value (USD Mn) Forecast by Nature, 2020 to 2035
- Table 72: South Asia Pacific Market Volume (Liters) Forecast by Nature, 2020 to 2035
- Table 73: Eastern Europe Market Value (USD Mn) Forecast by Country, 2020 to 2035
- Table 74: Eastern Europe Market Volume (Liters) Forecast by Country, 2020 to 2035
- Table 75: Eastern Europe Market Value (USD Mn) Forecast by Flavor Type, 2020 to 2035
- Table 76: Eastern Europe Market Volume (Liters) Forecast by Flavor Type, 2020 to 2035
- Table 77: Eastern Europe Market Value (USD Mn) Forecast by Content Type, 2020 to 2035
- Table 78: Eastern Europe Market Volume (Liters) Forecast by Content Type, 2020 to 2035
- Table 79: Eastern Europe Market Value (USD Mn) Forecast by Sales Channel, 2020 to 2035
- Table 80: Eastern Europe Market Volume (Liters) Forecast by Sales Channel, 2020 to 2035
- Table 81: Eastern Europe Market Value (USD Mn) Forecast by End Use, 2020 to 2035
- Table 82: Eastern Europe Market Volume (Liters) Forecast by End Use, 2020 to 2035
- Table 83: Eastern Europe Market Value (USD Mn) Forecast by Nature, 2020 to 2035
- Table 84: Eastern Europe Market Volume (Liters) Forecast by Nature, 2020 to 2035
- Table 85: Middle East & Africa Market Value (USD Mn) Forecast by Country, 2020 to 2035
- Table 86: Middle East & Africa Market Volume (Liters) Forecast by Country, 2020 to 2035
- Table 87: Middle East & Africa Market Value (USD Mn) Forecast by Flavor Type, 2020 to 2035
- Table 88: Middle East & Africa Market Volume (Liters) Forecast by Flavor Type, 2020 to 2035
- Table 89: Middle East & Africa Market Value (USD Mn) Forecast by Content Type, 2020 to 2035
- Table 90: Middle East & Africa Market Volume (Liters) Forecast by Content Type, 2020 to 2035
- Table 91: Middle East & Africa Market Value (USD Mn) Forecast by Sales Channel, 2020 to 2035
- Table 92: Middle East & Africa Market Volume (Liters) Forecast by Sales Channel, 2020 to 2035
- Table 93: Middle East & Africa Market Value (USD Mn) Forecast by End Use, 2020 to 2035
- Table 94: Middle East & Africa Market Volume (Liters) Forecast by End Use, 2020 to 2035
- Table 95: Middle East & Africa Market Value (USD Mn) Forecast by Nature, 2020 to 2035
- Table 96: Middle East & Africa Market Volume (Liters) Forecast by Nature, 2020 to 2035
List Of Figures
- Figure 1: Global Market Volume (Liters) Forecast 2020 to 2035
- Figure 2: Global Market Pricing Analysis
- Figure 3: Global Market Value (USD Mn) Forecast 2020 to 2035
- Figure 4: Global Market Value Share and BPS Analysis by Flavor Type, 2025 to 2035
- Figure 5: Global Market Y-o-Y Growth Comparison by Flavor Type, 2025 to 2035
- Figure 6: Global Market Attractiveness Analysis by Flavor Type
- Figure 7: Global Market Value Share and BPS Analysis by Content Type, 2025 to 2035
- Figure 8: Global Market Y-o-Y Growth Comparison by Content Type, 2025 to 2035
- Figure 9: Global Market Attractiveness Analysis by Content Type
- Figure 10: Global Market Value Share and BPS Analysis by Sales Channel, 2025 to 2035
- Figure 11: Global Market Y-o-Y Growth Comparison by Sales Channel, 2025 to 2035
- Figure 12: Global Market Attractiveness Analysis by Sales Channel
- Figure 13: Global Market Value Share and BPS Analysis by End Use, 2025 to 2035
- Figure 14: Global Market Y-o-Y Growth Comparison by End Use, 2025 to 2035
- Figure 15: Global Market Attractiveness Analysis by End Use
- Figure 16: Global Market Value Share and BPS Analysis by Nature, 2025 to 2035
- Figure 17: Global Market Y-o-Y Growth Comparison by Nature, 2025 to 2035
- Figure 18: Global Market Attractiveness Analysis by Nature
- Figure 19: Global Market Value (USD Mn) Share and BPS Analysis by Region, 2025 to 2035
- Figure 20: Global Market Y-o-Y Growth Comparison by Region, 2025 to 2035
- Figure 21: Global Market Attractiveness Analysis by Region
- Figure 22: North America Market Incremental $ Opportunity, 2025 to 2035
- Figure 23: Latin America Market Incremental $ Opportunity, 2025 to 2035
- Figure 24: Western Europe Market Incremental $ Opportunity, 2025 to 2035
- Figure 25: East Asia Market Incremental $ Opportunity, 2025 to 2035
- Figure 26: South Asia Pacific Market Incremental $ Opportunity, 2025 to 2035
- Figure 27: Eastern Europe Market Incremental $ Opportunity, 2025 to 2035
- Figure 28: Middle East & Africa Market Incremental $ Opportunity, 2025 to 2035
- Figure 29: North America Market Value Share and BPS Analysis by Country, 2025 to 2035
- Figure 30: North America Market Value Share and BPS Analysis by Flavor Type, 2025 to 2035
- Figure 31: North America Market Y-o-Y Growth Comparison by Flavor Type, 2025 to 2035
- Figure 32: North America Market Attractiveness Analysis by Flavor Type
- Figure 33: North America Market Value Share and BPS Analysis by Content Type, 2025 to 2035
- Figure 34: North America Market Y-o-Y Growth Comparison by Content Type, 2025 to 2035
- Figure 35: North America Market Attractiveness Analysis by Content Type
- Figure 36: North America Market Value Share and BPS Analysis by Sales Channel, 2025 to 2035
- Figure 37: North America Market Y-o-Y Growth Comparison by Sales Channel, 2025 to 2035
- Figure 38: North America Market Attractiveness Analysis by Sales Channel
- Figure 39: North America Market Value Share and BPS Analysis by End Use, 2025 to 2035
- Figure 40: North America Market Y-o-Y Growth Comparison by End Use, 2025 to 2035
- Figure 41: North America Market Attractiveness Analysis by End Use
- Figure 42: North America Market Value Share and BPS Analysis by Nature, 2025 to 2035
- Figure 43: North America Market Y-o-Y Growth Comparison by Nature, 2025 to 2035
- Figure 44: North America Market Attractiveness Analysis by Nature
- Figure 45: Latin America Market Value Share and BPS Analysis by Country, 2025 to 2035
- Figure 46: Latin America Market Value Share and BPS Analysis by Flavor Type, 2025 to 2035
- Figure 47: Latin America Market Y-o-Y Growth Comparison by Flavor Type, 2025 to 2035
- Figure 48: Latin America Market Attractiveness Analysis by Flavor Type
- Figure 49: Latin America Market Value Share and BPS Analysis by Content Type, 2025 to 2035
- Figure 50: Latin America Market Y-o-Y Growth Comparison by Content Type, 2025 to 2035
- Figure 51: Latin America Market Attractiveness Analysis by Content Type
- Figure 52: Latin America Market Value Share and BPS Analysis by Sales Channel, 2025 to 2035
- Figure 53: Latin America Market Y-o-Y Growth Comparison by Sales Channel, 2025 to 2035
- Figure 54: Latin America Market Attractiveness Analysis by Sales Channel
- Figure 55: Latin America Market Value Share and BPS Analysis by End Use, 2025 to 2035
- Figure 56: Latin America Market Y-o-Y Growth Comparison by End Use, 2025 to 2035
- Figure 57: Latin America Market Attractiveness Analysis by End Use
- Figure 58: Latin America Market Value Share and BPS Analysis by Nature, 2025 to 2035
- Figure 59: Latin America Market Y-o-Y Growth Comparison by Nature, 2025 to 2035
- Figure 60: Latin America Market Attractiveness Analysis by Nature
- Figure 61: Western Europe Market Value Share and BPS Analysis by Country, 2025 to 2035
- Figure 62: Western Europe Market Value Share and BPS Analysis by Flavor Type, 2025 to 2035
- Figure 63: Western Europe Market Y-o-Y Growth Comparison by Flavor Type, 2025 to 2035
- Figure 64: Western Europe Market Attractiveness Analysis by Flavor Type
- Figure 65: Western Europe Market Value Share and BPS Analysis by Content Type, 2025 to 2035
- Figure 66: Western Europe Market Y-o-Y Growth Comparison by Content Type, 2025 to 2035
- Figure 67: Western Europe Market Attractiveness Analysis by Content Type
- Figure 68: Western Europe Market Value Share and BPS Analysis by Sales Channel, 2025 to 2035
- Figure 69: Western Europe Market Y-o-Y Growth Comparison by Sales Channel, 2025 to 2035
- Figure 70: Western Europe Market Attractiveness Analysis by Sales Channel
- Figure 71: Western Europe Market Value Share and BPS Analysis by End Use, 2025 to 2035
- Figure 72: Western Europe Market Y-o-Y Growth Comparison by End Use, 2025 to 2035
- Figure 73: Western Europe Market Attractiveness Analysis by End Use
- Figure 74: Western Europe Market Value Share and BPS Analysis by Nature, 2025 to 2035
- Figure 75: Western Europe Market Y-o-Y Growth Comparison by Nature, 2025 to 2035
- Figure 76: Western Europe Market Attractiveness Analysis by Nature
- Figure 77: East Asia Market Value Share and BPS Analysis by Country, 2025 to 2035
- Figure 78: East Asia Market Value Share and BPS Analysis by Flavor Type, 2025 to 2035
- Figure 79: East Asia Market Y-o-Y Growth Comparison by Flavor Type, 2025 to 2035
- Figure 80: East Asia Market Attractiveness Analysis by Flavor Type
- Figure 81: East Asia Market Value Share and BPS Analysis by Content Type, 2025 to 2035
- Figure 82: East Asia Market Y-o-Y Growth Comparison by Content Type, 2025 to 2035
- Figure 83: East Asia Market Attractiveness Analysis by Content Type
- Figure 84: East Asia Market Value Share and BPS Analysis by Sales Channel, 2025 to 2035
- Figure 85: East Asia Market Y-o-Y Growth Comparison by Sales Channel, 2025 to 2035
- Figure 86: East Asia Market Attractiveness Analysis by Sales Channel
- Figure 87: East Asia Market Value Share and BPS Analysis by End Use, 2025 to 2035
- Figure 88: East Asia Market Y-o-Y Growth Comparison by End Use, 2025 to 2035
- Figure 89: East Asia Market Attractiveness Analysis by End Use
- Figure 90: East Asia Market Value Share and BPS Analysis by Nature, 2025 to 2035
- Figure 91: East Asia Market Y-o-Y Growth Comparison by Nature, 2025 to 2035
- Figure 92: East Asia Market Attractiveness Analysis by Nature
- Figure 93: South Asia Pacific Market Value Share and BPS Analysis by Country, 2025 to 2035
- Figure 94: South Asia Pacific Market Value Share and BPS Analysis by Flavor Type, 2025 to 2035
- Figure 95: South Asia Pacific Market Y-o-Y Growth Comparison by Flavor Type, 2025 to 2035
- Figure 96: South Asia Pacific Market Attractiveness Analysis by Flavor Type
- Figure 97: South Asia Pacific Market Value Share and BPS Analysis by Content Type, 2025 to 2035
- Figure 98: South Asia Pacific Market Y-o-Y Growth Comparison by Content Type, 2025 to 2035
- Figure 99: South Asia Pacific Market Attractiveness Analysis by Content Type
- Figure 100: South Asia Pacific Market Value Share and BPS Analysis by Sales Channel, 2025 to 2035
- Figure 101: South Asia Pacific Market Y-o-Y Growth Comparison by Sales Channel, 2025 to 2035
- Figure 102: South Asia Pacific Market Attractiveness Analysis by Sales Channel
- Figure 103: South Asia Pacific Market Value Share and BPS Analysis by End Use, 2025 to 2035
- Figure 104: South Asia Pacific Market Y-o-Y Growth Comparison by End Use, 2025 to 2035
- Figure 105: South Asia Pacific Market Attractiveness Analysis by End Use
- Figure 106: South Asia Pacific Market Value Share and BPS Analysis by Nature, 2025 to 2035
- Figure 107: South Asia Pacific Market Y-o-Y Growth Comparison by Nature, 2025 to 2035
- Figure 108: South Asia Pacific Market Attractiveness Analysis by Nature
- Figure 109: Eastern Europe Market Value Share and BPS Analysis by Country, 2025 to 2035
- Figure 110: Eastern Europe Market Value Share and BPS Analysis by Flavor Type, 2025 to 2035
- Figure 111: Eastern Europe Market Y-o-Y Growth Comparison by Flavor Type, 2025 to 2035
- Figure 112: Eastern Europe Market Attractiveness Analysis by Flavor Type
- Figure 113: Eastern Europe Market Value Share and BPS Analysis by Content Type, 2025 to 2035
- Figure 114: Eastern Europe Market Y-o-Y Growth Comparison by Content Type, 2025 to 2035
- Figure 115: Eastern Europe Market Attractiveness Analysis by Content Type
- Figure 116: Eastern Europe Market Value Share and BPS Analysis by Sales Channel, 2025 to 2035
- Figure 117: Eastern Europe Market Y-o-Y Growth Comparison by Sales Channel, 2025 to 2035
- Figure 118: Eastern Europe Market Attractiveness Analysis by Sales Channel
- Figure 119: Eastern Europe Market Value Share and BPS Analysis by End Use, 2025 to 2035
- Figure 120: Eastern Europe Market Y-o-Y Growth Comparison by End Use, 2025 to 2035
- Figure 121: Eastern Europe Market Attractiveness Analysis by End Use
- Figure 122: Eastern Europe Market Value Share and BPS Analysis by Nature, 2025 to 2035
- Figure 123: Eastern Europe Market Y-o-Y Growth Comparison by Nature, 2025 to 2035
- Figure 124: Eastern Europe Market Attractiveness Analysis by Nature
- Figure 125: Middle East & Africa Market Value Share and BPS Analysis by Country, 2025 to 2035
- Figure 126: Middle East & Africa Market Value Share and BPS Analysis by Flavor Type, 2025 to 2035
- Figure 127: Middle East & Africa Market Y-o-Y Growth Comparison by Flavor Type, 2025 to 2035
- Figure 128: Middle East & Africa Market Attractiveness Analysis by Flavor Type
- Figure 129: Middle East & Africa Market Value Share and BPS Analysis by Content Type, 2025 to 2035
- Figure 130: Middle East & Africa Market Y-o-Y Growth Comparison by Content Type, 2025 to 2035
- Figure 131: Middle East & Africa Market Attractiveness Analysis by Content Type
- Figure 132: Middle East & Africa Market Value Share and BPS Analysis by Sales Channel, 2025 to 2035
- Figure 133: Middle East & Africa Market Y-o-Y Growth Comparison by Sales Channel, 2025 to 2035
- Figure 134: Middle East & Africa Market Attractiveness Analysis by Sales Channel
- Figure 135: Middle East & Africa Market Value Share and BPS Analysis by End Use, 2025 to 2035
- Figure 136: Middle East & Africa Market Y-o-Y Growth Comparison by End Use, 2025 to 2035
- Figure 137: Middle East & Africa Market Attractiveness Analysis by End Use
- Figure 138: Middle East & Africa Market Value Share and BPS Analysis by Nature, 2025 to 2035
- Figure 139: Middle East & Africa Market Y-o-Y Growth Comparison by Nature, 2025 to 2035
- Figure 140: Middle East & Africa Market Attractiveness Analysis by Nature
- FAQs -
What was the Global Flavor Drops Market Size Reported by Fact.MR for 2025?
The global flavor drops market was valued at USD 116.2 million in 2025.
Who are the Major Players Operating in the Flavor Drops Market?
Prominent players in the market are Capella Flavors, ESN, Flavor West Flavorah, among others.
What is the Estimated Valuation of the Flavor Drops Market in 2035?
The market is expected to reach a valuation of USD 309.7 million in 2035.
What Value CAGR did the Flavor Drops Market Exhibit Over the Last Five Years?
The historic growth rate of the flavor drops market was 9.2% from 2020-2024.