- Market Value (2025): USD 2.9 Bn
- Estimated Value (2026): USD 3.3 Bn
- Forecast Value (2036): USD 12.3 Bn
- CAGR (2026-2036): 14.1%
What is the Gridscale Monitoring Tools Market forecast to be worth by 2036?
USD 3.3 billion in 2026 to USD 12.3 billion by 2036 at a 14.1% CAGR.
- The Gridscale Monitoring Tools Market reached USD 2.9 billion in 2025.
- Demand is projected to increase from USD 3.3 billion in 2026 to USD 12.3 billion by 2036.
- The market is forecast to record 14.1% CAGR from 2026 to 2036 as transmission operators, distribution utilities, reliability coordinators, renewable-grid planners and protection teams expand qualified purchasing and deployment.
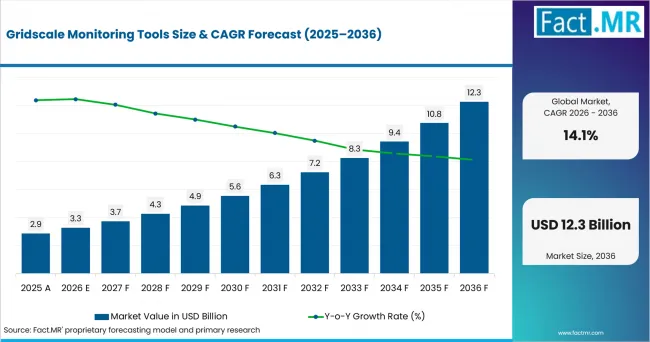
Gridscale Monitoring Tools Value Analysis | Source: Fact.MR
What are the defining numbers behind Gridscale Monitoring Tools Market growth?
The 2026 to 2036 value gain is expected to reach USD 9.0 billion.
- Demand Drivers in the Market
- Inverter-based resources change system inertia and fault behavior, increasing the value of synchronized voltage, current, phase and frequency measurements.
- FERC Order No. 881 requires transmission providers to use ambient-adjusted ratings for near-term transmission service. Dynamic line ratings are a separate, more granular approach that can incorporate additional weather and conductor-condition inputs.
- Utilities need wide-area views of oscillations, congestion and asset condition as power flows become less predictable across regions.
- Key Segments Analyzed
- By Tool Type: PMU / synchrophasor analytics is expected to hold 24.0% share in 2026 because synchronized phasor measurements allow operators to compare phase angle, frequency and voltage across geographically separated grid locations.
- By Grid Level: Transmission is projected to account for 45.0% share in 2026 as transmission operators require wide-area visibility to detect disturbances, congestion and other conditions that can propagate across interconnected control areas.
- By Data: Voltage/current waveform is anticipated to capture 29.0% share in 2026 because waveform data supports fault analysis, power-quality assessment and equipment-condition monitoring from a common measurement base.
- By Use Case: Stability / oscillation detection is estimated to represent 27.0% share in 2026 because time-aligned measurements help operators identify poorly damped oscillatory behavior before it develops into a broader grid-stability concern.
- Analyst Opinion at Fact.MR
- Shambhu Nath Jha, Principal Consultant, Fact.MR, states, "Gridscale monitoring is valuable when synchronized measurements change an operating decision. Utilities will demand traceable analytics that fit control-room procedures and explain capacity or stability alerts."
- Strategic Implications
- PMU and synchrophasor deployments should prioritize time synchronization, data quality, interoperability and secure integration with control-room systems.
- Oscillation-monitoring applications should document how time-aligned measurements are converted into actionable stability information.
- AI- or model-based analytics should be validated against operational data before they are used in reliability-sensitive decisions.
- Digital monitoring platforms should define interfaces with existing SCADA/EMS and cybersecurity controls before scale-up.
How does the Gridscale Monitoring Tools Market break down by segment?
The Gridscale Monitoring Tools Market is analyzed by Tool Type, Grid Level, Data, and Use Case.
Why does PMU / synchrophasor analytics lead Tool Type?
The PMU / synchrophasor analytics category holds 24.0% share of Tool Type in 2026.
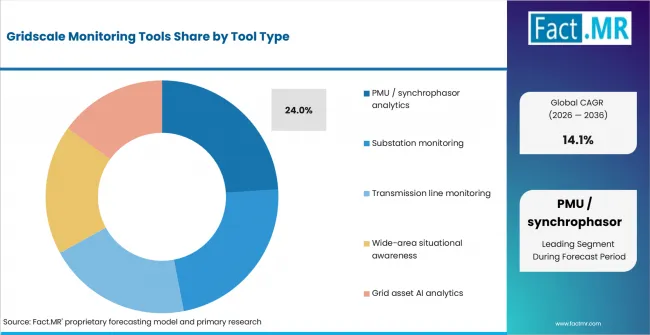
Gridscale Monitoring Tools Analysis By Tool Type | Source: Fact.MR
Synchronized phasor measurements let operators compare phase angle, frequency and voltage across distant grid locations. The lead over Substation monitoring comes from application breadth, not from the segment name itself.
For transmission operators, distribution utilities, reliability coordinators, renewable-grid planners and protection teams, the useful distinction is operational: PMU / synchrophasor analytics must enable dynamic line rating analytics while keeping time-synchronization and data quality within an acceptable project envelope.
Why does Transmission lead Grid Level?
The Transmission category holds 45.0% share of Grid Level in 2026.
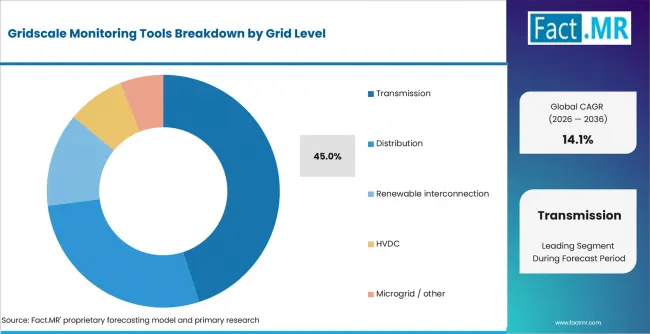
Gridscale Monitoring Tools Analysis By Grid Level | Source: Fact.MR
Transmission operators need wide-area visibility because disturbances and congestion can propagate across control areas. Distribution remains technically credible, but buyer evaluation of wide-area stability and congestion analytics maps more closely to Transmission.
For procurement, an offer built around Transmission becomes repeatable only after suppliers translate PMU-based oscillation detection into evidence that addresses cybersecurity exposure. The decision is therefore rooted in wide-area stability and congestion analytics.
Why does Voltage/current waveform lead Data?
The Voltage/current waveform category holds 29.0% share of Data in 2026.
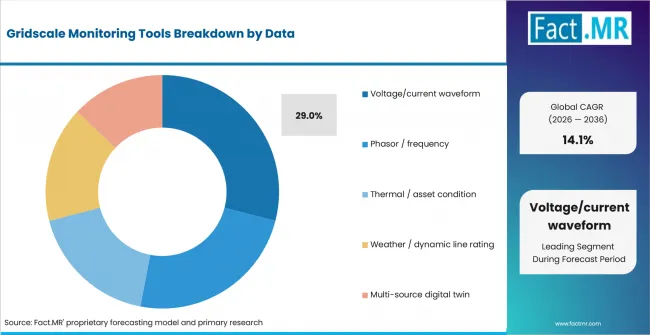
Gridscale Monitoring Tools Analysis By Data | Source: Fact.MR
Voltage and current waveforms support fault, power-quality and equipment-condition analysis from a common measurement base. Compared with Phasor / frequency, its specification is more directly tied to wide-area stability and congestion analytics.
The Voltage/current waveform share creates an opening for multi-source grid digital twins, but not an automatic sale. Wider use still depends on proof that addresses legacy control-center integration.
Why does Stability / oscillation detection lead Use Case?
The Stability / oscillation detection category holds 27.0% share of Use Case in 2026.
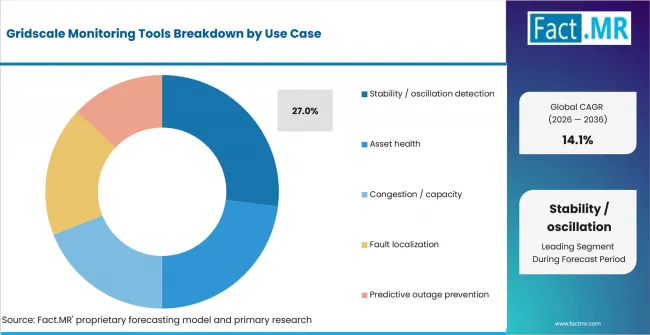
Gridscale Monitoring Tools Analysis By Use Case | Source: Fact.MR
Oscillation detection uses time-aligned measurements to identify poorly damped behavior before it threatens wider stability. Specifications built around Asset health address narrower cases, while the purchasing logic for Stability / oscillation detection reaches further across use case decisions.
A credible offer around Stability / oscillation detection joins product performance with HVDC condition monitoring. If the restraint from model validation for AI outputs remains unresolved, transmission operators, distribution utilities, reliability coordinators, renewable-grid planners and protection teams are more likely to keep deployment narrow.
What is accelerating Gridscale Monitoring Tools Market adoption, and what is holding it back?
Adoption is supported by increasing penetration of inverter-based resources, the need for wide-area visibility of grid oscillations and, in the United States, requirements for more accurate transmission-line ratings. Expansion can be constrained by time-synchronization and data quality, cybersecurity exposure, legacy control-center integration, and model validation for AI outputs.
Drivers Impact Analysis
| DRIVER | (~) % IMPACT ON CAGR | GEOGRAPHIC RELEVANCE | IMPACT TIMELINE |
|---|---|---|---|
| Inverter-based resources change system inertia and fault behavior | +2.5% | Global | Short term (<= 2 years) |
| FERC Order No. 881 requires ambient-adjusted ratings | +2.0% | USA | Medium term (2-4 years) |
| Utilities need wide-area views of oscillations | +1.6% | Germany and UK | Long term (>= 4 yea]rs) |
Source: Fact.MR analysis. Updated Sep 10, 2026
Opportunity Impact Analysis
| OPPORTUNITY | (~) % IMPACT ON CAGR | GEOGRAPHIC RELEVANCE | IMPACT TIMELINE |
|---|---|---|---|
| Dynamic line rating analytics | +1.7% | Global | Medium term (2-4 years) |
| PMU-based oscillation detection | +1.4% | USA and Germany | Short term (<= 2 years) |
| Multi-source grid digital twins | +1.1% | Germany and UK | Long term (>= 4 years) |
| HVDC condition monitoring | +0.8% | Global | Medium term (2-4 years) |
Source: Fact.MR analysis. Updated Sep 10, 2026
Restraints Impact Analysis
| RESTRAINT | (~) % IMPACT ON CAGR | GEOGRAPHIC RELEVANCE | IMPACT TIMELINE |
|---|---|---|---|
| Time-synchronization and data quality | -1.3% | Global | Short term (<= 2 years) |
| Cybersecurity exposure | -1.0% | USA and Germany | Medium term (2-4 years) |
| Legacy control-center integration | -0.8% | Global | Long term (>= 4 years) |
| Model validation for AI outputs | -0.6% | UK and France | Medium term (2-4 years) |
Source: Fact.MR analysis. Updated Sep 10, 2026
Which countries are scaling the Gridscale Monitoring Tools Market through 2036?
- USA: Through 2036, the 14.4% forecast depends on how quickly buyers qualify PMU / synchrophasor analytics and operationalize dynamic line rating analytics.
- Germany: The market advances at 13.8% where PMU-based oscillation detection can overcome the practical drag from cybersecurity exposure.
- UK: Growth of 15.1% reflects a route to market built around multi-source grid digital twins; legacy control-center integration remains the near-term watchpoint.
- France: The expected 14.7% pace is supported by HVDC condition monitoring, although model validation for AI outputs can still delay scale.
- Italy: The demand case, measured at 10.6%, is strongest around PMU / synchrophasor analytics and projects requiring dynamic line rating analytics.
Regions covered are North America, Latin America, Western Europe, Eastern Europe, East Asia, South Asia & Pacific, and Middle East & Africa. These pathways frame the Gridscale Monitoring Tools Market outlook.
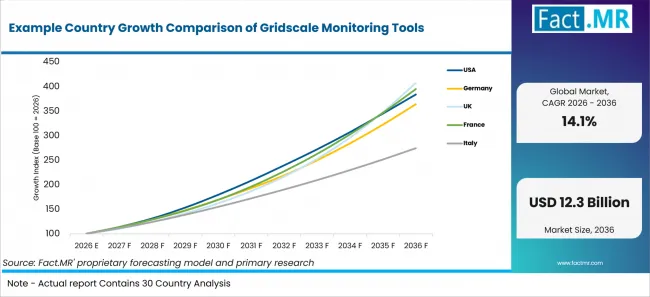
Example Country Growth Comparison Of Gridscale Monitoring Tools | Source: Fact.MR
| Country | CAGR (2026-2036) |
|---|---|
| USA | 14.4% |
| Germany | 13.8% |
| UK | 15.1% |
| France | 14.7% |
| Italy | 10.6% |
Source: Fact.MR analysis. Updated Sep 10, 2026
What is driving USA's growth through 2036?
The 2026 to 2036 outlook points to 14.4% CAGR.
DOE's USD 10.5 billion Grid Resilience and Innovation Partnerships program supports grid flexibility and power-system resilience. DOE's GRIP project page, reflecting information available as of December 2024, reported USD 7.6 billion in announced funding for 105 selected projects through the first two funding rounds.
The conversion from interest to revenue depends on dynamic line rating analytics. In parallel, transmission operators, distribution utilities, reliability coordinators, renewable-grid planners and protection teams will scrutinize time-synchronization and data quality before widening deployment.
What is driving Germany's growth through 2036?
Germany is forecast to record 13.8% CAGR over the assessment period.
Bundesnetzagentur confirmed the Electricity Network Development Plan 2023-2037/2045 in March 2024. It includes around 4,800 km of new transmission lines, about 2,500 km of reinforcement and five new 2-GW HVDC connections.
Adoption will still be uneven. Orders should favor applications where wide-area stability and congestion analytics is measurable and cybersecurity exposure can be assigned before contract award.
What is driving UK's growth through 2036?
UK's market trajectory is 15.1% CAGR between 2026 and 2036.
Ofgem's RIIO-3 Final Determinations cover electricity transmission from 1 April 2026 to 31 March 2031. For National Grid Electricity Transmission, Ofgem allowed GBP 317.4 million in Data and Digitalisation funding.
Suppliers still face a local proof burden. They must show transmission operators, distribution utilities, reliability coordinators, renewable-grid planners and protection teams how the offer manages legacy control-center integration across installation, operation and service.
What is driving France's growth through 2036?
Demand in France is expected to rise at 14.7% CAGR through 2036.
RTE published the main orientations of its 2025 network-development plan in February 2025, setting out a strategy for the high- and very-high-voltage network to 2040.
Commercial expansion depends on HVDC condition monitoring. It also depends on how convincingly suppliers address model validation for AI outputs for buyers working under local technical and budget rules.
What is driving Italy's growth through 2036?
At 10.6% CAGR, Italy develops around a market-specific mix of qualification and deployment.
Terna's 2025-2034 Development Plan provides for more than EUR 23 billion of grid investment, greater renewable integration and higher transmission capacity. Terna also identifies digital tools and platforms as part of network planning.
The second clue comes from procurement. Buyers will reward dynamic line rating analytics only if the commercial package documents control of time-synchronization and data quality.
Who Leads the Gridscale Monitoring Tools Market?
Companies with publicly documented grid-monitoring, synchrophasor or grid-operations offerings include GE Vernova, Hitachi Energy, Siemens, Schneider Electric, SEL, and Danovo Energy Solutions (formerly Quanta Technology).
The market rewards companies that understand the application boundary and can support it through commissioning and service. That combination is important to transmission operators, distribution utilities, reliability coordinators, renewable-grid planners and protection teams. This is the competitive frame for the Gridscale Monitoring Tools Market.
Supplier strategy should focus on making dynamic line rating analytics visible in customer economics while reducing exposure to time-synchronization and data quality.
Which companies are the key providers?
Key companies include GE Vernova, Hitachi Energy, Siemens, Schneider Electric, SEL, and Danovo Energy Solutions (formerly Quanta Technology).
- GE Vernova
- Hitachi Energy
- Siemens
- Schneider Electric
- SEL
- Danovo Energy Solutions (formerly Quanta Technology)
Bibliography
- U.S. Department of Energy, Office of Electricity. (n.d.). Grid Resilience and Innovation Partnerships (GRIP).
- Bundesnetzagentur. (2024, March 1). Bundesnetzagentur confirms Electricity Network Development Plan 2023–2037/2045 for climate-neutral transmission network.
- Ofgem. (2025, December 4). RIIO-3 Final Determinations for the Electricity Transmission, Gas Distribution and Gas Transmission sectors.
- RTE. (2025, March 7). Schéma de développement du réseau 2025 – Synthèse [Network Development Plan 2025 – Summary].
- Terna. (2025, March 14). Terna: 2025 Development Plan for the National Electricity Grid presented.
This Report Answers
- The report explains how the Gridscale Monitoring Tools Market develops across Tool Type and Grid Level.
- Segment analysis identifies PMU / synchrophasor analytics and Transmission as the principal 2026 reference points.
- Country analysis examines USA, Germany, UK, France, and Italy.
- Competitive analysis reviews GE Vernova, Hitachi Energy, Siemens, Schneider Electric, SEL, and Danovo Energy Solutions (formerly Quanta Technology).
- Opportunity analysis covers dynamic line rating analytics, PMU-based oscillation detection, multi-source grid digital twins, and HVDC condition monitoring.
- Risk analysis evaluates time-synchronization and data quality, cybersecurity exposure, legacy control-center integration, and model validation for AI outputs.
What does the Gridscale Monitoring Tools Market cover?
The Gridscale Monitoring Tools Market covers PMU analytics, substation and line monitoring, situational-awareness software and grid-asset AI used at utility scale.
Commercial coverage follows purchases made by transmission operators, distribution utilities, reliability coordinators, renewable-grid planners and protection teams. Revenue is counted when the qualifying product, platform or integrated system is supplied for an in-scope application.
What is included in the scope?
The scope includes PMU analytics, substation and line monitoring, situational-awareness software and grid-asset AI used at utility scale across Tool Type, Grid Level, Data, and Use Case.
Inclusions extend to configuration and integration elements that are inseparable from the in-scope commercial offer. The boundary is applied consistently across USA, Germany, UK, France, and Italy and the seven global regions.
What is excluded from the scope?
The scope excludes customer meters without grid analytics, general weather services, protection relays without monitoring software and manual inspection revenue.
Adjacent categories enter the Gridscale Monitoring Tools Market only when the sold product or service performs the defining function described above. This prevents broader equipment, chemical, software or project revenue from being counted twice.
How Was the Analysis Built?
The analysis draws on 120+ sources, 35+ company portfolios, 25+ countries, and more than 20 industry interviews.
- Primary Research: Primary research includes discussions with manufacturers, service providers, technology developers, distributors, end users, and subject-matter experts. These conversations examine purchasing priorities, product adoption, operational challenges, approval requirements, competitive positioning, and the factors that influence wider market acceptance.
- Desk Research: Desk research covers government statistics, regulatory publications, company filings, trade data, technical studies, industry associations, standards, public policy, and other authoritative sources. Every source used in the analysis is documented in the bibliography.
- Market Sizing and Forecasting: Market estimates combine historical performance, demand indicators, pricing and volume trends, segment shares, company participation, country-level growth, adoption patterns, investment activity, and barriers to market expansion.
- Data Validation and Update Cycle: Findings are validated by comparing primary interviews with public data, company activity, regulatory changes, trade patterns, and industry developments. Regular updates review new product launches, capacity changes, partnerships, approvals, and shifts in commercial adoption.
Segmentation
What is the report's scope and coverage?
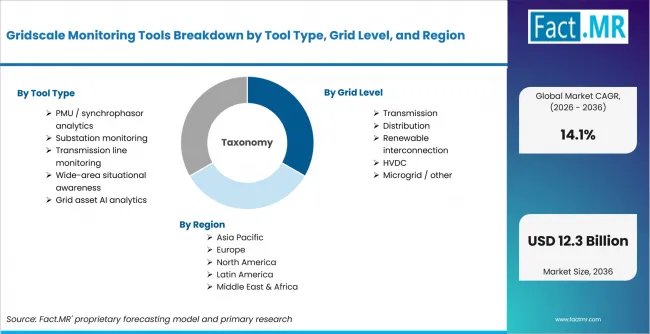
Gridscale Monitoring Tools Breakdown By Tool Type, Grid Level, And Region | Source: Fact.MR
| Attribute | Details |
|---|---|
| Quantitative Units | USD Billion |
| Market Definition | Wide-area measurement, synchrophasor, substation, line and asset-analytics tools used to observe transmission and distribution grid behavior. |
| Tool Type | PMU / synchrophasor analytics; Substation monitoring; Transmission line monitoring; Wide-area situational awareness; Grid asset AI analytics |
| Grid Level | Transmission; Distribution; Renewable interconnection; HVDC; Microgrid / other |
| Data | Voltage/current waveform; Phasor / frequency; Thermal / asset condition; Weather / dynamic line rating; Multi-source digital twin |
| Use Case | Stability / oscillation detection; Asset health; Congestion / capacity; Fault localization; Predictive outage prevention |
| Regions Covered | North America; Latin America; Western Europe; Eastern Europe; East Asia; South Asia & Pacific; Middle East & Africa |
| Countries Covered | USA; Germany; UK; France; Italy |
| Key Companies | GE Vernova; Hitachi Energy; Siemens; Schneider Electric; SEL; Danovo Energy Solutions (formerly Quanta Technology) |
| Forecast Period | 2026 to 2036 |
| Approach | Hybrid top-down and bottom-up assessment using Tool Type, Grid Level, Data, and Use Case, country deployment, replacement demand and company participation. |
Source: Fact.MR analysis. Updated Sep 10, 2026
How is the market segmented?
-
By Tool Type
- PMU / synchrophasor analytics
- Substation monitoring
- Transmission line monitoring
- Wide-area situational awareness
- Grid asset AI analytics
-
By Grid Level
- Transmission
- Distribution
- Renewable interconnection
- HVDC
- Microgrid / other
-
By Data
- Voltage/current waveform
- Phasor / frequency
- Thermal / asset condition
- Weather / dynamic line rating
- Multi-source digital twin
-
By Use Case
- Stability / oscillation detection
- Asset health
- Congestion / capacity
- Fault localization
- Predictive outage prevention
-
By Region
- North America
- Latin America
- Western Europe
- Eastern Europe
- East Asia
- South Asia & Pacific
- Middle East & Africa
Frequently Asked Questions
How big is the Gridscale Monitoring Tools Market in 2026?
What is the CAGR of the Gridscale Monitoring Tools Market from 2026 to 2036?
Which tool type leads the Gridscale Monitoring Tools Market?
Which grid level leads the Gridscale Monitoring Tools Market?
Who are the leading companies in the Gridscale Monitoring Tools Market?
Who worked on this report


Preview the report firsthand - request a free sample
Free SampleGet the brochure for pricing and purchase details
Download PDF