- Market Value (2025): USD 2228.5 Bn
- Estimated Value (2026): USD 2360.0 Bn
- Forecast Value (2036): USD 4186.7 Bn
- CAGR (2026-2036): 5.9%
What is the High Yield Bonds Market forecast to be worth by 2036?
USD 2,360.0 billion in 2026 to USD 4,186.7 billion by 2036 at 5.9% CAGR.
- The high yield bonds market reached USD 2,228.5 billion in 2025 as issuers used below-investment-grade debt for refinancing and growth funding.
- Demand is projected to increase from USD 2,360.0 billion in 2026 to USD 4,186.7 billion by 2036.
- The market is forecast to record 5.9% CAGR from 2026 to 2036. Growth depends on refinancing windows and investor comfort with credit spreads.
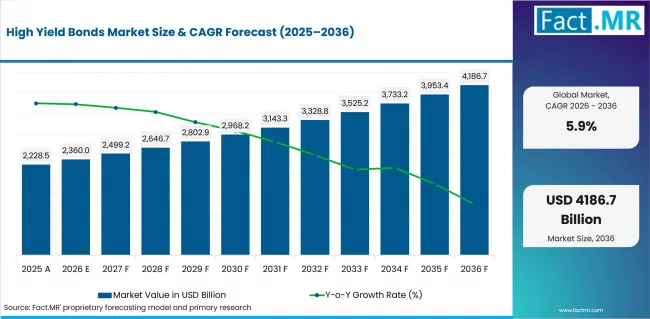
High Yield Bonds Market Value Analysis | Source: Fact.MR
What are the defining numbers behind High Yield Bonds Market growth?
USD 1,826.7 billion absolute opportunity by 2036, led by Corporate High Yield Bonds and Corporate Financing. Institutional Investors and Investment Banks remain the main demand references.
- Demand Drivers in the Market
- Issuer refinancing needs are expected to keep issuance active when cheaper debt access is limited. Buyers look for spread compensation that can cover default risk.
- Institutional investors are anticipated to use high-yield exposure for income generation inside diversified fixed-income portfolios. Clear issuer disclosure helps portfolio teams approve larger mandates.
- Investment banks remain important since underwriting support shapes new issue access. Better placement discipline helps issuers reach qualified buyers without weakening credit review.
- Corporate financing demand is likely to widen when refinancing schedules tighten. Issuers prefer channels that explain covenant terms and maturity risk in simple language.
- Key Segments Analyzed
- By Bond Type: Corporate High Yield Bonds are expected to hold 37.1% share in 2026 since they provide the clearest issuer funding route. BB Rated Bonds and B Rated Bonds meet different risk appetites.
- By Application: Corporate Financing is projected to account for 29.9% share in 2026. Companies use this route when refinancing needs are clear and bank funding is less attractive.
- By End User: Institutional Investors are anticipated to capture 32.2% share in 2026. Their research teams can review issuer risk and handle larger allocations.
- By Distribution Channel: Investment Banks are estimated to represent 32.1% share in 2026. Their underwriting role helps issuers reach buyers during open market windows.
- By Credit Rating: BB Rated is forecast to hold 35.9% share in 2026. Many buyers prefer this band when they want higher income without moving too deep into distressed risk.
- Analyst Opinion at Fact.MR
- Shambhu Nath Jha, Senior Analyst at Fact.MR, states, “High-yield bond demand depends on how well issuers explain credit risk before buyers compare income with default exposure. The market should favor providers that make rating quality and repayment visibility easier to assess.”
- Strategic Implications
- Institutions can set clear rules for bond quality and liquidity before choosing higher returns. This helps control credit risk.
- Asset managers can build trust by explaining why each bond fits the portfolio. Clear withdrawal and cash-access rules also support approval.
- Issuers and arrangers need careful bond placement when market conditions are weak. Clear terms help buyers identify stronger refinancing opportunities.
The USA is expected to record a 7.7% CAGR from 2026 to 2036 due to deep institutional demand. The UK is projected to record a 7.1% CAGR through adviser-led access. Germany is anticipated to grow at 6.5% as credit review stays disciplined. Japan is estimated to post a 5.9% CAGR through cautious income strategies. Canada is forecast at 5.3% as wealth platforms widen access. Australia is likely to reach 4.7% with selective allocation. Brazil is set at 4.1% where distributor support remains central.
How does the High Yield Bonds Market break down by segment?
Corporate High Yield Bonds are expected to lead Bond Type at 37.1% share in 2026. Corporate Financing is projected to lead Application at 29.9% share in 2026.
Which bond type dominates?
Corporate High Yield Bonds are projected to account for 37.1% share in 2026.
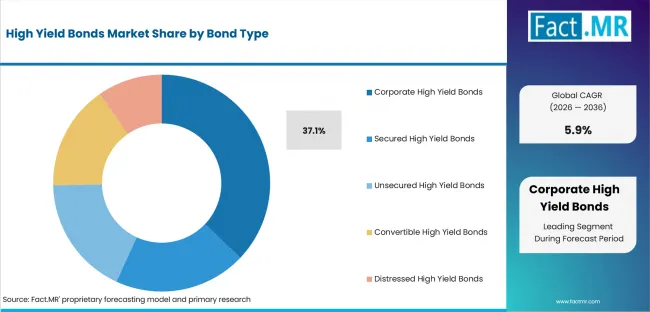
High Yield Bonds Market Analysis By Bond Type | Source: Fact.MR
Corporate High Yield Bonds hold the leading position because they give companies a practical way to refinance debt or fund expansion. Secured High Yield Bonds attract investors seeking collateral support. Convertible High Yield Bonds and Distressed Securities remain limited to strategies that require deeper credit analysis and specialist oversight.
What leads the Application segment?
Corporate Financing is expected to hold 29.9% share in 2026.
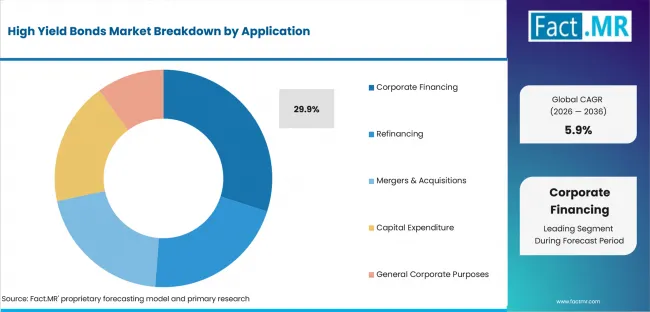
High Yield Bonds Market Analysis By Application | Source: Fact.MR
Companies often turn to Corporate Financing when investment-grade borrowing is unavailable or too restrictive. Working Capital Financing helps cover shorter-term cash needs. Growth Capital Financing and Refinancing gain relevance when issuers can show that the borrowed funds will strengthen operations and support future repayment.
How does End User shape demand?
Institutional Investors are anticipated to lead with 32.2% share in 2026.
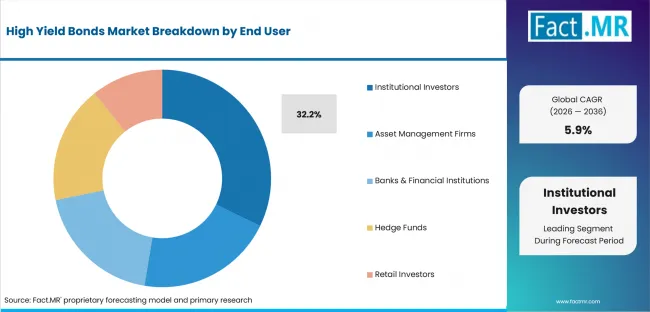
High Yield Bonds Market Analysis By End User | Source: Fact.MR
The largest share comes from Institutional Investors, which have the research teams needed to assess yield, default risk and recovery potential. Pension Funds and Insurance Companies take a more cautious approach because investment mandates may limit lower-rated assets. Asset Management Firms widen market access through managed credit funds and portfolios.
What supports Investment Banks within Distribution Channel?
Investment Banks are estimated to represent 32.1% share in 2026.
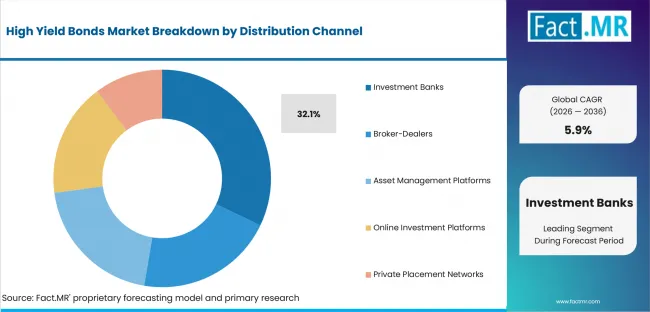
High Yield Bonds Market Analysis By Distribution Channel | Source: Fact.MR
New high-yield bond issues depend heavily on Investment Banks for underwriting, pricing and investor placement. Primary Bond Underwriting helps issuers test demand and set suitable terms. Broker-Dealers and Asset Management Platforms mainly support trading and access after bonds enter the secondary market.
Why does BB Rated lead Credit Rating?
BB Rated is forecast to hold 35.9% share in 2026.
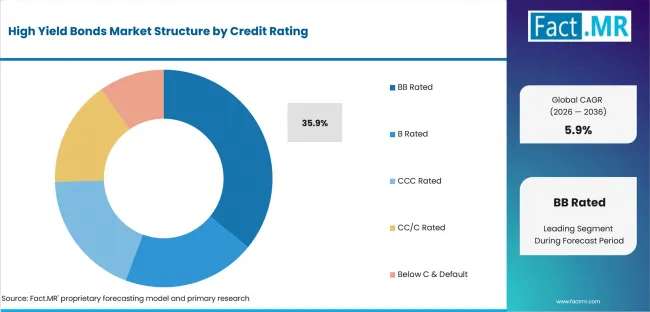
High Yield Bonds Market Analysis By Credit Rating | Source: Fact.MR
Many investors choose BB Rated bonds because they offer higher income without the extreme risk found in weaker credit categories. BB+ and BB- issues still require close review for downgrade pressure. B Rated and CCC Rated bonds appeal mainly to buyers willing to accept greater default risk for higher potential returns.
What is accelerating High Yield Bonds Market adoption, and what is holding it back?
Demand will rise as companies refinance debt and institutions seek higher income. Market volatility and default risk may limit growth.
Drivers Impact Analysis
| DRIVER | QUALITATIVE RELEVANCE | GEOGRAPHIC RELEVANCE | IMPACT TIMELINE |
|---|---|---|---|
| Issuer refinancing demand | High | USA, UK, Germany | Short term (<= 2 years) |
| Institutional income allocation | High | USA, Canada, Australia | Short term (<= 2 years) |
| Underwriting channel depth | Moderate | USA and UK | Medium term (2-4 years) |
| Managed credit product access | Moderate | Canada, Australia, Japan | Medium term (2-4 years) |
| Rating-based portfolio screening | Selective | Germany and Japan | Long term (>= 4 years) |
Source: Fact.MR analysis. Updated Jul 29, 2026
- Issuer refinancing demand: Companies are expected to use high-yield debt when cheaper funding is harder to secure. Clear repayment plans make the issue easier for buyers to review.
- Institutional income allocation: Portfolio teams are likely to add exposure when spread compensation looks fair. Mandate controls decide how much lower-rated debt can be held.
- Underwriting channel depth: Investment banks are expected to improve issuance timing by testing buyer interest before pricing. That reduces execution risk for issuers.
- Managed credit product access: Funds and platforms make high-yield exposure easier for advisers to explain. This matters when clients want income with clearer risk controls.
- Rating-based portfolio screening: Rating bands help buyers separate moderate credit risk from distressed exposure. This gives BB Rated issues a practical review advantage.
Opportunity Impact Analysis
| OPPORTUNITY | QUALITATIVE RELEVANCE | GEOGRAPHIC RELEVANCE | IMPACT TIMELINE |
|---|---|---|---|
| Managed high-yield portfolios | Moderate | USA and UK | Medium term (2-4 years) |
| Credit risk monitoring tools | Moderate | USA, Germany, Japan | Medium term (2-4 years) |
| Adviser-led portfolio packaging | Selective | Canada and Australia | Long term (>= 4 years) |
| Private debt comparison demand | Selective | USA and Brazil | Long term (>= 4 years) |
Source: Fact.MR analysis. Updated Jul 29, 2026
- Managed high-yield portfolios: Managers can build demand by explaining sector exposure and rating limits. The practical benefit is a clearer approval route for investors.
- Credit risk monitoring tools: Buyers need regular checks on spreads and downgrade risk. Better monitoring can reduce fear around holding lower-rated debt.
- Financial advisory services: Advisers can package high-yield exposure with suitability checks. This helps retail-facing channels explain income potential without hiding credit risk.
- Private debt comparison: High-yield bonds can compete for issuers that compare public and private funding. The opportunity improves when public issuance offers better liquidity.
Restraints Impact Analysis
| RESTRAINT | QUALITATIVE RELEVANCE | GEOGRAPHIC RELEVANCE | IMPACT TIMELINE |
|---|---|---|---|
| Spread volatility | Moderate | Global | Short term (<= 2 years) |
| Default and downgrade risk | Moderate | USA, UK, Germany | Short term (<= 2 years) |
| Liquidity pressure in weaker issues | Selective | Brazil and selective markets | Medium term (2-4 years) |
| Suitability limits for retail channels | Selective | Canada and Australia | Long term (>= 4 years) |
Source: Fact.MR analysis. Updated Jul 29, 2026
- Spread volatility: Rapid spread movement can delay allocation decisions. Buyers often wait for clearer pricing before they approve new high-yield exposure.
- Default and downgrade risk: Lower-rated issuers can hurt returns when repayment capacity weakens. This risk makes credit documentation central to adoption.
- Liquidity pressure in weaker issues: Smaller issues can become harder to trade during stress. That limits demand from buyers that need easy exit routes.
- Suitability limits for retail channels: Retail-facing platforms must explain risk in plain language. Weak suitability checks can slow conversion even when income demand is present.
Which countries are scaling High Yield Bonds Market fastest?
The country comparison is defined by a narrow spread between mature financial centers and markets where distribution depth is still developing. The USA and UK form the upper pair through underwriting access and institutional credit review. Germany follows through cautious issuer selection. Japan and Canada move at a measured pace. Australia and Brazil remain more dependent on adviser screening and channel support.
- The USA records the highest listed rate as institutional investors and investment banks support large allocation programs.
- The UK remains above the global figure where advisers and asset managers package high-yield exposure for diversified credit strategies.
- Germany follows a careful route where buyers place weight on issuer disclosure and rating quality before adding exposure.
- Japan develops through conservative fixed-income behavior that favors higher-quality high-yield issues.
- Canada and Australia move close to each other as wealth platforms review high-yield debt through risk controls.
- Brazil grows more gradually as currency risk and investor caution add review work before allocation.
Comparable CAGRs can produce different market entry conditions across these countries. Deployment timing depends on underwriting depth and investor approval processes. Commercial readiness reflects issuer disclosure and secondary-market liquidity. The full report provides country-level CAGR analysis across North America, Latin America, Europe, East Asia, South Asia and Oceania, and the Middle East and Africa.
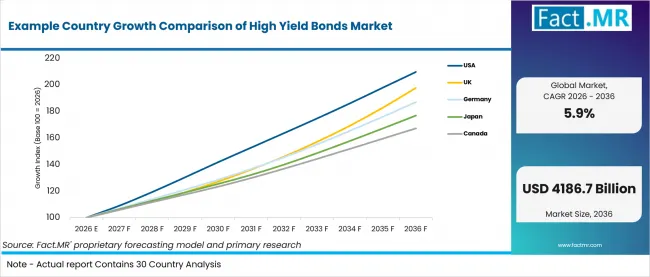
Example Country Growth Comparison Of High Yield Bonds Market | Source: Fact.MR
| Country | CAGR (2026-2036) |
|---|---|
| USA | 7.7% |
| UK | 7.1% |
| Germany | 6.5% |
| Japan | 5.9% |
| Canada | 5.3% |
| Australia | 4.7% |
| Brazil | 4.1% |
Source: Fact.MR analysis. Updated Jul 29, 2026
What supports USA adoption?
7.7% CAGR, supported by institutional allocation depth and active underwriting channels.
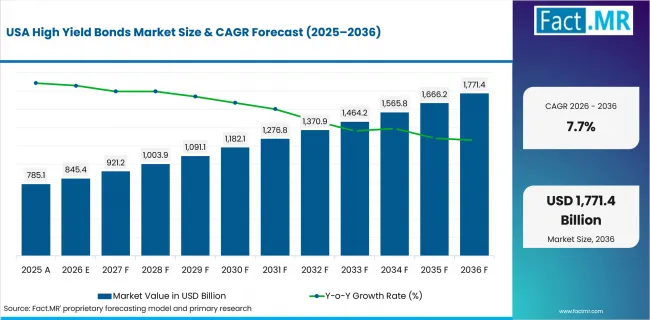
High Yield Bonds Market Country Value Analysis | Source: Fact.MR
USA institutional buyers evaluate spread compensation and issuer disclosure before approving new high-yield exposure. Investment banks help issuers reach qualified investors during open issuance windows. Demand is expected to remain strongest where credit teams can compare income potential with default risk.
What is driving the UK's growth?
7.1% CAGR, backed by adviser-led access and managed credit products.
UK demand is expected to move through asset managers and advisers that package high-yield bonds inside diversified credit strategies. Corporate Financing remains relevant where issuers need refinancing flexibility. Wider use depends on product documents that explain liquidity limits and income objectives clearly.
How is Germany developing demand?
6.5% CAGR, led by disciplined credit review and issuer-quality screening.
Germany shows a cautious route where institutional investors test issuer strength before allocation. BB Rated exposure is expected to gain preference because it balances income with clearer credit quality. Broader adoption depends on covenant review and reliable secondary-market pricing.
What shapes Japan's outlook through 2036?
5.9% CAGR, shaped by conservative income strategies and higher-quality selection.
Japan is expected to favor controlled credit exposure over broad high-yield risk. Investment Banks remain important where structured access and documentation reduce approval friction. Demand is likely to focus on issuers with stronger credit profiles and predictable refinancing capacity.
How does Canada perform?
5.3% CAGR, supported by institutional portfolios and wealth-platform access.
Canada is expected to expand where pension funds and advisory platforms use high-yield debt for income diversification. Buyers remain selective as liquidity can affect portfolio reviews. Demand improves when risk controls are visible at product and issuer level.
What supports Australia's growth?
4.7% CAGR, backed by adviser screening and selective fixed-income allocation.
Australia is expected to remain measured as advisers review high-yield exposure against suitability requirements. Corporate Financing creates selective issuer-side demand. Platforms that make credit risk easier to compare are likely to improve conversion.
What defines Brazil's route to adoption?
4.1% CAGR, shaped by investor caution and distributor-led access.
Brazil is expected to depend on investors that can manage currency and credit-risk concerns. Corporate Financing demand creates issuance opportunities where refinancing needs are clear. Wider adoption requires better issuer disclosure and stronger channel support.
Who leads the High Yield Bonds Market?
BlackRock Inc. and JPMorgan Asset Management show the clearest visibility in the high yield bonds market. PIMCO and Fidelity Investments widen the provider set through established fixed-income platforms.
BlackRock Inc. supports demand through broad fixed-income products and portfolio tools. JPMorgan Asset Management adds credit research and managed bond exposure. PIMCO contributes specialist credit depth and active fixed-income management. Fidelity Investments strengthens retail and adviser-facing access. Capital Group and Vanguard broaden long-term fund participation. Goldman Sachs Asset Management and BNP Paribas Asset Management add institutional credit reach across large client bases.
From 2026 to 2036, competition will depend on strong credit research and clear risk reporting. Providers that explain issuer risk, spreads and liquidity clearly may attract more institutional investors and advisory platforms.
Which companies are the key providers?
Key companies include BlackRock Inc., JPMorgan Asset Management, PIMCO, Fidelity Investments, Capital Group, Vanguard, Goldman Sachs Asset Management, and BNP Paribas Asset Management.
- BlackRock Inc.
- JPMorgan Asset Management
- PIMCO
- Fidelity Investments
- Capital Group
- Vanguard
- Goldman Sachs Asset Management
- BNP Paribas Asset Management
Bibliography
- European Central Bank. (2025, May). Financial stability review, May 2025.
- J.P. Morgan Asset Management. (2025, June 25). Navigating high-yield opportunities: The case for active management in high-yield bond markets.
- Capital Group. (2025, August 17). The strategic value of allocating to high yield.
- BNP Paribas Asset Management. (2025, September 23). European high-yield bonds: Resilience and an improving outlook.
- Vanguard. (2025, September 17). Vanguard launches its first actively managed high-yield bond ETF.
This Report Answers
- The report provides strategic intelligence on the High Yield Bonds Market across Bond Type and Application choices that shape issuer funding and investor allocation.
- Segment analysis covers Corporate High Yield Bonds and Corporate Financing as the share leaders within the 2026 market structure.
- Country outlook evaluates the USA and UK alongside Germany and Japan. Canada, Australia and Brazil complete the growth comparison across the profiled markets.
- Competitive analysis profiles BlackRock Inc. and JPMorgan Asset Management alongside PIMCO and Fidelity Investments. Capital Group and Vanguard complete the provider set with Goldman Sachs Asset Management and BNP Paribas Asset Management.
- Credit-rating assessment covers BB Rated and B Rated issues. CCC Rated and CC/C Rated bonds complete the risk view alongside below-default categories.
What does the High Yield Bonds Market cover?
High-yield bonds cover corporate debt instruments that pay higher yields as issuers carry below-investment-grade credit ratings.
The High Yield Bonds Market covers Corporate High Yield Bonds and secured structures. Unsecured bonds and convertible issues are included when credit risk guides pricing. Coverage extends to corporate financing and refinancing. Working capital funding and mergers and acquisitions are included when they move through high-yield issuance.
The market differs from general bond investing since commercial value comes from pricing credit risk against expected income. Investment-grade corporate debt remains outside the boundary. General equity financing and unrelated private loans are excluded unless demand directly affects high-yield bond issuance or portfolio allocation.
What is included in the scope?
High-yield bonds are used across institutional investors and pension funds. Insurance companies and asset managers are included where mandates allow lower-rated credit exposure.
The scope includes Bond Type and Application alongside End User. Distribution Channel and Credit Rating complete the market view. Coverage spans wealth management platforms and exchange-traded funds. Broker-dealers are included where below-investment-grade risk drives purchase decisions.
What is excluded from the scope?
Investment-grade debt and unrelated equity financing remain outside the scope of this market.
The scope excludes debt that does not carry high-yield risk characteristics. Standalone bank lending is excluded unless it competes with high-yield issuance. General advisory revenue is excluded unless it supports high-yield allocation. Capital markets technology is included only when it supports bond distribution or credit-risk review.
How Was the Analysis Built?
The analysis draws on 120+ sources, 35+ company portfolios, 25+ countries, and more than 20 industry interviews.
- Primary Research: Primary research includes discussions with manufacturers, service providers, technology developers, distributors, end users, procurement teams, and subject-matter experts. These conversations examine purchasing priorities, product adoption, operational challenges, approval requirements, competitive positioning, and the factors that influence wider market acceptance.
- Desk Research: Desk research covers government statistics, regulatory publications, company filings, trade data, technical studies, industry associations, standards, public policy, and other authoritative sources. Every source used in the analysis is documented in the bibliography.
- Market Sizing and Forecasting: Market estimates combine historical performance, demand indicators, pricing and volume trends, segment shares, company participation, country-level growth, adoption patterns, investment activity, and barriers to market expansion.
- Data Validation and Update Cycle: Findings are validated by comparing primary interviews with public data, company activity, regulatory changes, trade patterns, and industry developments. Regular updates review new product launches, capacity changes, partnerships, approvals, procurement trends, and shifts in commercial adoption.
Segmentation
What is the report's scope and coverage?
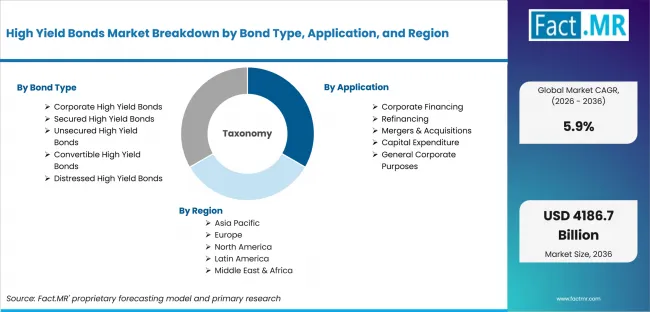
High Yield Bonds Market Breakdown By Bond Type, Application, And Region | Source: Fact.MR
| Attribute | Details |
|---|---|
| Quantitative Units | USD billion in 2026 to USD billion by 2036 at CAGR |
| Market Definition | Commercial issuance and investment activity around below-investment-grade corporate bonds where issuer credit quality and yield compensation guide allocation decisions |
| Bond Type | Corporate High Yield Bonds; Secured High Yield Bonds; Unsecured High Yield Bonds; Convertible High Yield Bonds; Distressed Securities |
| Application | Corporate Financing; Working Capital Financing; Growth Capital Financing; Refinancing; Mergers and Acquisitions |
| End User | Institutional Investors; Pension Funds; Insurance Companies; Asset Management Firms; Hedge Funds |
| Distribution Channel | Investment Banks; Primary Bond Underwriting; Syndicated Bond Offerings; Broker-Dealers; Asset Management Platforms |
| Credit Rating | BB Rated; B Rated; CCC Rated; CC/C Rated; Below C and Defaulted Issues |
| Regions Covered | North America; Latin America; Europe; East Asia; South Asia and Oceania; Middle East and Africa |
| Countries Covered | USA; UK; Germany; Japan; Canada; Australia; Brazil |
| Key Companies Profiled | BlackRock Inc.; JPMorgan Asset Management; PIMCO; Fidelity Investments; Capital Group; Vanguard; Goldman Sachs Asset Management; BNP Paribas Asset Management |
| Forecast Period | 2026 to 2036 |
| Approach | Hybrid top-down and bottom-up approach using issuer refinancing demand; institutional income allocation; underwriting channel depth; managed credit product access; rating-based portfolio screening; spread volatility; default and downgrade risk; liquidity pressure; suitability limits; country adoption patterns and company portfolio review |
Source: Fact.MR analysis. Updated Jul 29, 2026
How is the market segmented?
-
By Bond Type:
- Corporate High Yield Bonds
- Secured High Yield Bonds
- Unsecured High Yield Bonds
- Convertible High Yield Bonds
- Distressed Securities
-
By Application:
- Corporate Financing
- Working Capital Financing
- Growth Capital Financing
- Refinancing
- Mergers and Acquisitions
-
By End User:
- Institutional Investors
- Pension Funds
- Insurance Companies
- Asset Management Firms
- Hedge Funds
-
By Distribution Channel:
- Investment Banks
- Primary Bond Underwriting
- Syndicated Bond Offerings
- Broker-Dealers
- Asset Management Platforms
-
By Credit Rating:
- BB Rated
- B Rated
- CCC Rated
- CC/C Rated
- Below C and Defaulted Issues
-
By Region:
- North America
- Latin America
- Europe
- East Asia
- South Asia and Oceania
- Middle East and Africa
Frequently Asked Questions
Which Bond Type leads the market?
Which Application leads the market?
Which End User category leads the market?
Which Distribution Channel leads the market?
Which Credit Rating leads the market?
Which country records the highest listed CAGR?
What is the primary driver in this market?
What is the main restraint?
Why do Institutional Investors lead demand?
Who worked on this report


Preview the report firsthand - request a free sample
Free SampleGet the brochure for pricing and purchase details
Download PDF