- Market Value (2025): USD 2.2 Bn
- Estimated Value (2026): USD 2.4 Bn
- Forecast Value (2036): USD 6.0 Bn
- CAGR (2026-2036): 9.7%
What is the Integrated 3D Scanners Market forecast to be worth by 2036?
USD 2.4 billion in 2026 to USD 6.0 billion by 2036, at 9.7% CAGR.
- The Integrated 3D Scanners Market crossed a valuation of USD 2.2 billion in 2025.
- Demand is projected to increase from USD 2.4 billion in 2026 to USD 6.0 billion by 2036.
- The market is forecast to record a 9.7% CAGR from 2026 to 2036 supported by faster scan-to-output work.
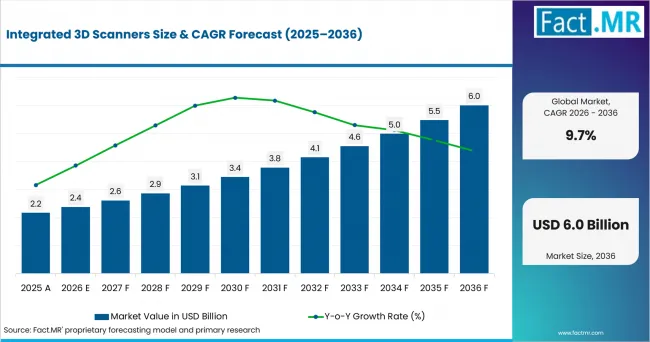
Integrated 3d Scanners Value Analysis | Source: Fact.MR
What are the defining numbers behind Integrated 3D Scanners Market growth?
USD 3.6 billion absolute opportunity by 2036, led by handheld integrated systems, structured light and industrial inspection.
- Demand Drivers in the Market
- Factory quality teams need non-contact 3D measurement supported by calibration records, since complex parts require repeatable checks without slow fixture changes. The International Federation of Robotics reported in September 2025 that 542,000 industrial robots were installed worldwide in 2024.
- Product engineering teams need scan-to-CAD capture linked to industrial metrology systems because legacy parts and prototype changes require usable geometry before redesign work begins.
- Dental laboratories need compact desktop scanning owing to digital restoration files that reduce manual model handling and improve fit-check speed.
- Cultural heritage and consumer product teams need portable long-range capture supported by faster field scanning and easier mesh processing.
- Key Segments Analyzed
- By Scanning Technology: Structured light is expected to hold 32.0% share in 2026 due to its fit for dense surface capture and short inspection cycles.
- By System Form: Handheld integrated is projected to account for 35.0% share in 2026 supported by portable work on dies, fixtures and large components.
- By Accuracy Class: 20-50 µm is anticipated to capture 26.0% share in 2026 owing to its balance between tolerance needs and system cost.
- By Application: Industrial inspection is estimated to represent 31.0% share in 2026 led by factory measurement work in automotive, aerospace and machinery plants.
- Analyst Opinion at Fact.MR
- Shambhu Nath Jha, Principal Consultant at Fact.MR, states, “Integrated scanning is drawing attention because the buyer wants one measured path from part capture to report output. Adoption is projected to expand where accuracy claims are tied to standards and software makes repeat checks easier. Suppliers should combine calibrated hardware, simple workflow software and local service depth.”
- Strategic Implications
- Scanner manufacturers should document accuracy by material, part size and surface condition so quality teams understand where each device fits.
- Software teams should simplify mesh cleanup, CAD comparison and report templates for operators without specialist inspection training.
- Channel partners should build demonstrations for automotive, aerospace and dental users that show full scan-to-report timing.
- Plant engineering teams should define scanner selection around tolerance range, portability and calibration process. The U.S. Bureau of Labor Statistics projected quality control inspector employment to grow 3% from 2025 to 2035. With manufacturing accounting for 64% of quality control inspector employment in 2025, inspection and measurement activities remain embedded in production operations.
Japan is projected to record 11.5% CAGR through 2036 supported by precision manufacturing depth and factory automation. Germany is expected to post 10.2% CAGR due to machinery demand and optical metrology capability. The USA is anticipated to advance at 9.1% CAGR led by manufacturing technology programs. The UK is forecast to hold 7.9% CAGR supported by digital manufacturing policy. France is estimated to record 7.2% CAGR owing to factory extensions and robotics programs.
How does the Integrated 3D Scanners Market break down by segment?
Handheld integrated leads at 35.0%; structured light leads at 32.0%.
Which Scanning Technology dominates?
Structured light holds 32.0% share in 2026.
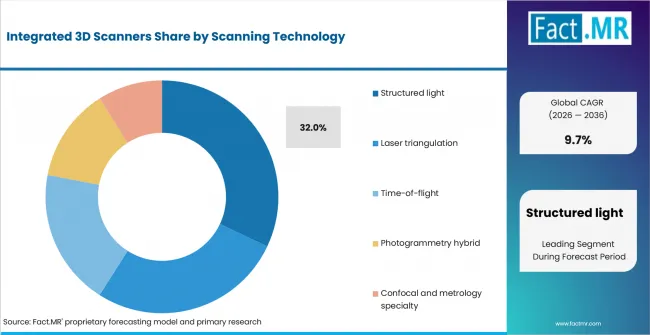
Integrated 3d Scanners Analysis By Scanning Technology | Source: Fact.MR
Structured light is expected to hold 32.0% share in 2026 due to fast surface capture on parts with detailed geometry. Laser triangulation remains relevant for metallic and complex surfaces where line-based data collection helps inspection teams manage edges and curves. Time-of-flight and photogrammetry hybrid scanners support larger objects where distance and field capture carry more weight. The segment connects with 3D machine vision tools where depth data is used for automated checks.
What leads the System Form segment?
Handheld integrated holds 35.0% share in 2026.
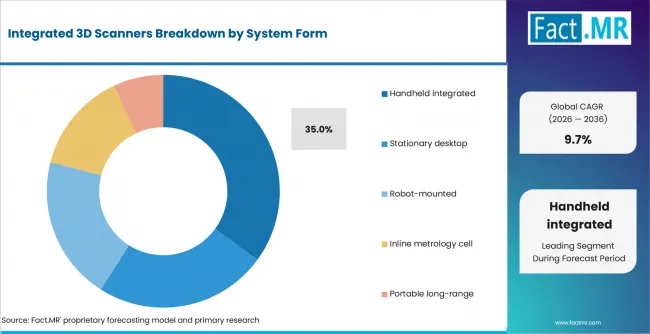
Integrated 3d Scanners Analysis By System Form | Source: Fact.MR
Handheld integrated scanners are projected to account for 35.0% share in 2026 supported by work around fixtures, dies and large components. Stationary desktop systems remain suited to dental and small-part workflows. Robot-mounted systems serve repeatable parts when production teams need consistent positioning. Creaform launched the HandySCAN 3D EVO Series in October 2025, adding wireless capability and direct operator guidance for portable metrology users.
How does Accuracy Class shape demand?
20-50 µm holds 18.0% share in 2026.
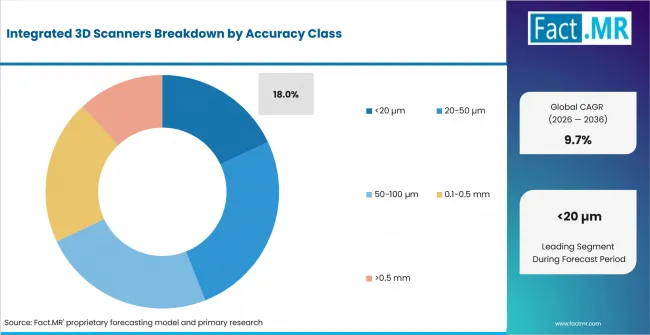
Integrated 3d Scanners Analysis By Accuracy Class | Source: Fact.MR
The 20-50 µm class is anticipated to capture 26.0% share in 2026 owing to its fit for tooling, fixtures and production parts. Sub-20 µm systems serve tighter metrology work where cost and controlled environments are accepted. Wider tolerance classes support large objects and documentation work where coverage outranks micron-level accuracy. FARO launched Leap ST in January 2025 as a handheld 3D metrology scanner for manufacturing and dimensional analysis.
What supports Industrial inspection within Application?
Industrial inspection holds 31.0% share in 2026.
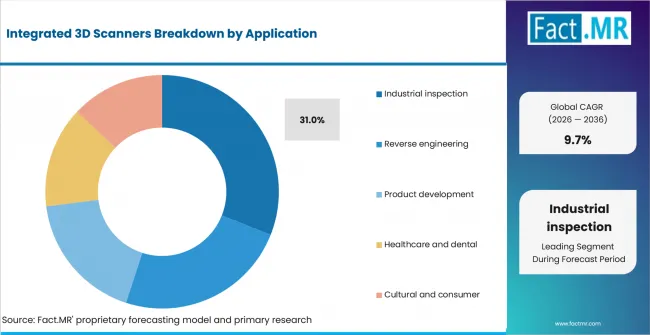
Integrated 3d Scanners Analysis By Application | Source: Fact.MR
Industrial inspection is estimated to represent 31.0% share in 2026 led by defect checks, CAD comparison and fixture validation. Reverse engineering follows where design teams need digital geometry for legacy parts. Product development uses scanners to compare prototypes with CAD models before tooling is locked. Healthcare and dental work remains linked to 3D dental scanners where physical impressions shift toward digital files.
What is accelerating Integrated 3D Scanners Market adoption, and what is holding it back?
Inspection-cycle reduction drives it; calibration cost restrains it.
Drivers Impact Analysis
| DRIVER | (~) % IMPACT ON CAGR | GEOGRAPHIC RELEVANCE | IMPACT TIMELINE |
|---|---|---|---|
| Factory inspection-cycle reduction | +1.5% | Global | Short term (<= 2 years) |
| Portable reverse engineering workflows | +1.2% | North America, Europe, East Asia | Medium term (2-4 years) |
| Automation and robot-cell inspection | +1.0% | Japan, Germany, USA | Medium term (2-4 years) |
| Digital dental and healthcare capture | +0.8% | USA, Japan, Western Europe | Long term (>= 4 years) |
| Cultural and consumer 3D content capture | +0.5% | Europe, North America | Long term (>= 4 years) |
Source: Fact.MR analysis. Updated Sep 5, 2026
- Factory inspection-cycle reduction: Integrated scanning systems can reduce handoffs between data capture, mesh processing, and CAD comparison. Adoption can expand where faster inspection helps manufacturers shorten part-release cycles and reduce delays between machining and quality approval.
- Portable reverse engineering workflows: Handheld scanners help engineers capture legacy-part geometry and convert physical components into usable digital models. Demand can grow across repair, maintenance, redesign, and product-development workflows where accurate measurement is needed directly at the bench or shop floor.
- Automation and robot-cell inspection: Robot-mounted scanners support repeatable inspection of high-volume parts where consistency and automated quality control are important. Integration with optical tracking and production cells can help manufacturers reduce manual inspection effort and improve repeatability across recurring measurement tasks.
- Digital dental and healthcare capture: Dental laboratories can use integrated desktop scanning systems to move efficiently from physical capture to digital restoration design. These workflows reduce dependence on manual model handling and support faster case processing across dental laboratories and related healthcare applications.
- Cultural and consumer 3D content capture: Portable scanners enable museums, designers, and creative teams to convert physical objects into reusable digital models. These systems support documentation, preservation, visualization, product design, and digital-content creation where flexible geometry capture is required.
Opportunity Impact Analysis
| OPPORTUNITY | (~) % IMPACT ON CAGR | GEOGRAPHIC RELEVANCE | IMPACT TIMELINE |
|---|---|---|---|
| Shop-floor semi-automated 3D metrology | +1.1% | Germany, USA, Japan | Short term (<= 2 years) |
| Wireless handheld scanning for large parts | +0.9% | Global | Medium term (2-4 years) |
| Scan-to-CAD software bundles | +0.7% | North America, Europe | Medium term (2-4 years) |
| Inline quality cells for high-mix factories | +0.6% | Europe, East Asia | Long term (>= 4 years) |
Source: Fact.MR analysis. Updated Sep 5, 2026
- Shop-floor semi-automated 3D metrology: Semi-automated scanning stations create a practical upgrade path for repeat inspections close to production. Integrated motion, tilt, and rotation can improve measurement consistency while reducing manual handling during recurring quality-control tasks.
- Wireless handheld scanning for large parts: Wireless scanners reduce cable restrictions when measuring molds, castings, assemblies, and other large components. Battery-powered operation and flexible tracking can shorten setup time and make geometry capture easier across shop-floor and field environments.
- Scan-to-CAD software bundles: Scanner packages combined with reverse-engineering software can reduce the work required to convert point-cloud data into usable CAD models. A single-vendor workflow can simplify deployment for engineering teams focused on repair, redesign, inspection, and product-development tasks.
- Inline quality cells for high-mix factories: Inline metrology cells can support factories that inspect several part families on the same production line. Automated inspection linked with production feedback can improve consistency, reduce manual intervention, and help manufacturers identify dimensional issues earlier in the process.
Restraints Impact Analysis
| RESTRAINT | (~) % IMPACT ON CAGR | GEOGRAPHIC RELEVANCE | IMPACT TIMELINE |
|---|---|---|---|
| Calibration and certification cost | -0.6% | Global | Short term (<= 2 years) |
| Surface reflectivity and part-preparation limits | -0.5% | Aerospace, automotive, dental | Medium term (2-4 years) |
| Operator skill gaps in smaller factories | -0.4% | USA, UK, France | Medium term (2-4 years) |
| Software workflow fragmentation | -0.3% | Global | Long term (>= 4 years) |
Source: Fact.MR analysis. Updated Sep 5, 2026
- Calibration and certification cost: High-accuracy 3D scanning requires traceable calibration and clear verification records before measurement reports are accepted. These requirements can increase operating costs, making embedded calibration status and automated reporting valuable for users managing recurring inspection workflows.
- Surface reflectivity and part-preparation limits: Shiny, dark, or highly reflective surfaces can reduce scan quality when light return is inconsistent. Extra preparation, coatings, or scanning adjustments may therefore be needed in aerospace, dental, polished-metal, and other precision applications.
- Operator skill gaps in smaller factories: Smaller manufacturers may lack staff trained in scan planning, alignment, mesh cleanup, and inspection workflows. Limited in-house expertise can slow adoption unless vendors provide simpler software, training, and application support.
- Software workflow fragmentation: Separate scanning, CAD, inspection, and reporting tools can slow the path from data capture to final analysis. Integrated platforms that reduce manual file transfer and simplify interoperability can improve productivity and support wider deployment.
Which countries are scaling the Integrated 3D Scanners Market through 2036?
- The country comparison spans 4.33 percentage points and forms three practical growth bands across the forecast period.
- Japan remains 1.33 percentage points above Germany supported by precision manufacturing depth and factory automation.
- Germany remains 1.03 percentage points above the USA due to machinery orders and optical metrology capability.
- The USA remains 1.24 percentage points above the UK through manufacturing R&D and automated quality control.
- The UK remains 0.73 percentage point above France as digital manufacturing programs support smaller factories.
- France closes the displayed range through factory extensions, aerospace inspection needs and robotics programs.
Comparable CAGRs create different entry conditions due to automation density, machine-tool activity and software readiness. Full coverage includes North America, Latin America, Western Europe, Eastern Europe, East Asia, South Asia & Pacific, Middle East & Africa.
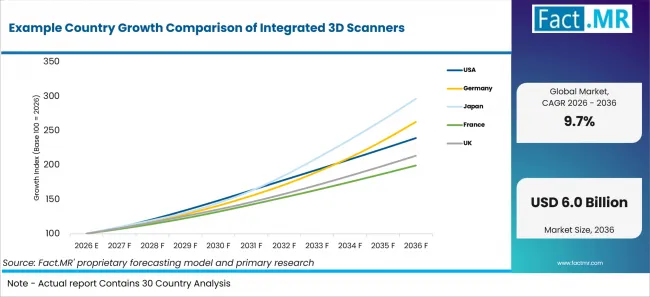
Example Country Growth Comparison Of Integrated 3d Scanners | Source: Fact.MR
| Country | CAGR |
|---|---|
| Japan | 11.5% |
| Germany | 10.2% |
| USA | 9.1% |
| UK | 7.9% |
| France | 7.2% |
Source: Fact.MR analysis. Updated Sep 5, 2026
How is Japan scaling integrated 3D scanner demand?
11.5% CAGR, supported by precision manufacturing and factory automation.
The Statistics Bureau of Japan reported in August 2026 that manufacturing generated JPY 86.8961 trillion in added value in 2024. Japan is projected to record an 11.5% CAGR through 2036, supported by measurement requirements across electronics, automotive and machine-tool manufacturing. Trade.gov’s November 2025 industrial machine-tools guide estimated Japanese machine-tool production at USD 6,022 million in 2025 and identified opportunities in technology upgrades, robotics and software for automation.
What supports Germany’s outlook?
10.2% CAGR, supported by machinery orders and optical metrology depth.
Destatis reported that real new orders in German manufacturing increased 6.4% month on month in December 2025 after seasonal and calendar adjustment, based on subsequently revised figures. Germany is expected to post a 10.2% CAGR through 2036, supported by recurring measurement and quality-control requirements across machinery, automotive and tooling applications. ZEISS introduced ScanPort in May 2025 as a semi-automated 3D metrology system for small and medium-sized parts, with shop-floor mobility and repeatable scanning capabilities for recurring inspection tasks.
What is powering USA adoption?
9.1% CAGR, supported by manufacturing R&D and automated quality control.
Manufacturing USA reported in March 2026 that its network worked with more than 2,900 member organizations, including 1,315 small manufacturers, based on FY2023 network metrics. The USA is anticipated to advance at a 9.1% CAGR through 2036, supported by increasing use of digital inspection and reverse-engineering workflows across manufacturing operations. FARO launched Leap ST in January 2025 as a handheld 3D metrology solution for manufacturing, expanding the availability of portable measurement technologies for production and inspection applications.
How is the UK building demand?
7.9% CAGR, supported by digital manufacturing support and accredited production data.
The Office for National Statistics reported in July 2026 that UK manufacturers’ product sales reached GBP 452.0 billion in 2025. The UK is forecast to record a 7.9% CAGR through 2036, supported by inspection and measurement requirements across aerospace, automotive and smaller manufacturing operations. UK government advanced manufacturing support includes GBP 116 million for firms to access advice and training through the Made Smarter Programme, supporting 5,500 SMEs in adopting advanced industrial technologies.
What underpins France’s growth?
7.2% CAGR, supported by factory extensions and robotics programs.
The Direction générale des Entreprises reported in March 2026 that France recorded a positive industrial-site balance of +19 in 2025, with factory openings and significant expansions exceeding closures and significant reductions in activity. France is estimated to record a 7.2% CAGR through 2036, supported by factory-expansion activity and inspection requirements across advanced manufacturing and aerospace applications. In June 2026, France 2030 announced 31 new projects spanning industrial robotics, drones and additive manufacturing, including automated quality and aircraft-inspection applications that strengthen adjacent automation capabilities in production environments.
Who leads the Integrated 3D Scanners Market?
Hexagon and ZEISS lead direct 3D metrology coverage, while Creaform and FARO strengthen handheld scanning capability.
Hexagon competes through handheld and automated metrology systems that combine measurement hardware with inspection, analysis and reporting software. ZEISS supports industrial users through optical 3D metrology systems, ZEISS INSPECT and ScanPort for semi-automated measurement workflows.
FARO CREAFORM, formed in January 2026 by combining FARO’s 3D Measurement business with Creaform, provides portable and automated dimensional-measurement technologies. Its portfolio incorporates established FARO 3D metrology systems and Creaform handheld scanning capabilities, including the HandySCAN 3D|EVO Series introduced in October 2025.
SHINING 3D competes through its FreeScan family of industrial metrology scanners, while Nikon Metrology supports industrial quality control through APDIS Laser Radar systems for fast, high-precision, non-contact measurement in portable and automated manufacturing environments. Competitive differentiation centers on metrology-grade accuracy, efficient and guided inspection workflows, automation capability and application support.
Which companies are the key providers?
Key companies include Hexagon, ZEISS, Creaform, FARO, SHINING 3D, and Nikon Metrology.
- Hexagon
- ZEISS
- Creaform
- FARO
- SHINING 3D
- Nikon Metrology
Bibliography
- AMETEK, Inc. (2025, July 21). AMETEK completes acquisition of FARO Technologies.
- Creaform. (2025, October 21). 20 years after creating the metrology-grade handheld 3D laser scanner category, Creaform redefines industry standards with the debut of the HandySCAN 3D|EVO Series™.
- Department for Business and Trade. (2026, July 15). Advanced manufacturing.
- Department for Business and Trade, Department for Science, Innovation and Technology, & HM Treasury. (2025, June 23). Technology adoption review 2025.
- Direction générale des Entreprises. (2026, March 29). Baromètre industriel de l’État : en 2025, les extensions d’usines portent la réindustrialisation avec un solde positif malgré un contexte international dégradé.
- Direction générale des Entreprises. (2026, June 19). France 2030 : 31 nouveaux projets pour accélérer l’émergence d’une filière française d’excellence en robotique et en drones souverains.
- FARO Technologies, Inc. (2025, January 23). FARO Technologies pushes 3D metrology forward with new FARO Leap ST.
- Federal Statistical Office (Destatis). (2026, February 5). New orders in manufacturing in December 2025: +7.8% on the previous month.
- Hexagon. (2025, May 8). Hexagon brings automated quality inspection to smaller manufacturing operations and large-scale applications with new PRESTO Quality Stations.
- Hexagon. (2025, October 15). Hexagon makes professional grade 3D scanning accessible to anyone with ATLASCAN Pro.
- International Federation of Robotics. (2025, September 25). World Robotics 2025 report – INDUSTRIAL ROBOTS – released by IFR.
- Manufacturing USA. (2026, March 17). Manufacturing USA releases its 2025 annual report.
- Nikon Metrology, LLC. (2026, April 20). Nikon’s APDIS MV5X Laser Radar sets a new standard for compact, high-speed precision measurement.
- Office for National Statistics. (2026, July 24). UK manufacturers’ sales by product: 2025.
Verified exactly. - SHINING 3D. (2025, February 18). FreeScan Trak ProW: Expanding the boundaries of industrial 3D tracking and scanning systems.
- Statistics Bureau of Japan. (2026, August 28). News Bulletin August 28, 2026 (No. 382).
- International Trade Administration. (2025, November 18). Japan – Industrial machine tools.
- U.S. Bureau of Labor Statistics. (2026, August 27). Quality control inspectors.
- ZEISS Industrial Quality Solutions. (2025, May 27). ZEISS introduces ScanPort, a new dimension in semi-automated 3D metrology.
This Report Addresses
- The report explains integrated 3D scanner use across scanning technology, system form, accuracy class and application.
- Country analysis examines Japan, Germany, the USA, the UK and France through manufacturing and automation evidence.
- Competitive analysis reviews Hexagon, ZEISS, Creaform, FARO, SHINING 3D and Nikon Metrology.
- Technology assessment covers structured light, laser triangulation, time-of-flight and photogrammetry hybrid systems, with adjacent metrology systems context.
- Application assessment covers industrial inspection, reverse engineering, product development and healthcare use, including adjacent dental diagnostic imaging equipment coverage.
- Primary interviews and official source review support the forecast and company validation.
What does the Integrated 3D Scanners Market cover?
Structured light, laser triangulation, time-of-flight and photogrammetry hybrid systems used for 3D measurement.
The Integrated 3D Scanners Market covers hardware and software systems that capture three-dimensional geometry for inspection, design or documentation. It includes devices that combine optics, calibration, processing and reporting alongside metrology and inspection equipment coverage.
The assessment differs from broad surface scanner instruments coverage because it focuses on full 3D geometry capture and workflow integration. Scanner-only components are included when they are sold as part of a complete measurement package.
What is included in the scope?
Integrated 3D scanner systems used in industrial, engineering, dental and documentation workflows.
The scope includes structured light, laser triangulation, time-of-flight and specialty metrology scanners sold as capture-and-output systems. It covers handheld, desktop, robot-mounted, inline and portable long-range forms. Dental workflows include intraoral scanners when hardware and software form a direct workflow. Related digital impression systems depend on 3D geometry capture for restoration files.
What is excluded from the scope?
Standalone cameras, 2D inspection systems and service-only scanning projects are outside the scope.
The scope excludes general photography cameras, 2D-only inspection, standalone 3D CAD software and service-only scanning projects. It also excludes standalone CT systems unless the product is sold directly as an integrated 3D scanner workflow.
How Was the Analysis Built?
The analysis draws on 120+ sources, 35+ company portfolios, 25+ countries, and more than 20 industry interviews.
- Primary Research: Primary research includes discussions with manufacturers, service providers, technology developers, distributors, end users, and subject-matter experts. These conversations examine purchasing priorities, product adoption, operational challenges, approval requirements, competitive positioning, and the factors that influence wider market acceptance.
- Desk Research: Desk research covers government statistics, regulatory publications, company filings, trade data, technical studies, industry associations, standards, public policy, and other authoritative sources. Every source used in the analysis is documented in the bibliography.
- Market Sizing and Forecasting: Market estimates combine historical performance, demand indicators, pricing and volume trends, segment shares, company participation, country-level growth, adoption patterns, investment activity, and barriers to market expansion.
- Data Validation and Update Cycle: Findings are validated by comparing primary interviews with public data, company activity, regulatory changes, trade patterns, and industry developments. Regular updates review new product launches, capacity changes, partnerships, approvals, and shifts in commercial adoption.
Segmentation
What is the report’s scope and coverage?
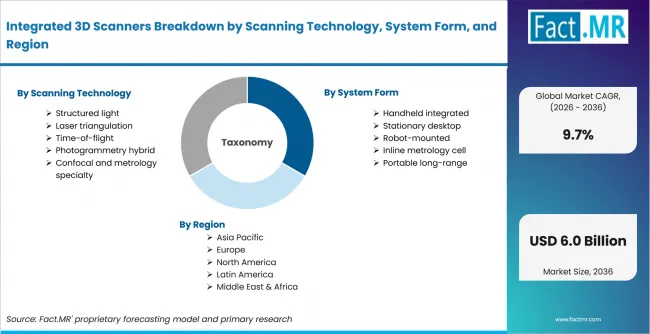
Integrated 3d Scanners Breakdown By Scanning Technology, System Form, And Region | Source: Fact.MR
| Attribute | Details |
|---|---|
| Quantitative Units | USD billion |
| Market Definition | Integrated systems combining 3D capture hardware, calibration and workflow software for inspection, design and documentation. |
| Scanning Technology | Structured light; Laser triangulation; Time-of-flight; Photogrammetry hybrid; Confocal and metrology specialty |
| System Form | Handheld integrated; Stationary desktop; Robot-mounted; Inline metrology cell; Portable long-range |
| Accuracy Class | 20-50 µm; <20 µm; 50-100 µm; 0.1-0.5 mm; >0.5 mm |
| Application | Industrial inspection; Reverse engineering; Product development; Healthcare and dental; Cultural and consumer |
| Regions Covered | North America; Latin America; Western Europe; Eastern Europe; East Asia; South Asia & Pacific; Middle East & Africa |
| Countries Covered | USA; Germany; Japan; France; UK |
| Key Companies Profiled | Hexagon; ZEISS; Creaform; FARO; SHINING 3D; Nikon Metrology |
| Forecast Period | 2026 to 2036 |
| Approach | Hybrid top-down and bottom-up approach using scanner technology mix, system form, accuracy class, application demand, country growth and provider portfolio review. |
Source: Fact.MR analysis. Updated Sep 5, 2026
How is the market segmented?
-
By Scanning Technology
- Structured light
- Laser triangulation
- Time-of-flight
- Photogrammetry hybrid
- Confocal and metrology specialty
-
By System Form
- Handheld integrated
- Stationary desktop
- Robot-mounted
- Inline metrology cell
- Portable long-range
-
By Accuracy Class
- 20-50 µm
- <20 µm
- 50-100 µm
- 0.1-0.5 mm
- >0.5 mm
-
By Application
- Industrial inspection
- Reverse engineering
- Product development
- Healthcare and dental
- Cultural and consumer
-
By Region
- North America
- Latin America
- Western Europe
- Eastern Europe
- East Asia
- South Asia & Pacific
- Middle East & Africa
Frequently Asked Questions
How big is the Integrated 3D Scanners Market in 2026?
What is the CAGR of the Integrated 3D Scanners Market from 2026 to 2036?
Which Scanning Technology leads the Integrated 3D Scanners Market?
Which System Form leads the Integrated 3D Scanners Market?
Who are the leading companies in the Integrated 3D Scanners Market?
Who worked on this report


Preview the report firsthand - request a free sample
Free SampleGet the brochure for pricing and purchase details
Download PDF