- Market Value (2025): USD 272.5 Bn
- Estimated Value (2026): USD 286.4 Bn
- Forecast Value (2036): USD 471.0 Bn
- CAGR (2026-2036): 5.1%
What is the Living Dining Room Market forecast to be worth by 2036?
USD 286.4 billion in 2026 to USD 471.0 billion by 2036 at 5.1% CAGR.
- The living dining room market reached USD 272.5 billion in 2025 as households kept replacing furniture used every day in shared rooms.
- &Demand is projected to increase from USD 286.4 billion in 2026 to USD 471.0 billion by 2036.
- The market is forecast to record 5.1% CAGR from 2026 to 2036.
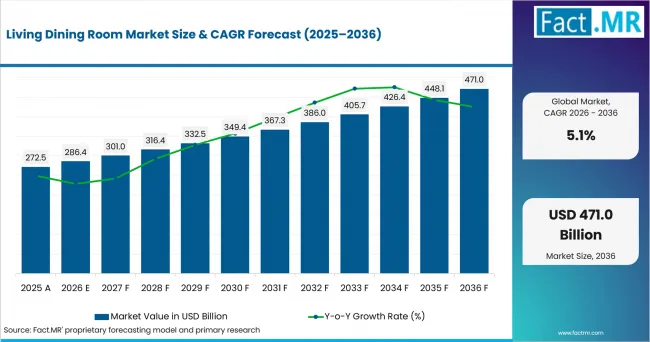
Living Dining Room Market Value Analysis | Source: Fact.MR
What are the defining numbers behind Living Dining Room Market growth?
USD 184.6 billion absolute opportunity by 2036.
- Demand Drivers in the Market
- Living room furniture remains the first purchase reference when buyers update seating and storage before replacing the wider dining layout.
- Residential use is expected to support repeat demand when households move home or repair worn room furniture after long use.
- Furniture retail stores are likely to retain buyer attention as customers still want to check comfort and finish before approval.
- Wood-based formats are anticipated to benefit from familiar quality cues as shoppers compare strength and repair value across price tiers.
- Key Segments Analyzed
- By Product Type: Living Room Furniture is expected to hold 37.3% share in 2026 as seating and storage anchor the first shared-room purchase.
- By Application: Residential is projected to account for 30.9% share in 2026 since home furnishing choices are shaped by daily household use.
- By End User: Households are anticipated to capture 32.4% share in 2026 with homeowners and tenants approving most replacement purchases.
- By Distribution Channel: Furniture Retail Stores are estimated to represent 31.6% share in 2026 due to showroom comparison and service review.
- By Material: Wood is forecast to hold 35.8% share in 2026 as durability and visible finish remain central to buyer approval.
- Analyst Opinion at Fact.MR
- Shambhu Nath Jha, Senior Analyst at Fact.MR, states, “Living and dining room furniture demand is expected to depend on room fit and delivery assurance. Retailers that reduce uncertainty around size and service are better placed than providers selling only on style.”
- Strategic Implications
- Retailers should build room-based assortments around common apartment and family-home layouts.
- Suppliers can improve approval by showing dimensions, material choices and delivery steps before bundled orders are priced.
- Investors should compare Germany and Brazil through replacement behavior instead of headline demand alone.
Germany is expected to record a 6.6% CAGR from 2026 to 2036. Brazil is projected at 6.1%. Australia is anticipated to reach 3.6%. The USA is estimated at 5.6%. Canada is forecast at 4.1%. The UK is likely to record 5.1%. Japan is projected at 4.6%.
How does the Living Dining Room Market break down by segment?
Living Room Furniture is expected to lead Product Type at 37.3% share in 2026. Residential is projected to lead Application at 30.9% share in 2026.
Which product type dominates?
Living Room Furniture is projected to account for 37.3% share in 2026.
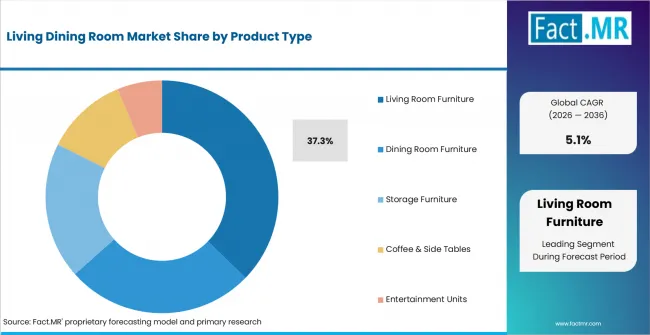
Living Dining Room Market Analysis By Product Type | Source: Fact.MR
Living room furniture leads because it is often the first shared-room purchase buyers compare. Sofas and recliners solve comfort needs. Storage and entertainment units support room organization.
What leads the Application segment?
Residential is expected to hold 30.9% share in 2026.
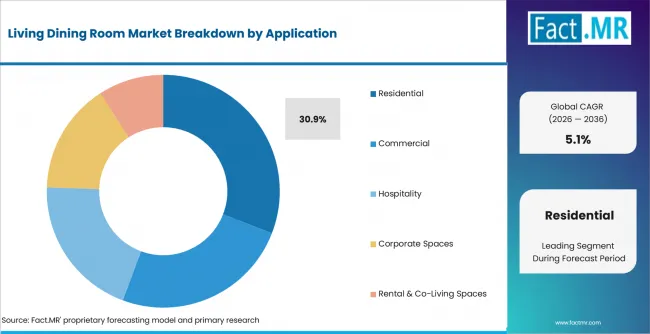
Living Dining Room Market Analysis By Application | Source: Fact.MR
Residential use leads as furniture purchases are shaped by daily meals and family time. Homeowners are likely to approve larger room sets. Tenants often prefer compact pieces that can move easily between homes.
What supports Households within End User?
Households are anticipated to lead with 32.4% share in 2026.
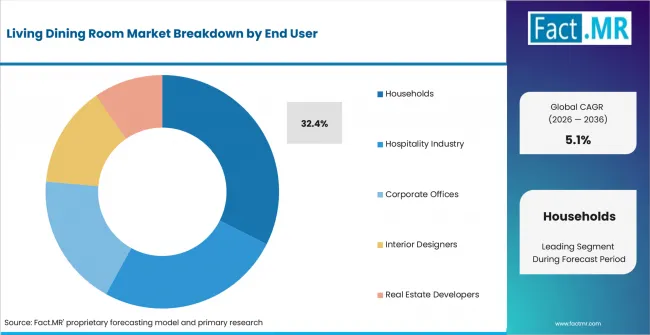
Living Dining Room Market Analysis By End User | Source: Fact.MR
Households lead because homeowners and tenants decide most replacement purchases. Hospitality buyers still create project demand. Commercial customers need budget clearance and service terms before orders move forward.
How does Distribution Channel shape demand?
Furniture Retail Stores are estimated to represent 31.6% share in 2026.
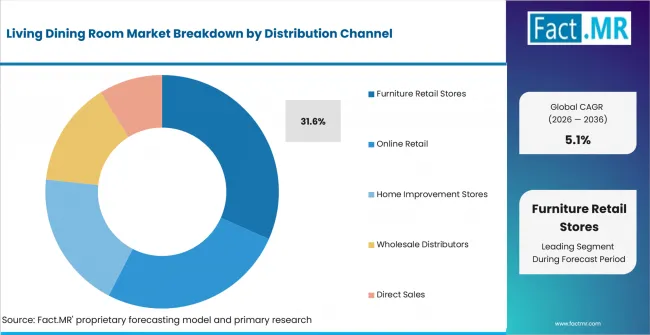
Living Dining Room Market Analysis By Distribution Channel | Source: Fact.MR
Furniture retail stores lead as buyers want to test comfort and inspect finishes. Online retail supports early discovery. The buying path resembles the office furniture when fit and function must be checked before approval.
What supports Wood within the Material segment?
Wood is forecast to hold 35.8% share in 2026.
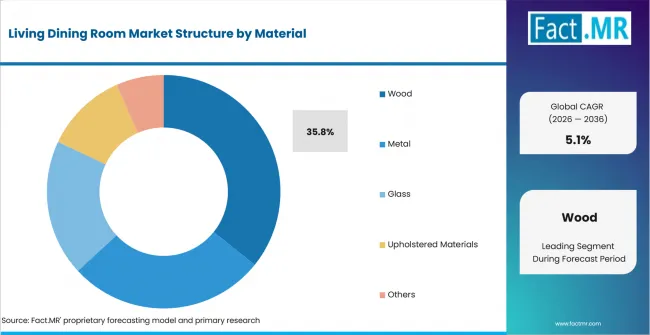
Living Dining Room Market Analysis By Material | Source: Fact.MR
Wood leads because it gives shoppers a simple quality signal. Solid wood appeals to long-use buyers. Engineered wood supports lower price points. Supplier positioning can draw on the wood furniture when material confidence guides purchase review.
What is accelerating Living Dining Room Market adoption, and what is holding it back?
Demand is expected to rise through room upgrades and stronger retail sales. High prices and unreliable delivery services may slow adoption.
Drivers Impact Analysis
| DRIVER | (~) % IMPACT ON CAGR | GEOGRAPHIC RELEVANCE | IMPACT TIMELINE |
|---|---|---|---|
| Replacement-led room upgrades | +1.4% | Germany, USA, UK | Short term (<= 2 years) |
| Residential renovation spending | +1.1% | Brazil, Australia, Canada | Short term (<= 2 years) |
| Showroom and retail service depth | +0.9% | Germany and urban retail clusters | Medium term (2-4 years) |
| Material and finish confidence | +0.7% | Global household buyers | Medium term (2-4 years) |
| Online-to-store purchase journeys | +0.5% | USA, UK, Japan | Long term (>= 4 years) |
Source: Fact.MR analysis. Updated Jul 31, 2026
- Replacement-led room upgrades: Buyers are expected to replace seating and storage when worn products reduce comfort or no longer fit room layouts.
- Residential renovation spending: Home improvement work is likely to create follow-on furniture purchases once floors and room plans are updated.
- Showroom and retail service depth: Retailers that explain delivery and assembly terms can reduce hesitation on higher-value furniture.
Opportunity Impact Analysis
| OPPORTUNITY | (~) % IMPACT ON CAGR | GEOGRAPHIC RELEVANCE | IMPACT TIMELINE |
|---|---|---|---|
| Room-bundle merchandising | +0.8% | Germany and Canada | Medium term (2-4 years) |
| Compact apartment furniture | +0.6% | Japan, UK, Australia | Medium term (2-4 years) |
| Private-label living ranges | +0.5% | Brazil and value-led channels | Long term (>= 4 years) |
| Outdoor-adjacent dining formats | +0.4% | Australia and warm-climate markets | Long term (>= 4 years) |
Source: Fact.MR analysis. Updated Jul 31, 2026
- Room-bundle merchandising: Matched living and dining ranges are expected to help buyers approve style and delivery in one decision.
- Compact apartment furniture: Smaller homes are likely to favor extendable tables and modular storage that serve more than one use.
- Private-label living ranges: Retailers can use owned lines to protect price points when branded furniture becomes harder to justify.
Restraints Impact Analysis
| RESTRAINT | (~) % IMPACT ON CAGR | GEOGRAPHIC RELEVANCE | IMPACT TIMELINE |
|---|---|---|---|
| Price sensitivity in discretionary furniture | -0.9% | Global household buyers | Short term (<= 2 years) |
| Delivery and assembly friction | -0.7% | Large and fragmented geographies | Short term (<= 2 years) |
| Material-cost and margin pressure | -0.5% | Wood and upholstery supply chains | Medium term (2-4 years) |
| Slow project conversion in commercial spaces | -0.4% | Hospitality and corporate buyers | Long term (>= 4 years) |
Source: Fact.MR analysis. Updated Jul 31, 2026
- Price sensitivity in discretionary furniture: Buyers may delay full-room purchases when the product does not solve an immediate comfort problem.
- Delivery and assembly friction: Large items require scheduling and damage control. Weak service terms can slow approval even when product interest is clear.
- Material-cost and margin pressure: Wood and upholstery cost movement can limit discounting. This makes private-label comparison sharper for value-led buyers.
Which countries are scaling Living Dining Room Market fastest?
The country comparison is led by Germany and followed by Brazil. Australia remains close to the global rate. The 2.1-point spread between Germany and Japan reflects replacement timing and channel maturity.
- Germany records the highest listed CAGR as retail service depth makes replacement purchases easier to approve. Brazil follows a distributor-led path where payment flexibility is expected to influence household furniture timing.
- Australia stays close to the global rate through renovation needs and delivery-service confidence. The USA and Canada remain measured markets where channel accountability and service reach decide conversion.
- The UK and Japan trail the listed group as buyers remain selective around value and room fit.
The full report provides country-level CAGR analysis across North America and Latin America. Europe and East Asia complete the view alongside South Asia and Oceania plus the Middle East and Africa.
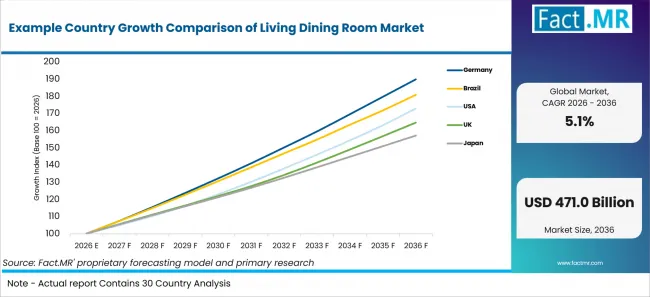
Example Country Growth Comparison Of Living Dining Room Market | Source: Fact.MR
| Country | CAGR (2026-2036) |
|---|---|
| Germany | 6.6% |
| Brazil | 6.1% |
| Australia | 3.6% |
| USA | 5.6% |
| Canada | 4.1% |
| UK | 5.1% |
| Japan | 4.6% |
Source: Fact.MR analysis. Updated Jul 31, 2026
What supports Germany adoption?
5.9% CAGR, supported by quality-focused replacement and service-led retail selection.
Germany’s growth reflects buyers who compare durability and delivery certainty before replacing core furniture. Retailers that provide material detail and clear assembly terms are expected to convert interest faster. Living room pieces take priority when households refresh the most visible shared space.
How is Brazil scaling demand?
5.4% CAGR, driven by distributor reach and payment-led household buying.
Brazil’s growth is shaped by accessible retail channels and financing comfort. Many households are likely to review payment terms before approving large furniture purchases. Suppliers that keep popular designs available across regional stores are expected to gain stronger repeat visibility.
What supports Australia growth from 2026 to 2036?
5.0% CAGR, backed by renovation-led demand and service reliability.
Australia’s growth is expected to move through renovation needs and wide delivery areas. Buyers often need assurance that large items can arrive safely and fit open living-dining layouts. Clear return terms are likely to improve confidence before purchase.
How is the USA developing demand?
4.9% CAGR, driven by channel accountability and brand comparison.
USA demand is expected to move through online discovery followed by store confirmation. Buyers compare room size and service promises before ordering larger sets. Retailers that make product dimensions easy to understand are likely to reduce abandoned purchases.
How does Canada perform?
4.5% CAGR, led by service reach and replacement discipline.
Canada’s growth reflects delivery reliability needs across large geographies. Households are expected to value durable wood-based products when replacement cycles lengthen. Retailers with dependable service coverage can reduce uncertainty in smaller cities and outer markets.
What supports UK adoption?
4.3% CAGR, backed by value-led replacement and compact-room planning.
UK growth is expected to depend on value comparison and room-fit clarity. Compact homes increase the need for furniture that works without crowding the space. Retailers that explain measurements plainly are likely to help buyers approve purchases sooner.
What shapes Japan’s outlook?
3.8% CAGR, supported by compact housing needs and quality-focused buying.
Japan’s growth reflects careful buying where size and build quality carry greater weight. Compact layouts can raise interest in flexible pieces. The smart furniture offers a useful adjacent view where space use and function are reviewed together.
Who leads the Living Dining Room Market?
IKEA are positioned among the most visible providers in the living dining room market. Ashley Furniture Industries and La-Z-Boy compete through brand recall and retail placement.
IKEA supports demand through broad room-set availability and simple product comparison. Ashley Furniture Industries adds scale in household furniture retail. La-Z-Boy strengthens the market through seating depth. Williams-Sonoma adds premium home positioning. MillerKnoll, Inc. extend the field.
Which companies are the key providers?
Key companies include IKEA; Ashley Furniture Industries; La-Z-Boy; Williams-Sonoma; MillerKnoll, Inc.
- IKEA
- Ashley Furniture Industries
- La-Z-Boy
- Williams-Sonoma
- MillerKnoll, Inc.
Bibliography
- Australian Bureau of Statistics. (2024, March 28). Swift lift in February retail sales.
- European Parliament, & Council of the European Union. (2024, June 28). Regulation (EU) 2024/1781 establishing a framework for setting ecodesign requirements for sustainable products.
- Office for Product Safety and Standards. (2024, October 25). Product safety report: Upholstered sofa CAAU5029201 (2408-0056). GOV.UK.
- IKEA. (2024, December 5). IKEA celebrates past design icons that are bold and versatile in the newest Nytillverkad collection.
This Report Answers
- The report provides strategic intelligence on the Living Dining Room Market across Product Type and Application choices that shape household furniture purchases.
- Segment analysis covers Living Room Furniture and Residential use as the share leaders within the 2026 market structure.
- Country outlook evaluates Germany and Brazil alongside Australia and the USA. Canada, the UK and Japan complete the growth comparison across the profiled markets.
- Competitive analysis profiles IKEA alongside Ashley Furniture Industries and La-Z-Boy. Williams-Sonoma and MillerKnoll, Inc. completes the provider set.
- Channel assessment covers Furniture Retail Stores and Online Retail. Brand showrooms and independent stores complete the route-to-market view alongside distributor-led sales.
What does the Living Dining Room Market cover?
Living and dining room furniture is used to furnish shared spaces where comfort, scale and material finish determine purchase approval.
The Living Dining Room Market covers products used for seating and dining in shared interiors. Storage furniture, display units and entertainment units are included when they shape room use.
What is included in the scope?
Living and dining room furniture is used across households and hospitality buyers. Corporate spaces and interior design projects are included when furniture is sold as part of the order.
The scope includes Product Type and Application alongside End User, Distribution Channel and Material. Coverage spans seating and dining tables. Storage furniture, coffee tables and entertainment units complete the product view across the listed materials.
What is excluded from the scope?
Unrelated construction materials, standalone decor and general household goods remain outside the scope of this market.
The scope excludes appliances and flooring. Lighting, unrelated textiles and decorative objects are excluded when they are not sold with living or dining furniture. General design service revenue is excluded unless the transaction includes furniture.
How Was the Analysis Built?
The analysis draws on 120+ sources and 35+ company portfolios. It covers 25+ countries and more than 20 industry interviews.
- Primary Research: Primary research includes discussions with manufacturers and service providers. It reviews purchasing priorities, approval requirements and adoption barriers.
- Desk Research: Desk research covers government statistics and regulatory publications. Company filings and trade data are reviewed where they support the market boundary.
- Market Sizing and Forecasting: Market estimates combine historical performance and demand indicators. Segment shares and country growth are reviewed with adoption barriers.
- Data Validation and Update Cycle: Findings are validated by comparing interviews with public data. New launches and procurement trends are checked for commercial use.
Segmentation
What is the report’s scope and coverage?
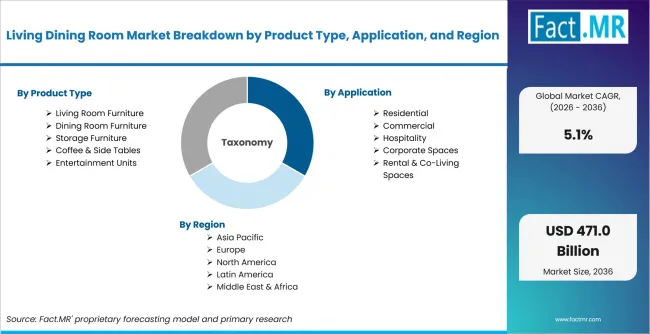
Living Dining Room Market Breakdown By Product Type, Application, And Region | Source: Fact.MR
| Attribute | Details |
|---|---|
| Quantitative Units | USD billion in 2026 to USD billion by 2036 at CAGR |
| Market Definition | Living and dining room furniture used in residential and commercial interiors where room fit, comfort, delivery and after-sale service determine purchase approval |
| Product Type | Living Room Furniture; Dining Room Furniture; Storage Furniture; Coffee & Side Tables; Entertainment Units |
| Application | Residential; Commercial; Hospitality; Corporate Spaces; Rental & Co-Living Spaces |
| End User | Households; Hospitality Industry; Corporate Offices; Interior Designers; Real Estate Developers |
| Distribution Channel | Furniture Retail Stores; Online Retail; Home Improvement Stores; Wholesale Distributors; Direct Sales |
| Material | Wood; Metal; Glass; Upholstered Materials; Others |
| Regions Covered | North America; Latin America; Europe; East Asia; South Asia and Oceania; Middle East and Africa |
| Countries Covered | Germany; Brazil; Australia; USA; Canada; UK; Japan |
| Key Companies Profiled | IKEA; Ashley Furniture Industries; La-Z-Boy; Williams-Sonoma; MillerKnoll, Inc. |
| Forecast Period | 2026 to 2036 |
| Approach | Hybrid top-down and bottom-up approach using historical furniture demand; product-type mix; residential replacement timing; retail-channel participation; material preferences; country-level growth; company portfolio review; buyer approval behavior; delivery service requirements and regional channel depth |
Source: Fact.MR analysis. Updated Jul 31, 2026
How is the market segmented?
-
By Product Type
- Living Room Furniture
- Sofas
- Recliners
- Dining Room Furniture
- Dining Tables
- Dining Chairs
- Storage Furniture
- Sideboards
- Display Cabinets
- Coffee & Side Tables
- Coffee Tables
- End Tables
- Entertainment Units
- TV Units
- Media Consoles
- Living Room Furniture
-
By Application
- Residential
- Single-Family Homes
- Apartments & Condominiums
- Commercial
- Hotels & Resorts
- Restaurants & Cafés
- Hospitality
- Lounges
- Guest Houses
- Corporate Spaces
- Executive Lounges
- Reception Areas
- Rental & Co-Living Spaces
- Service Apartments
- Co-Living Facilities
- Residential
-
By End User
- Households
- Homeowners
- Tenants
- Hospitality Industry
- Hotels
- Resorts
- Corporate Offices
- Commercial Offices
- Co-Working Spaces
- Interior Designers
- Residential Designers
- Commercial Designers
- Real Estate Developers
- Residential Projects
- Commercial Projects
- Households
-
By Distribution Channel
- Furniture Retail Stores
- Brand Showrooms
- Independent Furniture Stores
- Online Retail
- E-commerce Marketplaces
- Brand-Owned Websites
- Home Improvement Stores
- DIY Retailers
- Home Centers
- Wholesale Distributors
- Furniture Wholesalers
- Bulk Suppliers
- Direct Sales
- Project Sales
- Custom Furniture Orders
- Furniture Retail Stores
-
By Material
- Wood
- Solid Wood
- Engineered Wood
- Metal
- Stainless Steel
- Aluminum
- Glass
- Tempered Glass
- Frosted Glass
- Upholstered Materials
- Fabric Upholstery
- Leather Upholstery
- Others
- Rattan
- Composite Materials
- Wood
-
By Region
- North America
- Latin America
- Europe
- East Asia
- South Asia and Oceania
- Middle East and Africa
Frequently Asked Questions
Which Product Type leads the market?
Which Application leads the market?
Which End User leads the market?
Which Distribution Channel leads the market?
Which Material leads the market?
Which country records the highest listed CAGR?
What is the primary driver in this market?
What is the main restraint?
Why do households lead demand?
Who worked on this report


Preview the report firsthand - request a free sample
Free SampleGet the brochure for pricing and purchase details
Download PDF