- Base Value(2025): 161 Bn
- Estimated Value (2026): 168.4 Bn
- Forecast Value (2035): 261.5 Bn
- CAGR (2035 ):4.5%
What is the Non-Alcoholic Beverage Packaging Market forecast to be worth by 2036?
USD 261.5 billion by 2036 at 4.5% CAGR.
- The Non-Alcoholic Beverage Packaging Market reached USD 161.1 billion in 2025.
- Demand is projected to increase from USD 168.4 billion in 2026 to USD 261.5 billion by 2036.
- The market is forecast to record a 4.5% CAGR from 2026 to 2036.
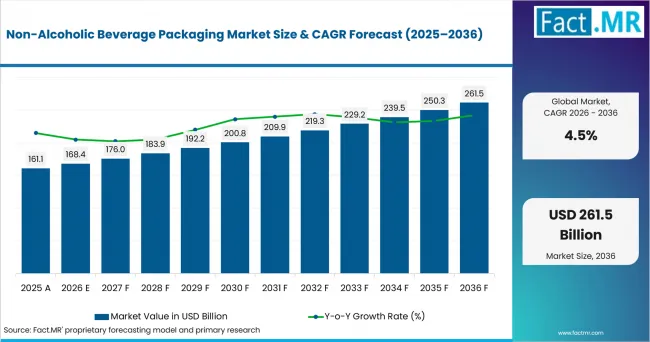
Non Alcoholic Beverage Packaging Market Value Analysis | Source: Fact.MR
What are the defining numbers behind Non-Alcoholic Beverage Packaging Market growth?
An absolute opportunity of USD 93.1 billion is expected between 2026 and 2036.
- Demand Drivers in the Market
- Carbonated Beverage Packaging accounts for a large part of demand because beverage producers require containers that can protect carbonation, withstand distribution conditions, and operate efficiently on high-volume filling lines.
- Aseptic Packaging Technology supports ambient distribution and extended product life for suitable liquid foods and beverages without requiring refrigeration during distribution.
- Plastic Packaging Solutions remain important across PET bottles and HDPE systems because manufacturers can combine lightweight container designs with established high-speed production and distribution infrastructure.
- Packaging selection is increasingly influenced by recyclability, recycled-content requirements and producer responsibility. Regulation (EU) 2025/40 introduces requirements covering packaging waste, recyclability, recycled content and collection systems across the European Union.
- Food-contact qualification remains a core requirement in the USA. FDA requires food-contact substances that qualify as food additives to be authorized for their intended use before marketing.
- Key Segments Analyzed
- Plastic Packaging Solutions account for 43.7% of Product in 2026, supported by lightweight PET and HDPE formats that fit established beverage filling and distribution systems.
- Carbonated Beverage Packaging holds 68.4% of Application in 2026, reflecting the need for containers that retain pressure and protect soft drinks and sparkling water through high-speed filling and distribution.
- Beverage Manufacturers represent 57.2% of End Use in 2026 because packaging specifications are closely tied to beverage formulation, filling-line compatibility and procurement scale.
- Aseptic Packaging Technology accounts for 79.1% of Technology in 2026, supported by sterile filling and package sterilization for beverages requiring extended shelf life and ambient distribution.
- Sustainable Packaging Formulations hold 35.8% of Formulation in 2026 as beverage producers place greater emphasis on recyclability and lower material use.
- Direct Manufacturer Supply represents 62.5% of Distribution Channel in 2026 because large-volume packaging programs require coordinated specifications and long-term supply arrangements.
- Analyst Opinion at Fact.MR
- Shambhu Nath Jha, Principal Consultant at Fact.MR, states, "Buyer decisions in the Non-Alcoholic Beverage Packaging Market will increasingly depend on the complete packaging system rather than container material alone. Beverage producers need the package, closure, filling process and distribution model to work together while meeting food-contact and recycling requirements. Suppliers that can lower material use without weakening shelf life, line efficiency or product protection can move more quickly into repeat supply relationships."
- Strategic Implications
- Packaging suppliers should document how material reduction affects barrier performance, filling speeds and transport performance before commercial qualification.
- Beverage manufacturers should evaluate the container and filling process together because material changes can affect line settings, sterilization requirements and shelf-life performance.
- Suppliers serving Europe and the UK should build recyclability and producer-responsibility requirements into packaging development rather than treating compliance as a downstream reporting activity.
- Direct supply relationships should include continuity planning for resin, aluminum, paperboard and other critical packaging inputs.
- Sustainable positioning should be supported by measurable material, recycling or lifecycle evidence rather than broad environmental claims.
How does the Non-Alcoholic Beverage Packaging Market break down by segment?
The market is segmented by Product, Application, End Use, Technology, Formulation and Distribution Channel.
Why do Plastic Packaging Solutions lead Product?
Plastic Packaging Solutions are projected to account for a 43.7% share in 2026.
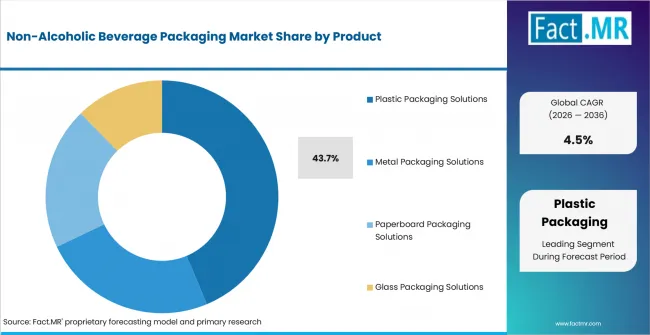
Non Alcoholic Beverage Packaging Market Analysis By Product | Source: Fact.MR
PET Bottle Packaging and HDPE Packaging Systems support a wide range of beverage formats while keeping container weight relatively low.
The established installed base of bottle production, filling and distribution equipment supports continued use, although recycling performance and recycled-content requirements are increasing pressure on package design. EPA reports that PET bottles and jars had a 29.1% recycling rate in its latest national material-specific dataset for the United States.
Why does Carbonated Beverage Packaging lead Application?
Carbonated Beverage Packaging is projected to account for a 68.4% share in 2026.
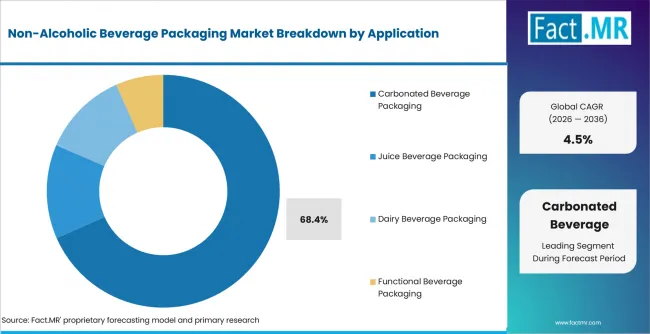
Non Alcoholic Beverage Packaging Market Analysis By Application | Source: Fact.MR
Soft Drink Packaging and Sparkling Water Packaging require containers that retain carbonation while protecting the beverage through filling, transport and retail handling.
The application supports recurring demand across bottles and cans because package integrity directly affects product quality and consumer acceptance.
Why do Beverage Manufacturers lead End Use?
Beverage Manufacturers are projected to account for a 57.2% share in 2026.
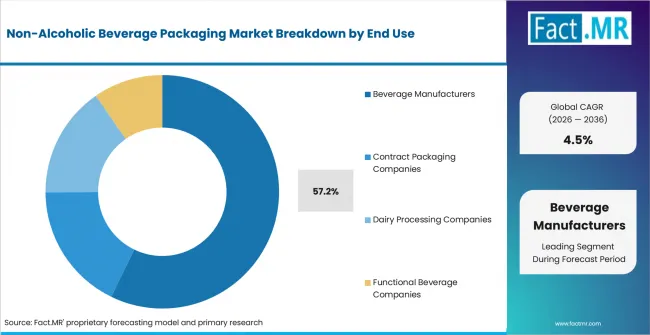
Non Alcoholic Beverage Packaging Market Analysis By End Use | Source: Fact.MR
Large Scale Beverage Producers purchase high packaging volumes and require repeatable specifications across filling lines, while Specialty Beverage Producers create additional demand for differentiated formats.
Direct control over beverage formulation and filling makes manufacturers central to decisions involving material selection, closure design, barrier requirements and pack size.
Why does Aseptic Packaging Technology lead Technology?
Aseptic Packaging Technology is projected to account for a 79.1% share in 2026.
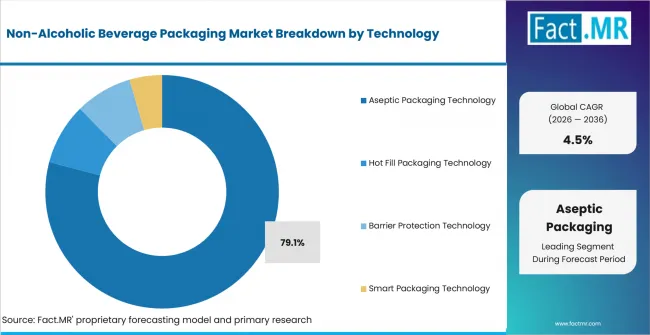
Non Alcoholic Beverage Packaging Market Analysis By Technology | Source: Fact.MR
Sterile Filling Systems and Packaging Sterilization Systems allow suitable liquid foods and beverages to maintain product quality for extended periods without refrigerated distribution.
Tetra Pak's current aseptic portfolio also shows continuing development around paper-based barriers and renewable material content, indicating that aseptic technology is being redesigned alongside sustainability requirements.
Why do Sustainable Packaging Formulations lead Formulation?
Sustainable Packaging Formulations are projected to account for a 35.8% share in 2026.
Recyclable Material Systems and Lightweight Packaging Systems reduce material requirements or improve compatibility with collection and recycling systems.
Regulatory changes strengthen the commercial reason for this shift. The EU packaging regulation sets recycling and packaging-design requirements, while the UK's packaging EPR system places waste-management costs on obligated producers.
Why does Direct Manufacturer Supply lead Distribution Channel?
Direct Manufacturer Supply is projected to account for a 62.5% share in 2026.
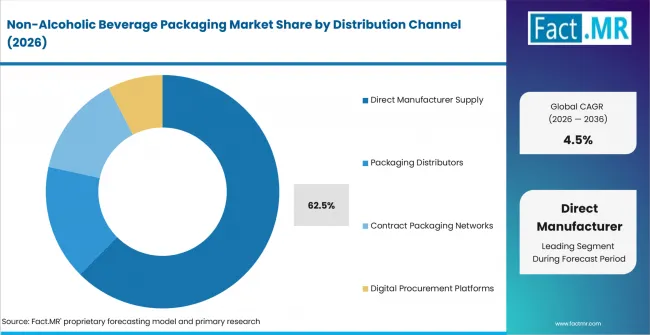
Non Alcoholic Beverage Packaging Market Analysis By Distribution Channel | Source: Fact.MR
Long Term Supply Agreements allow beverage manufacturers and packaging suppliers to coordinate specifications, capacity and quality requirements.
Strategic Packaging Partnerships become more important when changes to package weight, barrier layers or closures require filling-line qualification before full-scale deployment.
What is accelerating Non-Alcoholic Beverage Packaging Market adoption, and what is holding it back?
Drivers Impact Analysis
| Factor | (~) % Impact on CAGR | Geographic Relevance | Impact Timeline |
|---|---|---|---|
| Aseptic packaging for shelf-stable beverages | +1.4% | USA and Japan | Short term (<= 2 years) |
| Shift toward recyclable and lightweight packaging | +1.2% | Germany and UK | Medium term (2-4 years) |
| Recurring carbonated beverage packaging demand | +1.0% | USA and Brazil | Long term (>= 4 years) |
Source: Fact.MR analysis. Updated Aug 14, 2026
Opportunity Impact Analysis
| Factor | (~) % Impact on CAGR | Geographic Relevance | Impact Timeline |
|---|---|---|---|
| Recyclable material systems | +0.9% | Germany | Short term (<= 2 years) |
| Paper-based barrier aseptic packaging | +0.7% | Europe | Medium term (2-4 years) |
| Connected packaging and traceability | +0.5% | Japan | Long term (>= 4 years) |
Source: Fact.MR analysis. Updated Aug 14, 2026
Restraints Impact Analysis
| Factor | (~) % Impact on CAGR | Geographic Relevance | Impact Timeline |
|---|---|---|---|
| Food-contact and packaging qualification burden | -0.9% | USA | Short term (<= 2 years) |
| Recycling complexity of multi-material structures | -0.7% | Germany and UK | Medium term (2-4 years) |
| Producer-responsibility and collection costs | -0.5% | UK and Brazil | Long term (>= 4 years) |
Source: Fact.MR analysis. Updated Aug 14, 2026
Which countries are scaling the Non-Alcoholic Beverage Packaging Market through 2036?
- Germany: Packaging demand is increasingly shaped by recycling performance, return systems and material efficiency.
- Brazil: Beverage packaging demand is supported by a large beverage value chain while reverse-logistics requirements increase attention to collection and recycling systems.
- USA: A large beverage manufacturing base supports demand across bottles, cans and cartons, while food-contact compliance and recycling performance influence material qualification.
- UK: Packaging EPR changes the economics of material choice by transferring waste-management costs to obligated packaging producers.
- Japan: Packaging demand is influenced by established container recycling systems and continuing policy attention to circular use of plastics and other packaging materials.
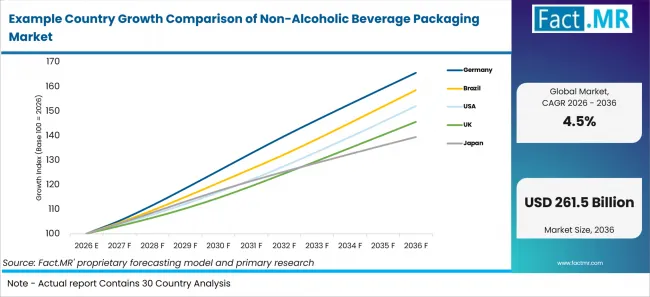
Example Country Growth Comparison Of Non Alcoholic Beverage Packaging Market | Source: Fact.MR
Country CAGR (2026-2036)
| Country | CAGR (2026-2036 |
|---|---|
| Germany | 5.17% |
| Brazil | 4.72% |
| USA | 4.28% |
| UK | 3.83% |
| Japan | 3.38% |
Source: Fact.MR analysis. Updated Aug 14, 2026
What is driving Germany's growth through 2036?
Germany is forecast to expand at a 5.17% CAGR from 2026 to 2036.
Germany has established collection, deposit and recycling systems for beverage packaging. The German Environment Agency notes that return deposits apply to relevant packaging and that collected glass can be recycled into new containers.
Packaging suppliers therefore compete on recyclability alongside manufacturing efficiency and beverage protection.
What is driving Brazil's growth through 2036?
Brazil is forecast to expand at a 4.72% CAGR from 2026 to 2036.
Brazil's reverse-logistics framework covers general packaging made from materials including paper, plastic, metal and glass.
This creates demand for packaging formats that can move through collection and recovery systems while meeting beverage producers' commercial requirements.
What is driving the USA's growth through 2036?
The USA is forecast to expand at a 4.28% CAGR from 2026 to 2036.
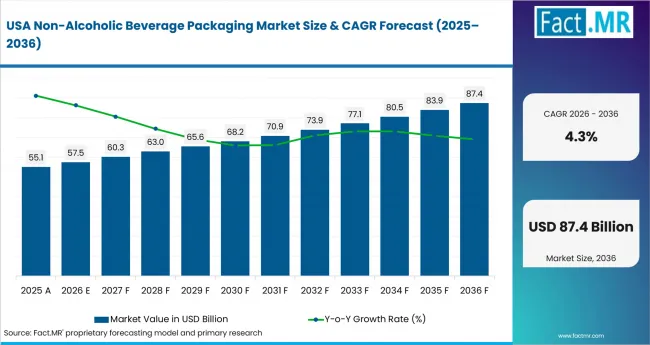
Non Alcoholic Beverage Packaging Market Country Value Analysis | Source: Fact.MR
Beverage packaging suppliers must combine commercial performance with food-contact compliance. FDA requires authorization where a food-contact substance qualifies as a food additive.
Recycling performance creates a second design consideration because EPA data continues to show material-specific differences in the recovery of plastic containers and other packaging.
What is driving the UK's growth through 2036?
The UK is forecast to expand at a 3.83% CAGR from 2026 to 2036.
The UK's packaging EPR scheme requires affected producers to report packaging and, where applicable, pay waste-disposal and related scheme costs.
The 2025 to 2026 base fees also vary by material, creating a direct commercial link between packaging choice and producer-responsibility costs.
What is driving Japan's growth through 2036?
Japan is forecast to expand at a 3.38% CAGR from 2026 to 2036.
Japan's Containers and Packaging Recycling Law establishes a framework for sorted collection and recycling of containers and packaging.
METI also identifies single-use containers and packaging as a significant part of Japan's plastic-waste stream, strengthening attention to material circulation and packaging design.
Who leads the Non-Alcoholic Beverage Packaging Market?
Tetra Pak is positioned around aseptic carton packaging and integrated filling systems. Its current portfolio includes aseptic packages for liquid food and beverages, while recent development has focused on paper-based barrier structures.
Ball Corporation and Crown Holdings compete through aluminum beverage cans and related beverage-packaging formats. Ball describes beverage cans and aluminum bottles across water, soft drinks and other beverage categories, while Crown supplies aluminum cans across established and emerging beverage applications.
Amcor participates through beverage bottles, closures, films and related packaging formats. Competition therefore spans material choice, filling compatibility, container weight, barrier performance and recycling requirements.
Which companies are the key providers?
Key companies include Tetra Pak; Ball Corporation; Silgan Holdings, Inc.; CKS Packaging Inc.; Parksons Packaging Ltd.; Mondi plc; Amcor Plc; Crown Holdings, Inc.; Ardagh Group S.A.; Toyo Seikan Group Holdings, Ltd.; Elopak ASA; and UFlex Limited.
- Tetra Pak
- Ball Corporation
- Silgan Holdings, Inc.
- CKS Packaging Inc.
- Parksons Packaging Ltd.
- Mondi plc
- Amcor Plc
- Crown Holdings, Inc.
- Ardagh Group S.A.
- Toyo Seikan Group Holdings, Ltd.
- Elopak ASA
- UFlex Limited
This Report Answers
- The report examines demand across Product, Application, End Use, Technology, Formulation and Distribution Channel.
- Segment analysis explains the operating and commercial reasons behind each leading category.
- Country analysis evaluates Germany, Brazil, USA, UK and Japan through 2036.
- Competitive analysis reviews packaging providers across plastic, metal, paperboard and related beverage-packaging systems.
- The analysis considers food-contact qualification, filling compatibility, recyclability, material efficiency and supply continuity when assessing purchasing decisions.
What does the Non-Alcoholic Beverage Packaging Market cover?
The market covers packaging solutions used to contain, protect, preserve and distribute non-alcoholic beverages.
The assessment includes plastic, metal, paperboard and glass packaging sold for carbonated beverages, juice beverages, dairy beverages and functional beverages. Packaging is assessed through the stated technology, formulation and distribution-channel framework.
Revenue is counted where the packaging product or integrated packaging solution is supplied for the listed non-alcoholic beverage applications.
What is included in the scope?
The scope includes Plastic Packaging Solutions, Metal Packaging Solutions, Paperboard Packaging Solutions and Glass Packaging Solutions.
It includes PET Bottle Packaging, HDPE Packaging Systems, Aluminum Can Packaging, Steel Container Packaging, Carton Packaging Systems, Composite Paper Packaging, Returnable Glass Packaging and Non Returnable Glass Packaging.
Technology coverage includes Aseptic Packaging Technology, Hot Fill Packaging Technology, Barrier Protection Technology and Smart Packaging Technology.
Demand is assessed across Beverage Manufacturers, Contract Packaging Companies, Dairy Processing Companies and Functional Beverage Companies.
What is excluded from the scope?
Packaging used primarily for alcoholic beverages is excluded from the defined non-alcoholic beverage market.
General food packaging that is not used for the listed beverage applications is excluded.
Standalone filling machinery, sterilization equipment or digital systems are excluded when their revenue cannot be attributed to an in-scope beverage packaging solution.
Raw packaging materials sold without conversion into an in-scope package or packaging system are outside the assessed market boundary.
How Was the Analysis Built?
The analysis combines product scope, segment demand, beverage applications, country conditions and supplier coverage.
- Primary Research: Interviews focus on packaging manufacturers, beverage producers, filling-line operators, material suppliers, distributors and procurement teams.
- Desk Research: The review covers food-contact requirements, packaging and recycling regulation, waste-management data, company technical literature and current packaging-development programmes.
- Market Sizing and Forecasting: Estimates combine packaging material demand, beverage production requirements, package-format mix, technology adoption, distribution channels and realized packaging value.
- Data Validation and Update Cycle: Findings are checked against public regulatory evidence, company portfolios and current packaging-market developments. Updates review packaging legislation, material changes, recycling requirements and supplier portfolio developments.
Segmentation
What is the report's scope and coverage?
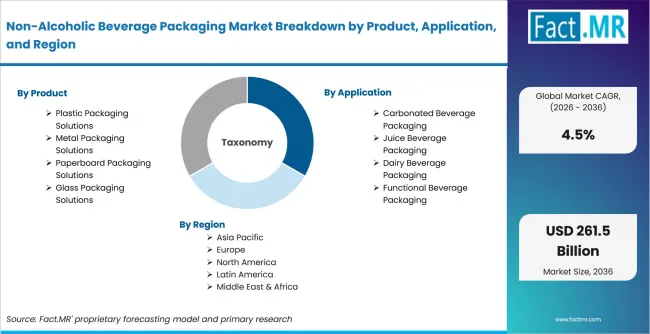
Non Alcoholic Beverage Packaging Market Breakdown By Product Application And Region | Source: Fact.MR
| Attribute | Details |
|---|---|
| Quantitative Units | USD Billion |
| Market Definition | Packaging solutions used to contain, protect and distribute non-alcoholic beverages across the stated Product, Application, End Use, Technology, Formulation and Distribution Channel categories |
| Segments Covered | Product; Application; End Use; Technology; Formulation; Distribution Channel |
| Regions Covered | North America; Latin America; Europe; East Asia; South Asia and Oceania; Middle East and Africa |
| Countries Covered | Germany; Brazil; USA; UK; Japan |
| Key Companies Profiled | Tetra Pak; Ball Corporation; Silgan Holdings, Inc.; CKS Packaging Inc.; Parksons Packaging Ltd.; Mondi plc; Amcor Plc; Crown Holdings, Inc.; Ardagh Group S.A.; Toyo Seikan Group Holdings, Ltd.; Elopak ASA; UFlex Limited |
| Forecast Period | 2026 to 2036 |
| Base Year | 2025 |
| Market Value, 2026 | USD 168.4 billion |
| Market Value, 2036 | USD 261.5 billion |
| CAGR, 2026-2036 | 4.5% |
| Absolute Opportunity | USD 93.1 billion |
| Approach | Combines packaging material demand, beverage application mix, filling technology, end-user procurement, distribution structure and country-level adoption conditions |
Source: Fact.MR analysis. Updated Aug 14, 2026
How is the market segmented?
-
By Product
- Plastic Packaging Solutions
- PET Bottle Packaging
- HDPE Packaging Systems
- Metal Packaging Solutions
- Aluminum Can Packaging
- Steel Container Packaging
- Paperboard Packaging Solutions
- Carton Packaging Systems
- Composite Paper Packaging
- Glass Packaging Solutions
- Returnable Glass Packaging
- Non Returnable Glass Packaging
- Plastic Packaging Solutions
-
By Application
- Carbonated Beverage Packaging
- Soft Drink Packaging
- Sparkling Water Packaging
- Juice Beverage Packaging
- Fruit Juice Packaging
- Functional Juice Packaging
- Dairy Beverage Packaging
- Milk Based Beverage Packaging
- Cultured Dairy Packaging
- Functional Beverage Packaging
- Sports Beverage Packaging
- Energy Beverage Packaging
- Carbonated Beverage Packaging
-
By End Use
- Beverage Manufacturers
- Large Scale Beverage Producers
- Specialty Beverage Producers
- Contract Packaging Companies
- Dedicated Beverage Packers
- Private Label Packers
- Dairy Processing Companies
- Milk Processing Facilities
- Cultured Beverage Facilities
- Functional Beverage Companies
- Sports Nutrition Producers
- Health Beverage Producers
- Beverage Manufacturers
-
By Technology
- Aseptic Packaging Technology
- Sterile Filling Systems
- Packaging Sterilization Systems
- Hot Fill Packaging Technology
- High Temperature Filling Systems
- Thermal Packaging Systems
- Barrier Protection Technology
- Oxygen Barrier Systems
- Moisture Barrier Systems
- Smart Packaging Technology
- Connected Packaging Systems
- Traceability Systems
- Aseptic Packaging Technology
-
By Formulation
- Sustainable Packaging Formulations
- Recyclable Material Systems
- Lightweight Packaging Systems
- High Barrier Packaging Formulations
- Extended Shelf Life Systems
- Multi Layer Packaging Systems
- Premium Packaging Formulations
- Enhanced Appearance Systems
- Brand Differentiation Systems
- Functional Packaging Formulations
- Resealable Packaging Systems
- Portable Packaging Systems
- Sustainable Packaging Formulations
-
By Distribution Channel
- Direct Manufacturer Supply
- Long Term Supply Agreements
- Strategic Packaging Partnerships
- Packaging Distributors
- Industrial Packaging Distributors
- Specialty Packaging Distributors
- Contract Packaging Networks
- Co Packing Providers
- Integrated Service Providers
- Digital Procurement Platforms
- B2B Procurement Platforms
- Manufacturer Portals
- Direct Manufacturer Supply
-
By Region
- North America
- Latin America
- Western Europe
- Eastern Europe
- East Asia
- South Asia and Pacific
- Middle East & Africa
Frequently Asked Questions
What is the Non-Alcoholic Beverage Packaging Market value in 2026?
At what CAGR is the market projected to grow?
What is the projected market value by 2036?
Which Product category leads the market?
Which Application category leads the market?
Which End Use category leads the market?
Which Technology category leads the market?
Which Formulation category leads the market?
Which Distribution Channel category leads the market?
Which country records the highest listed CAGR?
Which companies are assessed?
Who worked on this report


Preview the report firsthand - request a free sample
Free SampleGet the brochure for pricing and purchase details
Download PDF