- Market Value (2025): USD 3.76 Bn
- Estimated Value (2026): USD 4.1 Bn
- Forecast Value (2036): USD 9.85 Bn
- CAGR (2026-2036): 9.2%
What is the OLED Materials Market forecast to be worth by 2036?
USD 4.1 billion in 2026 to USD 9.9 billion by 2036 at a 9.2% CAGR.
- The OLED materials market was valued at USD 3.76 billion in 2025, with phone and television panels taking most of the material volume.
- By 2036, revenue will reach USD 9.85 billion, up from USD 4.1 billion in 2026, as OLED moves into laptops, tablets, monitors and vehicle cabins.
- Sales will compound at 9.2% CAGR from 2026 to 2036, since each foldable or tandem panel consumes more material layers than a rigid phone screen.
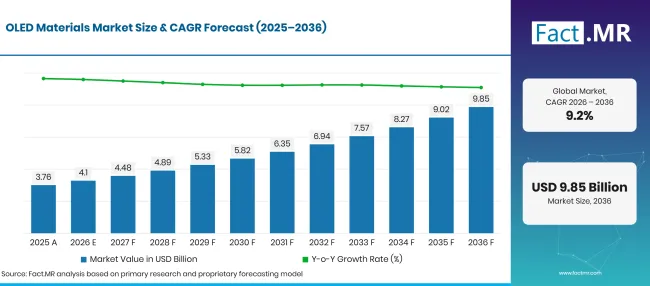
Factmr Oled Materials Market Forecast Global | Source: Fact.MR
| Year | Basis | Market Value (USD billion) |
|---|---|---|
| 2025 | Actual | 3.76 |
| 2026 | Estimate | 4.1 |
| 2036 | Forecast | 9.85 |
| CAGR 2026 to 2036 | Forecast period | 9.2% |
Source: Fact.MR analysis. Updated Oct 22, 2026
What are the defining numbers behind OLED Materials Market growth?
The 2026 to 2036 period adds USD 5.8 billion in new value, concentrated in display panels for consumer devices.
- Demand Drivers in the Market
- Connected device use keeps widening the base of OLED screens. The International Telecommunication Union reported in November 2025 that 5G now reaches more than half of the world’s population, while 2.2 billion people remain offline [1]. Each new mobile user is a potential buyer of an OLED phone, and each upgrade cycle pulls emitter and transport materials through panel lines.
- Vehicle cabins are turning into a second demand channel. The International Energy Agency reported that electric car sales exceeded 17 million worldwide in 2024, a share of more than 20% [2]. Electric models tend to carry wide digital cockpits, and OLED panels in those cockpits must pass strict heat and lifetime tests.
- IT devices are adopting OLED after phones and televisions. Universal Display Corporation reported in February 2026 that interest in OLED laptops, tablets and monitors is growing, and that foldables are moving beyond a niche category [3]. Larger screens use more material per unit, which lifts tonnage even when device shipments are flat.
- Efficiency and lifetime targets keep panel makers testing new chemistries. Brighter tandem stacks and lower-power emitters reach the market only after long qualification, so suppliers with proven formulations gain repeat orders.
- Key Segments Analyzed
- By Material Type: Emissive Layer Materials will hold 38.5% share in 2026, as these compounds set the color, brightness and power draw of every panel.
- By Application: Displays will account for 76.8% share in 2026, reflecting the scale of OLED screens across phones, televisions, watches and monitors.
- By End-User Industry: Consumer Electronics will capture 74.2% share in 2026, given that handset and television makers buy panels in the greatest annual volumes.
- Analyst Opinion at Fact.MR
- Shambhu Nath Jha, Principal Consultant at Fact.MR, states, “Panel makers now treat efficiency, lifetime and color accuracy as purchase filters, and material suppliers must pass all three before a grade wins a slot. Emissive compounds anchor the stack, but transport and encapsulation layers face the same process checks on every new line. Suppliers that lift performance while holding batch-to-batch yield will gain share as OLED spreads into cars, laptops and large screens, where qualification takes longer but contracts run for years.”
- Strategic Implications
- Material suppliers should invest in emitter and charge-transport chemistries, since gains in efficiency and operating life feed directly into panel maker sourcing decisions.
- Automotive display programs should plan for full thermal and durability documentation, because cabin qualification is far stricter than for phones.
- Encapsulation and substrate developers should focus on barrier strength and bend tolerance that suit existing deposition lines.
- Panel manufacturers should bring suppliers into the qualification stage early, given that small chemical changes can shift yield and color output.
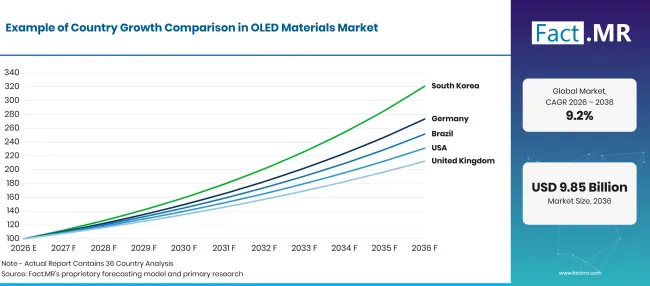
At 10.6% CAGR, Germany leads the five-country group, where premium car makers specify OLED cockpit and lighting panels. Brazil follows at 9.7% as smartphone and connected television use keeps rising. The United States will expand at 8.7%, helped by strong imports of laptops and monitors that now offer OLED screens. In the United Kingdom, a 7.8% pace builds on fast take-up of electric cars with digital cabins. Japan rounds out the list at 6.9%, drawing on near-universal smartphone ownership and a long-standing base of material chemists.
How does the OLED Materials Market break down by segment?
Emissive Layer Materials will lead Material Type at 38.5%; Displays will head Application at 76.8%; Consumer Electronics will top End-User Industry at 74.2%.
Which Material Type leads?
Emissive Layer Materials take 38.5% of 2026 sales.
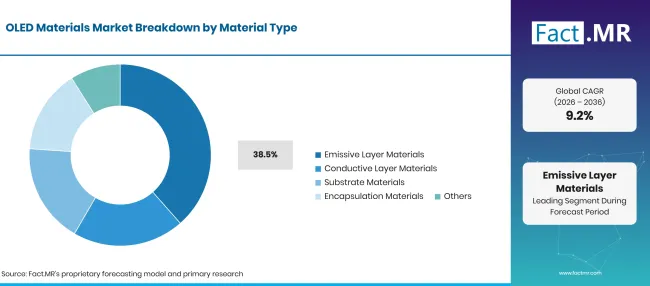
Factmr Oled Materials Market Breakdown Material Type | Source: Fact.MR
| Material Type | Share (2026) |
|---|---|
| Emissive Layer Materials (Leading segment) | 38.5% |
| Other segments combined | 61.5%* |
| Total | 100.0% |
Source: Fact.MR analysis. Updated Oct 22, 2026
Every pixel’s color and brightness is decided in the emission layer, so panel makers spend most of their qualification effort on emitters and hosts. Phosphorescent red and green emitters are standard in phones, and work on efficient blue continues. Rising demand for OLED display panels keeps these high-purity compounds in steady supply contracts. Conductive and charge-transport layers move holes and electrons into the emission zone, and their quality sets drive voltage. Substrate materials, including polyimide and flexible glass substrates, allow curved and foldable designs. Encapsulation shields organic layers from moisture and oxygen. Merck reported in March 2026 that it develops barrier materials with higher flexibility and longer lifespans for flexible OLED devices in IT applications [4].
What leads the Application segment?
Displays represent 76.8% of 2026 sales.
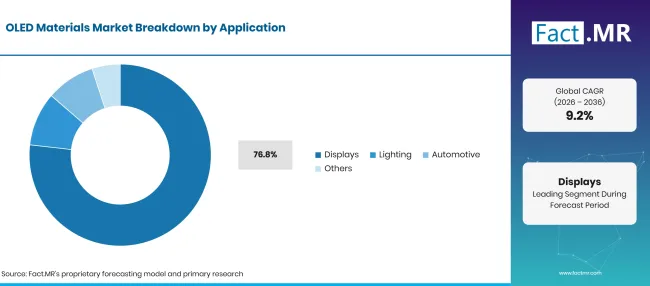
Factmr Oled Materials Market Breakdown Application | Source: Fact.MR
| Application | Share (2026) |
|---|---|
| Displays (Leading segment) | 76.8% |
| Other segments combined | 23.2%* |
| Total | 100.0% |
Source: Fact.MR analysis. Updated Oct 22, 2026
Phones, televisions, smartwatches and monitors all ship with OLED screens today, so display lines absorb most of the material output. Foldable and rollable formats add layers per device, and makers of foldable OLED substrates now design films around repeated bending. Lighting uses OLED panels as thin, glare-free surfaces in architecture and premium interiors, but costs remain above LED options. Automotive use spans dashboard screens and rear lamps. Interest in transparent OLED panels for retail windows and head-up layouts adds a smaller, specialized stream of demand.
What supports Consumer Electronics within End-User Industry?
Consumer Electronics buyers make up 74.2% of 2026 sales.
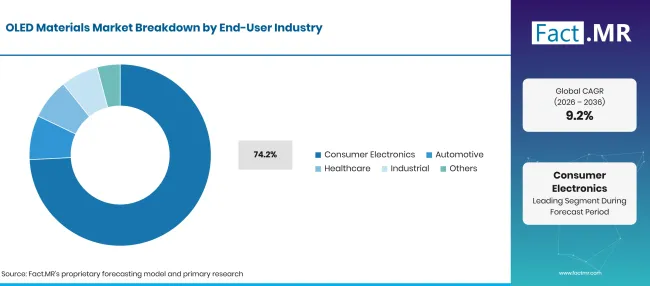
Factmr Oled Materials Market Breakdown End User Industry | Source: Fact.MR
| End-User Industry | Share (2026) |
|---|---|
| Consumer Electronics (Leading segment) | 74.2% |
| Other segments combined | 25.8%* |
| Total | 100.0% |
Source: Fact.MR analysis. Updated Oct 22, 2026
Handset and television brands order panels by the million, which gives material suppliers long production runs and predictable forecasts. Mid-range phones now use OLED screens that were once reserved for flagship models. Tablets and laptops add a newer layer of demand as brands chase battery life and contrast. Healthcare buyers use OLED monitors in surgical and diagnostic imaging, where color accuracy and contrast are critical. Industrial users fit OLED panels to instruments and control screens. Other buyers, such as suppliers of energy-efficient OLED cockpits for electric vehicles, place smaller but longer contracts.
What is accelerating OLED Materials Market adoption, and what is holding it back?
OLED panels keep spreading from phones into laptops, monitors and car cabins, and each new format pulls in more material per device. Long qualification cycles, high development costs and moisture sensitivity slow how fast new grades reach volume production.
Drivers Impact Analysis
| DRIVER | (~) % IMPACT ON CAGR | GEOGRAPHIC RELEVANCE | IMPACT TIMELINE |
|---|---|---|---|
| Wider OLED use across smartphones, televisions, monitors and wearables | +2.8% | Global; East Asia panel hubs | Short term (<= 2 years) |
| Panel maker pressure on brightness, color accuracy and power efficiency | +2.1% | Global | Medium term (2-4 years) |
| Automotive cabin displays opening channels beyond consumer electronics | +1.2% | Germany, Japan, United States, East Asia | Medium term (2-4 years) |
| Flexible and thinner device designs that need new material sets | +0.9% | East Asia, North America, Western Europe | Long term (>= 4 years) |
Source: Fact.MR analysis. Updated Oct 22, 2026
Opportunity Impact Analysis
| OPPORTUNITY | (~) % IMPACT ON CAGR | GEOGRAPHIC RELEVANCE | IMPACT TIMELINE |
|---|---|---|---|
| Advanced emitter and charge-transport grades winning preferred vendor status | +0.7% | Global | Medium term (2-4 years) |
| Automotive programs that reward heat resistance and long service life | +0.5% | Germany, Japan, United States, East Asia | Medium term (2-4 years) |
| Flexible substrate and thin-film encapsulation systems | +0.4% | East Asia, North America, Western Europe | Long term (>= 4 years) |
| Early qualification partnerships that lock in multi-year supply | +0.3% | Global | Short term (<= 2 years) |
Source: Fact.MR analysis. Updated Oct 22, 2026
Restraints Impact Analysis
| RESTRAINT | (~) % IMPACT ON CAGR | GEOGRAPHIC RELEVANCE | IMPACT TIMELINE |
|---|---|---|---|
| High material development and panel production costs | -0.8% | Global | Short term (<= 2 years) |
| Moisture and oxygen sensitivity raising encapsulation cost | -0.5% | Global | Medium term (2-4 years) |
| Long qualification cycles for new materials, mainly in automotive | -0.4% | Global | Medium term (2-4 years) |
| Competing display technologies such as mini-LED and microLED | -0.3% | Global | Long term (>= 4 years) |
Source: Fact.MR analysis. Updated Oct 22, 2026
Which countries are scaling the OLED Materials Market through 2036?
Factmr Oled Materials Market Growth Index | Source: Fact.MR
| Country | CAGR (2026 to 2036) |
|---|---|
| Germany | 10.6% |
| Brazil | 9.7% |
| United States | 8.7% |
| United Kingdom | 7.8% |
| Japan | 6.9% |
Source: Fact.MR analysis. Updated Oct 22, 2026
What supports Germany’s adoption?
10.6% CAGR, driven by premium vehicle production and rising electric car registrations.
German car makers fit OLED panels to digital cockpits and rear lamps, and their suppliers need materials that survive cabin heat. The Kraftfahrt-Bundesamt reported 545,142 new battery-electric passenger cars in 2025, a 19.1% share of registrations [5]. Destatis reported that 67% of households had a smart TV in 2024 [6].
How is Brazil scaling demand?
9.7% CAGR, backed by wider mobile phone ownership and internet use on television screens.
IBGE reported in July 2026 that 89.8% of Brazilians aged 10 or older had a personal mobile phone in 2025 [7]. The same survey found that 57.8% of internet users went online through a television [7]. Brazil imports most OLED panels, so material demand reaches the country through finished phones and TVs assembled locally or abroad.
What supports United States adoption?
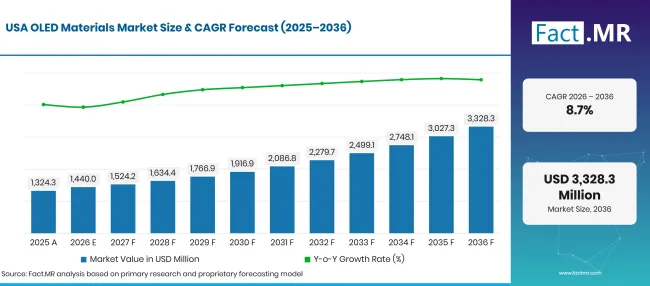
8.7% CAGR, helped by heavy spending on laptops, monitors and premium phones.
Factmr Oled Materials Market Forecast Usa | Source: Fact.MR
The Bureau of Economic Analysis reported that U.S. imports of computers increased by $101.4 billion in 2025 [8]. OLED screens are moving into these laptops and monitors, which raises the material content of the installed base. American car brands also fit large digital cabins to their electric models.
How is the United Kingdom developing demand?
7.8% CAGR, on the back of fast growth in zero emission car registrations.
The Department for Transport reported that 473,000 zero emission cars were registered for the first time in 2025, an increase of 24% from 2024 [9]. Those cars made up 23% of new registrations [9]. Electric models tend to carry large digital displays, and some premium models offer OLED cabin screens.
How does Japan perform?
6.9% CAGR, reflecting near-universal smartphone ownership and a mature material supply base.
The Cabinet Office reported that 93.5% of households with two or more people owned a smartphone as of March 2026 [10]. With ownership this high, growth comes from replacement and from OLED laptops and tablets. Japanese chemical groups such as Idemitsu Kosan, Hodogaya Chemical and Nippon Steel Chemical & Material develop emitter, host and transport materials at home and supply panel lines across East Asia.
Who leads the OLED Materials Market?
The field splits into three roles. Universal Display Corporation licenses phosphorescent OLED technology and sells emitter materials, and in August 2026 it introduced OLEDX, a device architecture that recovers light trapped inside OLED devices [11].
Korean chemical groups compete on scale and closeness to panel lines: Samsung SDI (including Novaled) supplies green host, p-dopant and ETL materials, LG Chem makes HIL, HTL, EML and ETL materials, and Duksan Neolux focuses on red host and transport layers. Japanese and European suppliers compete on chemistry depth. Idemitsu Kosan is known for its blue emitter technology. Hodogaya Chemical reported in October 2026 that it is building a plant in South Korea for OLED materials [12]. Nippon Steel Chemical & Material supplies phosphorescent hosts, Sumitomo Chemical lists polymer and small-molecule OLED materials [13], and Merck develops barrier materials for flexible panels [4]. Panel qualification wins and blue emitter progress will separate the stronger suppliers.
Which companies are the key providers?
Key companies include Universal Display Corporation; Samsung SDI Co., Ltd. (including Novaled); LG Chem, Ltd.; Merck KGaA; Idemitsu Kosan Co., Ltd.; Hodogaya Chemical Co., Ltd.; Duksan Neolux Co., Ltd.; Nippon Steel Chemical & Material Co., Ltd.; and Sumitomo Chemical Co., Ltd.
- Universal Display Corporation
- Samsung SDI Co., Ltd. (including Novaled)
- LG Chem, Ltd.
- Merck KGaA
- Idemitsu Kosan Co., Ltd.
- Hodogaya Chemical Co., Ltd.
- Duksan Neolux Co., Ltd.
- Nippon Steel Chemical & Material Co., Ltd.
- Sumitomo Chemical Co., Ltd.
Bibliography
- [1] International Telecommunication Union. (2025, November 17). Facts and Figures 2025.
- [2] International Energy Agency. (2025). Global EV Outlook 2025: Executive summary.
- [3] Universal Display Corporation. (2026, February 19). Universal Display Corporation Announces Fourth Quarter and Full Year 2025 Financial Results.
- [4] Merck KGaA. (2026, March 5). Electronics: Research and development, Annual Report 2025.
- [5] Kraftfahrt-Bundesamt. (2026, January 6). Fahrzeugzulassungen im Dezember 2025: Jahresbilanz [Vehicle registrations in December 2025: Annual review].
- [6] Statistisches Bundesamt (Destatis). (2026, August 17). Smarte Fernseher in 67 % der Privathaushalte [Smart TVs in 67% of private households].
- [7] Instituto Brasileiro de Geografia e Estatística (IBGE). (2026, July 2). Proporção de usuários da internet no país ultrapassou 90% da população de 10 anos ou mais, em 2025 [Share of internet users passed 90% of the population aged 10 or older in 2025].
- [8] U.S. Bureau of Economic Analysis. (2026, February 19). U.S. International Trade in Goods and Services, December and Annual 2025.
- [9] Department for Transport. (2026, April 29). Vehicle licensing statistics, United Kingdom: 2025.
- [10] Cabinet Office, Japan, Economic and Social Research Institute. (2026, April 9). 消費動向調査 令和8年3月実施調査結果 [Consumer Confidence Survey: March 2026 results].
- [11] Universal Display Corporation. (2026, August 19). Universal Display Corporation Unveils OLEDX, A Breakthrough Technology Platform for Driving a New Era of OLED Efficiency and Performance.
- [12] Hodogaya Chemical Co., Ltd. (2026, October). Hodogaya Chemical Group Report: Integrated Report 2026.
- [13] Sumitomo Chemical Co., Ltd. (2025, June). Investors’ Handbook 2025.
This Report Answers
- How much OLED material revenue will each material type, application and end-user industry generate through 2036?
- For every segment, the leading subsegment is named along with the device and process reasons behind its 2026 share.
- Vehicle registrations, device ownership and import data frame the comparison of Germany, Brazil, the United States, the United Kingdom and Japan.
- Suppliers are grouped into licensors, Korean chemical groups and Japanese and European specialists, with recent moves from each.
- Which technical barriers, such as moisture sensitivity and long qualification, could slow new grades?
What does the OLED Materials Market cover?
The OLED Materials Market covers the functional layers inside an OLED device: emitters and hosts, hole and electron transport compounds, conductive layers, substrates and encapsulation. These materials go into panels for phones, televisions, monitors, wearables, vehicles, lighting and medical screens.
Revenue is measured at the point where materials are sold to panel makers and their sublayer suppliers. The value of finished panels and devices is not counted.
What is included in the scope?
Small-molecule and polymer materials made for evaporation or inkjet printing are in scope, along with thin-film encapsulation inks and barrier layers. Polyimide and thin glass sold as OLED substrates are counted.
Materials used in OLED lighting panels and automotive tail lamps are included. Research quantities sold to panel developers also count when invoiced as OLED materials.
What is excluded from the scope?
Finished smartphones, televisions, monitors and display modules fall outside this assessment, as do deposition tools. LCD materials used in large-area LCD displays are excluded.
General-purpose solvents, gases and chemicals not sold for OLED use are left out. MicroLED and quantum dot materials sold outside OLED stacks are also excluded.
How Was the Analysis Built?
The analysis draws on 120+ sources, 35+ company portfolios, 25+ countries, and more than 20 industry interviews.
- Primary Research: Primary research includes discussions with manufacturers, service providers, technology developers, distributors, end users, and subject-matter experts. These conversations examine purchasing priorities, product adoption, operational challenges, approval requirements, competitive positioning, and the factors that influence wider market acceptance.
- Desk Research: Desk research covers government statistics, regulatory publications, company filings, trade data, technical studies, industry associations, standards, public policy, and other authoritative sources. Every source used in the analysis is documented in the bibliography.
- Market Sizing and Forecasting: Market estimates combine historical performance, demand indicators, pricing and volume trends, segment shares, company participation, country-level growth, adoption patterns, investment activity, and barriers to market expansion.
- Data Validation and Update Cycle: Findings are validated by comparing primary interviews with public data, company activity, regulatory changes, trade patterns, and industry developments. Regular updates review new product launches, capacity changes, partnerships, approvals, and shifts in commercial adoption.
Segmentation
What is the report’s scope and coverage?
Factmr Oled Materials Market Taxonomy | Source: Fact.MR
| Attribute | Details |
|---|---|
| Quantitative Units | USD billion in 2026 to USD billion by 2036 at CAGR |
| Market Definition | Organic and inorganic functional materials sold for OLED device fabrication, including emissive, conductive, substrate and encapsulation materials. Value is counted at the material level, before panel assembly. |
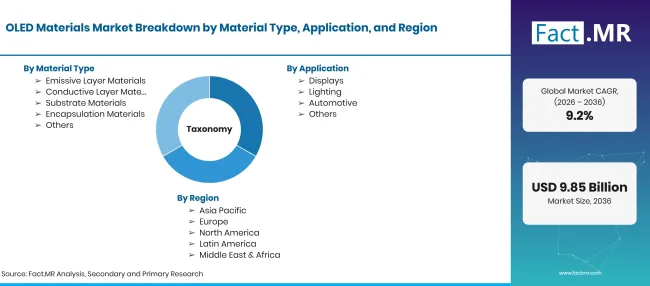
| Material Type | Emissive Layer Materials; Conductive Layer Materials; Substrate Materials; Encapsulation Materials; Others |
| Application | Displays; Lighting; Automotive; Others |
| End-User Industry | Consumer Electronics; Healthcare; Industrial; Others |
| Regions Covered | North America; Latin America; Western Europe; Eastern Europe; East Asia; South Asia & Pacific; Middle East & Africa |
| Countries Covered | Germany; Brazil; United States; United Kingdom; Japan |
| Companies Profiled | Universal Display Corporation; Samsung SDI Co., Ltd. (including Novaled); LG Chem, Ltd.; Merck KGaA; Idemitsu Kosan Co., Ltd.; Hodogaya Chemical Co., Ltd.; Duksan Neolux Co., Ltd.; Nippon Steel Chemical & Material Co., Ltd.; Sumitomo Chemical Co., Ltd. |
| Forecast Period | 2026 to 2036 |
| Approach | Hybrid top-down and bottom-up approach using OLED panel area shipped by device type; material grams per square meter by layer; qualification status by supplier; and country device ownership data. |
Source: Fact.MR analysis. Updated Oct 22, 2026
How is the market segmented?
-
By Material Type
- Emissive Layer Materials
- Conductive Layer Materials
- Substrate Materials
- Encapsulation Materials
- Others
-
By Application
- Displays
- Lighting
- Automotive
- Others
-
By End-User Industry
- Consumer Electronics
- Healthcare
- Industrial
- Others
-
By Region
- North America
- Latin America
- Western Europe
- Eastern Europe
- East Asia
- South Asia & Pacific
- Middle East & Africa
Frequently Asked Questions
How big is the OLED materials market in 2026?
What is the CAGR of the OLED materials market from 2026 to 2036?
Which material type leads the OLED materials market?
Which application holds the leading share?
Which end-user industry contributes the most?
Which country will record the strongest growth?
Who are the main companies in the OLED materials market?
Who worked on this report


Preview the report firsthand - request a free sample
Free SampleGet the brochure for pricing and purchase details
Download PDF