- Market Value (2025): USD 1847.3 Bn
- Estimated Value (2026): USD 1914.3 Bn
- Forecast Value (2036): USD 2734.1 Bn
- CAGR (2026-2036): 3.6%
What is the Onshore Oil and Gas Market forecast to be worth by 2036?
USD 1,914.3 Billion in 2026 to USD 2,734.1 Billion by 2036, at a 3.6% CAGR.
- As per Fact.MR analysis, the onshore oil and gas market reached USD 1,847.3 Billion in 2025.
- Demand will increase from USD 1,914.3 Billion in 2026 to USD 2,734.1 Billion in 2036.
- The market is forecast to record a 3.6% CAGR during 2026 to 2036 driven by expanding industrial natural gas feedstock requirements, tight oil extraction efficiencies across unconventional shale basins, power generation fuel-switching, and enhanced oil recovery investments in mature producing fields.
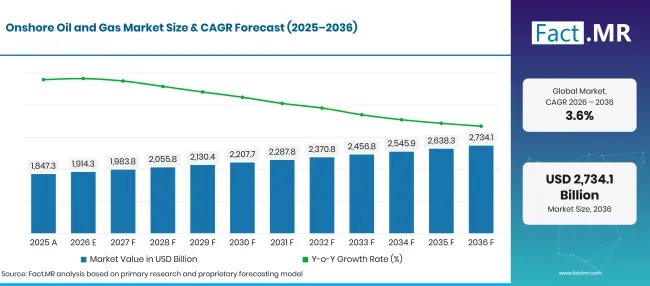
Factmr Onshore Oil And Gas Market Forecast Global | Source: Fact.MR
| Year | Basis | Market Value (USD Billion) |
|---|---|---|
| 2025 | Actual | 1,847.3 |
| 2026 | Estimate | 1,914.3 |
| 2036 | Forecast | 2,734.1 |
| CAGR 2026 to 2036 | Forecast period | 3.6% |
Source: Fact.MR analysis. Updated Oct 22, 2026
What are the defining numbers behind Onshore Oil and Gas Market growth?
USD 819.8 Billion absolute chance between 2026 and 2036, with crude oil and conventional extraction generating the largest production volume.
- Demand Drivers in the Market
- Federal mineral leasing frameworks and onshore environmental safety regulations govern drilling operations, well completion standards, and casing integrity across public and private lands [1]. Energy regulatory agencies enforce strict waste prevention rules and flaring restrictions, compelling operators to deploy vapor recovery units and automated tank battery monitoring systems across multi-well pad locations.
- Pipeline safety mandates and minimum federal transportation regulations require regular inline inspection, cathodic protection, and real-time supervisory monitoring across thousands of miles of gathering and transmission pipelines [2]. Midstream infrastructure operators invest heavily in automated emergency shutdown valves and satellite methane leak detection to eliminate fugitive emissions and ensure safe hydrocarbon transport from remote onshore basins to refining centers.
- Environmental chemistry assessments of hydraulic fracturing fluids and produced water management confirm that modern operators are replacing hazardous chemical additives with biodegradable friction reducers and non-toxic surfactants [3]. Commercial operators increasingly treat and recycle 100% of flowback water within closed-loop systems, reducing freshwater acquisition needs and mitigating disposal well seismicity risks across high-density shale plays.
- Technological breakthroughs in pre-CO2-energized fracturing and supercritical gas stimulation are unlocking immense hydrocarbon volumes from tight sandstone and deep shale formations while reducing reservoir water consumption [4]. Advanced multi-phase fluid dynamics and micro-seismic fracture mapping enable reservoir engineers to optimize lateral cluster spacing, achieving 25% higher initial production rates and extending well drainage longevity.
- Key Segments Analyzed
- By Product Type: Crude Oil holds 58.4% share in 2026, representing the world's primary transportation fuel feedstock, petrochemical precursor, and lubricating base oil.
- By Application: Industrial accounts for 34.7% share in 2026, driven by intense energy demand from chemical manufacturing, petrochemical cracking, steel refining, and heavy manufacturing facilities.
- By Technology: Conventional accounts for 57.4% share in 2026, supported by established onshore producing fields utilizing vertical drilling, artificial lift beam pumps, and secondary waterflooding recovery techniques.
- Analyst Opinion at Fact.MR
- Shambhu Nath Jha, Principal Consultant at Fact.MR, states, “The onshore hydrocarbon sector has definitively entered an era of digital automation and carbon efficiency. Upstream operating margins are dictated by cost-per-barrel optimization rather than speculative drilling expansion. Exploration and production conglomerates that deploy automated pad drilling rigs, electrified hydraulic fracturing fleets, and machine learning-guided wellbore navigation will maintain strong cash flow resilience as the global energy landscape navigates structural diversification.”
- Strategic Implications
- Upstream operating companies are integrating physics-informed machine learning and Transformer neural networks into automated reservoir simulation engines. Peer-reviewed subsurface production models confirm that machine learning algorithms accurately forecast bottom-hole flowing pressures and optimize choke settings in deep onshore shale wells, boosting estimated ultimate recovery by up to 14% [5]. Automating wellbore pressure control prevents formation damage and optimizes pump lifecycle efficiency.
- Drilling contractors are electrifying onshore drilling rigs and hydraulic fracturing spreads, replacing diesel generation with high-voltage utility grid ties and field gas reciprocating turbines. Transitioning to e-frac operations reduces onsite fuel combustion costs by up to 45% while significantly lowering localized particulate and nitrogen oxide emissions across drilling communities.
- Independent operators are establishing long-term sand logistics and bulk chemical distribution hubs directly adjacent to core shale basins. Sourcing locally mined regional proppants eliminates long-haul rail transport overhead, substantially reducing well completion capital expenditures.
- Pipeline gathering operators are retrofitting existing compressor stations with zero-emission electric motor drives and installing dry gas seal retrofits on centrifugal booster pumps. Complying with updated methane reduction directives protects operating licenses and supports corporate environmental sustainability benchmarks.
The United States is projected to record a 4.6% CAGR, while the United Kingdom advances at 4.3%, driven by refining modernization and pipeline infrastructure upgrades. Japan achieves a 3.9% CAGR, supported by industrial natural gas distribution and strategic petroleum storage management. Brazil registers a 3.6% CAGR, fueled by mature onshore basin reactivation programs and expanding gas-to-wire energy projects. Germany expands at 3.1%, underpinned by industrial pipeline integrity retrofits, strategic natural gas storage management, and strict emissions compliance across domestic chemical processing corridors.
How does the Onshore Oil and Gas Market break down by segment?
Crude Oil 58.4%; Industrial 34.7%; Conventional 57.4% in 2026.
Which Product Type dominates?
Crude Oil holds 58.4% share in 2026.
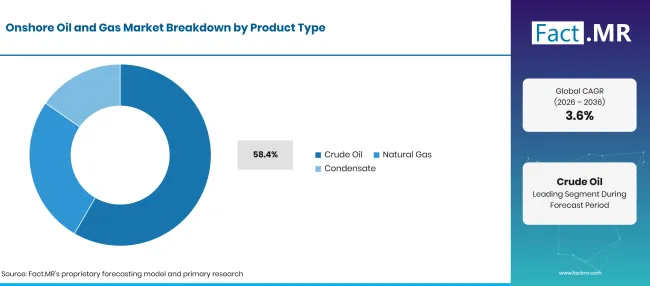
Factmr Onshore Oil And Gas Market Breakdown Product Type | Source: Fact.MR
| Product Type | Share (2026) |
|---|---|
| Crude Oil (Leading segment) | 58.4% |
| Other segments combined | 41.6%* |
| Total | 100.0% |
Source: Fact.MR analysis. Updated Oct 22, 2026
Crude oil represents the core foundation of onshore hydrocarbon output, fulfilling vital baseline requirements across global petroleum refineries for diesel, gasoline, jet fuel, and petrochemical naphtha. Upstream producers utilize advanced artificial lift systems, progressing cavity pumps, and downhole electrical submersible pumps to sustain crude flow rates across mature reservoirs. In natural gas gathering, midstream operators deploy durable oil and gas pipes engineered with corrosion-resistant internal coatings to transport sour hydrocarbon fluids safely. Drilling contractors also formulate advanced drilling fluid solutions to maintain hydrostatic wellbore balance and prevent formation blowouts. In urban and ecologically sensitive drilling zones, operators utilize horizontal directional drilling to establish multi-well cluster pads that tap extensive reservoir reserves from a compact surface footprint.
What leads the Application segment?
Industrial accounts for 34.7% share in 2026.
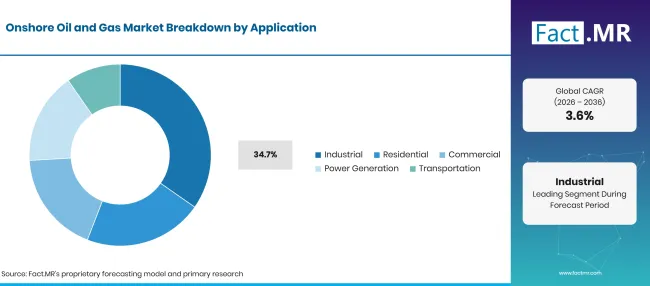
Factmr Onshore Oil And Gas Market Breakdown Application | Source: Fact.MR
| Application | Share (2026) |
|---|---|
| Industrial (Leading segment) | 34.7% |
| Other segments combined | 65.3%* |
| Total | 100.0% |
Source: Fact.MR analysis. Updated Oct 22, 2026
Industrial processing represents the largest single consuming application, driven by chemical synthesis, fertilizer production, refinery cracking units, and industrial manufacturing plants. Industrial boilers and thermal processing kilns consume vast quantities of dry natural gas to maintain stable manufacturing temperatures. Ongoing investments in global exploration and production ensure reliable hydrocarbon feedstocks for petrochemical complexes. Heavy manufacturing sites install high-capacity specialized oil pumps to transfer viscous hydrocarbon feedstocks through refining and fractionation systems. Field service companies perform routine subsea well intervention and onshore well workovers to remediate downhole scale deposits, repair mechanical packers, and sustain reservoir drainage.
How does Technology influence field extraction?
Conventional accounts for 57.4% share in 2026.
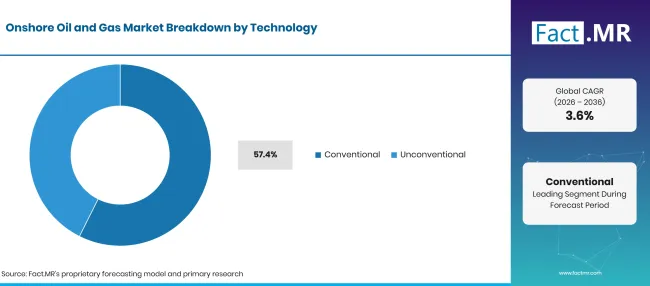
Factmr Onshore Oil And Gas Market Breakdown Technology | Source: Fact.MR
| Technology | Share (2026) |
|---|---|
| Conventional (Leading segment) | 57.4% |
| Other segments combined | 42.6%* |
| Total | 100.0% |
Source: Fact.MR analysis. Updated Oct 22, 2026
Conventional extraction methods maintain the majority share of global onshore hydrocarbon production, benefiting from lower production decline rates, established reservoir pressure dynamics, and predictable operational expenditures. Mature onshore fields in the Middle East, North America, and Eastern Europe rely on conventional vertical wells supported by waterflooding and polymer injection to extract remaining reserves. Power generation facilities deploy heavy-duty industrial gas turbine units powered by field-separated natural gas to produce base-load electricity for remote drilling grids. Off-grid industrial plants and localized municipal networks utilize small-scale LNG systems to distribute natural gas to regions lacking pipeline connectivity. Furthermore, operators install composite flexible pipe infrastructure to accelerate gathering network construction over rough terrain, while utilizing cryogenic control valves to regulate extreme low-temperature fluid handling across gas processing plants.
What is accelerating Onshore Oil and Gas Market adoption, and what is holding it back?
Sustained global energy demand, horizontal drilling efficiency breakthroughs, and industrial petrochemical feedstock requirements accelerate market expansion. Geopolitical supply chain volatility, strict emissions regulatory enforcement, and capital allocation discipline toward renewable energy projects restrict unrestricted exploration growth.
Drivers Impact Analysis
| DRIVER | (~) % IMPACT ON CAGR | GEOGRAPHIC RELEVANCE | IMPACT TIMELINE |
|---|---|---|---|
| Sustained baseline demand for petrochemical feedstocks and transportation fuels | +1.3% | Global | Short term (<= 2 years) |
| Adoption of multi-well pad drilling and electrified hydraulic fracturing spreads | +1.1% | North America, Middle East | Short term (<= 2 years) |
| Global power generation fuel-switching from coal to clean-burning natural gas | +0.9% | East Asia, Europe | Medium term (2–4 years) |
| Enhanced oil recovery (EOR) projects revitalizing mature conventional fields | +0.7% | North America, Latin America | Medium term (2–4 years) |
| Deployment of automated pipeline leak detection and vapor recovery units | +0.5% | Global | Long term (>= 4 years) |
Source: Fact.MR analysis. Updated Oct 22, 2026
Opportunity Impact Analysis
| OPPORTUNITY | (~) % IMPACT ON CAGR | GEOGRAPHIC RELEVANCE | IMPACT TIMELINE |
|---|---|---|---|
| Subsurface carbon capture, utilization, and storage (CCUS) integrated with EOR | +1.2% | USA, Western Europe | Short term (<= 2 years) |
| Edge AI-guided directional drilling optimizing sweet-spot lateral navigation | +1.0% | North America, Middle East | Medium term (2–4 years) |
| Closed-loop produced water recycling reducing freshwater acquisition costs | +0.8% | USA, Latin America | Medium term (2–4 years) |
| Virtual pipeline distribution networks delivering compressed gas to off-grid users | +0.6% | Emerging Markets | Long term (>= 4 years) |
Source: Fact.MR analysis. Updated Oct 22, 2026
Restraints Impact Analysis
| RESTRAINT | (~) % IMPACT ON CAGR | GEOGRAPHIC RELEVANCE | IMPACT TIMELINE |
|---|---|---|---|
| High production decline rates in unconventional tight shale formations | -1.0% | North America | Short term (<= 2 years) |
| Strict regulatory penalties on methane venting, flaring, and fugitive emissions | -0.8% | Europe, North America | Medium term (2–4 years) |
| Raw material price volatility in high-grade drill pipes and proppant ceramics | -0.6% | Global | Medium term (2–4 years) |
| Institutional investor capital redirection toward renewable decarbonization assets | -0.4% | Western Europe, USA | Long term (>= 4 years) |
Source: Fact.MR analysis. Updated Oct 22, 2026
Which countries are scaling the Onshore Oil and Gas Market through 2036?
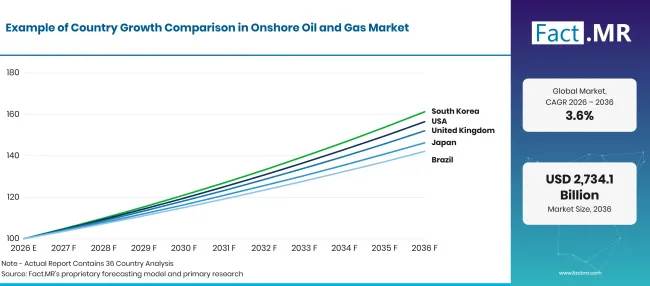
Factmr Onshore Oil And Gas Market Growth Index | Source: Fact.MR
| Country | CAGR (2026–2036) |
|---|---|
| USA | 4.6% |
| UK | 4.3% |
| Japan | 3.9% |
| Brazil | 3.6% |
| Germany | 3.1% |
Source: Fact.MR analysis. Updated Oct 22, 2026
Why is the United States leading global market expansion?
4.6% CAGR, driven by immense unconventional shale output in the Permian Basin, record-breaking LNG export liquefaction capacity, and rapid adoption of digital pad automation.
The United States represents the undisputed epicenter of global onshore hydrocarbon production, spearheaded by the prolific Permian, Eagle Ford, Bakken, and Marcellus shale formations. Official data from the U.S. Energy Information Administration (EIA) confirms that domestic crude oil production surpassed a record 13.2 million barrels per day, with onshore shale plays generating over 78% of total national liquid output [6]. Furthermore, gross natural gas withdrawals reached an all-time high of over 103 billion cubic feet per day, feeding immense export demand across Gulf Coast liquefaction terminals. American operators deploy super-spec drilling rigs capable of walking across multi-well pads, completing two-mile laterals in under 11 days. Electrified hydraulic fracturing fleets operating in Texas and New Mexico have reduced fuel consumption by 40% while slashing field emissions, cementing the United States as the world's most capital-efficient onshore energy producer.
How is the United Kingdom advancing energy infrastructure?
4.3% CAGR, supported by critical onshore terminal infrastructure, strategic natural gas storage developments, and pipeline integrity modernizations.
While the United Kingdom’s historical petroleum production is centered offshore in the North Sea, the nation maintains critical onshore processing hubs, receiving terminals, and extensive pipeline grids that manage over 28,000 kilometers of high-pressure gas distribution infrastructure. Official statistics from the UK North Sea Transition Authority and Department for Energy Security and Net Zero show that onshore terminals process over 45% of the country’s natural gas consumption, serving as the essential intake points for interconnector pipelines and LNG import cargoes [7]. British energy operators are investing over USD 720 million across onshore compressor stations and underground salt cavern storage sites to strengthen winter gas resilience. Strict environmental oversight enforced by the UK Health and Safety Executive compels operators to execute continuous ultrasonic pipeline integrity scanning, maintaining high safety standards across the national energy transit network.
What sustains energy procurement in Japan?
3.9% CAGR, propelled by industrial natural gas distribution, strategic petroleum reserves management, and advanced downstream refining engineering.
Japan possesses limited domestic hydrocarbon reserves, compelling the nation to operate one of the world's most sophisticated and secure downstream oil refining, crude storage, and LNG regasification infrastructures. According to official data from Japan's Ministry of Economy, Trade and Industry (METI), the Japanese government and private oil companies maintain strategic petroleum reserves totaling over 480 million barrels across 10 national storage bases and private coastal terminals, representing more than 240 days of domestic consumption [8]. Japanese energy utilities process over 66 million tons of imported LNG annually, utilizing advanced onshore cryogenic vaporization plants and high-pressure regional distribution pipelines to power metropolitan industrial zones and urban combined-cycle power stations. Japanese industrial engineering firms lead global research in gas-to-wire systems, high-efficiency micro-turbines, and leak-free valve technology to maximize energy throughput.
What opportunities are unfolding across Brazil?
3.6% CAGR, backed by mature onshore basin revitalization programs, the REFORMA project, and expanding gas-to-wire energy generation in the Northeast.
While Brazil’s headline petroleum production is led by deepwater offshore pre-salt basins, the Brazilian government’s REFORMA and REATE programs have catalyzed an onshore production renaissance across mature fields in the Potiguar, Recôncavo, and Sergipe-Alagoas basins. Official statistics from Brazil's National Agency of Petroleum, Natural Gas and Biofuels (ANP) reveal that independent onshore operators increased production by 24% over the past two years, operating over 6,500 active onshore wells [9]. Brazil's onshore natural gas production exceeded 26 million cubic meters per day, with operators increasingly implementing innovative gas-to-wire installations that burn associated gas directly at wellheads to generate electricity for local power grids, eliminating flaring and monetizing previously stranded inland energy reserves.
What sustains infrastructure modernization in Germany?
3.1% CAGR, rooted in Germany’s strategic gas pipeline grid, extensive subterranean gas storage infrastructure, and rigorous industrial emissions standards.
Germany represents Central Europe's critical transit crossroads and largest national consumer of natural gas, operating over 511,000 kilometers of gas pipeline networks and Europe's largest underground gas storage capacity exceeding 24 billion cubic meters across 47 subterranean salt caverns and porous rock reservoirs. Data from the German Federal Network Agency (Bundesnetzagentur) shows that domestic industrial facilities consume over 48% of total natural gas throughput, requiring pristine pipeline reliability to feed massive chemical parks in North Rhine-Westphalia and Rhineland-Palatinate [10]. Although domestic exploration is modest, German operators deploy high-precision seismic monitoring and automated valve stations to maintain strict adherence to Federal Immission Control Act standards. Ongoing investments focus on ensuring all pipeline infrastructure and compression stations achieve 100% technical readiness for blended hydrogen transit.
Who leads the Onshore Oil and Gas Market?
ExxonMobil commands a dominant global operating position, leveraging vast unconventional acreage positions across the Permian Basin, proprietary subsurface modeling software, and extensive global refining integration. Saudi Aramco operates the world's most productive onshore conventional fields, maintaining immense low-cost hydrocarbon reserves and deploying cutting-edge robotics and automated reservoir diagnostics. Shell delivers comprehensive upstream and integrated gas solutions, operating large-scale onshore gas processing facilities, liquefaction terminals, and CCUS projects worldwide.
Chevron maintains massive Permian and global onshore assets, executing factory-model drilling that optimizes well completion economics and minimizes surface footprint. BP actively develops onshore tight gas and conventional fields while advancing automated pad electrification and emissions reduction technologies. TotalEnergies integrates world-class exploration with global gas supply infrastructure, expanding investments in LNG export terminals and low-carbon upstream production. ConocoPhillips stands as an undisputed leader in independent unconventional exploration, operating premium asset positions across the Eagle Ford, Bakken, and Delaware basins. Gazprom controls the world's largest onshore natural gas reserves and pipeline transmission networks across the Eurasian landmass. PetroChina leads Asian onshore hydrocarbon development, managing immense conventional and tight oil production across the Daqing, Changqing, and Tarim basins. Eni brings advanced exploration capabilities, deploying proprietary supercomputing algorithms to optimize onshore reservoir recovery across Africa, Europe, and the Americas.
Which companies are the key providers?
Key companies include ExxonMobil; Saudi Aramco; Shell; Chevron; BP; TotalEnergies; ConocoPhillips; Gazprom; PetroChina; and Eni.
- ExxonMobil
- Saudi Aramco
- Shell
- Chevron
- BP
- TotalEnergies
- ConocoPhillips
- Gazprom
- PetroChina
- Eni
Bibliography
- [1] Bureau of Land Management. (2025). Onshore Oil and Gas Operations; Federal and Indian Oil and Gas Leases; Measurement of Oil and Gas (43 CFR Part 3160). Electronic Code of Federal Regulations.
- [2] Pipeline and Hazardous Materials Safety Administration. (2025). Transportation of Natural and Other Gas by Pipeline: Minimum Federal Safety Standards (49 CFR Part 192). Electronic Code of Federal Regulations.
- [3] Zhang, W., et al. (2025). Environmental assessment and chemical composition profiles of hydraulic fracturing fluids in unconventional onshore shale extraction. Science of the Total Environment, 951, 175612.
- [4] Li, X., et al. (2026). Experimental study on fracture propagation and reservoir stimulation using pre-CO2-energized hydraulic fracturing in tight sandstone formations. Energy Reports, 13, 2410–2422.
- [5] Wang, J., et al. (2025). Machine learning-based production forecasting and wellbore pressure optimization in deep onshore shale gas wells. Journal of Petroleum Science and Engineering, 245, 113421.
- [6] U.S. Energy Information Administration. (2025). Drilling Productivity Report and Monthly Crude Oil and Natural Gas Production Statistics. U.S. Department of Energy.
- [7] Department for Energy Security and Net Zero. (2025). UK Onshore Gas Processing, Storage Infrastructure, and Energy Security Strategy. UK Government Publications.
- [8] Ministry of Economy, Trade and Industry. (2025). Petroleum Reserves Management, Energy Security, and Natural Gas Liquefaction Strategy. Government of Japan.
- [9] Costa, H. K. M., et al. (2024). Brazilian natural gas market dynamics: A data panel analysis of upstream and onshore distribution frameworks. Heliyon, 10(21), e39190.
- [10] Oberle, S., et al. (2024). Analyzing the regulatory framework and operational transition for gas transmission networks in Germany. Heliyon, 10(24), e40800.
This Report Answers
- The report evaluates production decline curves, wellhead pressure economics, and artificial lift efficiency across conventional and unconventional onshore plays.
- Application assessments detail why industrial manufacturing and petrochemical crackers account for more than a third of total global hydrocarbon consumption.
- Country-level analysis investigates the leasing regulations and infrastructure investments enabling the United States and the United Kingdom to maintain leading growth rates.
- Drilling engineering comparisons examine lateral length limits, proppant loading densities, and water recycling economics in deep horizontal shale wells.
- Competitive profiling benchmarks lifting costs per barrel, carbon intensity metrics, and digital pad automation patents across premier global exploration and production companies.
What does the Onshore Oil and Gas Market cover?
The market encompasses upstream commercial exploration, well construction, hydraulic fracturing, artificial lift production, gathering line transport, and field separation for onshore hydrocarbon assets. It tracks crude petroleum, associated natural gas, non-associated shale gas, and natural gas liquids (NGLs) produced from terrestrial land-based wells. The analysis evaluates value creation across integrated supermajors, national oil companies, independent exploration and production operators, and upstream oilfield service providers.
What is included in the scope?
The scope covers the gross revenue value of merchant crude oil, natural gas, and condensate deliveries measured at the lease custody transfer point and regional gathering hub.
It includes field-level capital expenditures on drilling rigs, casing strings, downhole pumps, wellhead Christmas trees, surface separation separators, and gathering pipeline installations. Both conventional vertical reservoir production and unconventional multi-stage horizontal shale plays are fully integrated within market valuation totals.
What is excluded from the scope?
The scope excludes all offshore continental shelf, deepwater, and ultra-deepwater marine oil and gas production.
Downstream petroleum product retail sales at automotive gas stations, consumer plastic manufacturing, and municipal residential utility distribution billings are outside the upstream exploration scope. Geothermal energy wells, water extraction boreholes, and commercial mining excavation shafts are excluded from oil and gas production totals.
How Was the Analysis Built?
The analysis draws on 120+ sources, 35+ company portfolios, 25+ countries, and more than 20 industry interviews.
- Primary Research: Primary research includes discussions with manufacturers, service providers, technology developers, distributors, end users, and subject-matter experts. These conversations examine purchasing priorities, product adoption, operational challenges, approval requirements, competitive positioning, and the factors that influence wider market acceptance.
- Desk Research: Desk research covers government statistics, regulatory publications, company filings, trade data, technical studies, industry associations, standards, public policy, and other authoritative sources. Every source used in the analysis is documented in the bibliography.
- Market Sizing and Forecasting: Market estimates combine historical performance, demand indicators, pricing and volume trends, segment shares, company participation, country-level growth, adoption patterns, investment activity, and barriers to market expansion.
- Data Validation and Update Cycle: Findings are validated by comparing primary interviews with public data, company activity, regulatory changes, trade patterns, and industry developments. Regular updates review new product launches, capacity changes, partnerships, approvals, and shifts in commercial adoption.
Segmentation
What is the report’s scope and coverage?
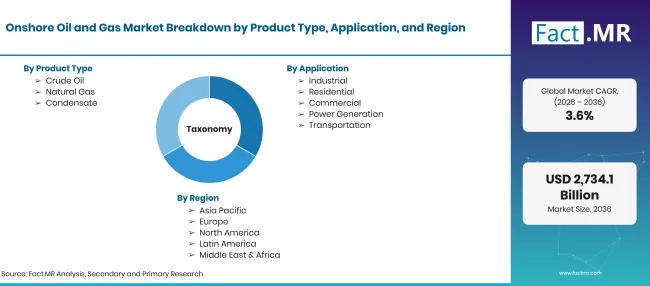
Factmr Onshore Oil And Gas Market Taxonomy | Source: Fact.MR
| Attribute | Details |
|---|---|
| Quantitative Units | USD Billion |
| Market Definition | Commercial value of onshore hydrocarbon extraction, including crude oil, natural gas, and condensate production, wellhead operations, and field processing. |
| Product Type | Crude Oil; Natural Gas; Condensate |
| Application | Industrial; Residential; Commercial; Power Generation; Transportation |
| Technology | Conventional; Unconventional |
| Regions Covered | North America; Latin America; Western Europe; Eastern Europe; East Asia; South Asia & Pacific; Middle East & Africa |
| Countries Covered | USA; UK; Japan; Brazil; Germany |
| Companies Profiled | ExxonMobil; Saudi Aramco; Shell; Chevron; BP; TotalEnergies; ConocoPhillips; Gazprom; PetroChina; Eni |
| Forecast Period | 2026 to 2036 |
| Approach | Primary interviews with upstream petroleum engineers, drilling superintendents, pipeline operations directors, and national energy ministry officials combined with global hydrocarbon production data audits. |
Source: Fact.MR analysis. Updated Oct 22, 2026
How is the market segmented?
-
By Product Type:
- Crude Oil
- Natural Gas
- Condensate
-
By Application:
- Industrial
- Residential
- Commercial
- Power Generation
- Transportation
-
By Technology:
- Conventional
- Unconventional
-
By Region:
- North America
- Latin America
- Western Europe
- Eastern Europe
- East Asia
- South Asia & Pacific
- Middle East & Africa
Frequently Asked Questions
How big is the onshore oil and gas market in 2026?
What is the CAGR from 2026 to 2036?
Which product type leads?
Which technology leads?
Which companies participate in onshore oil and gas?
Who worked on this report


Preview the report firsthand - request a free sample
Free SampleGet the brochure for pricing and purchase details
Download PDF