- Market Value (2025): USD 12.7 Bn
- Estimated Value (2026): USD 13.8 Bn
- Forecast Value (2036): USD 30.9 Bn
- CAGR (2026-2036): 8.4%
What is the Small Scale LNG Market forecast to be worth by 2036?
USD 13.8 billion in 2026 to USD 30.9 billion by 2036 at 8.4% CAGR.
- The small-scale LNG market was valued at USD 12.7 billion in 2025 as utilities and industrial operators kept funding terminal-led supply models in priority countries.
- Demand is projected to increase from USD 13.8 billion in 2026 to USD 30.9 billion by 2036.
- The market is forecast to record 8.4% CAGR from 2026 to 2036 owing to distributed fuel demand and tighter supply planning for industrial users.
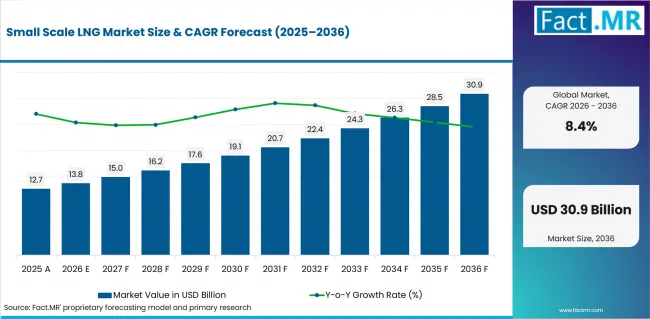
Small Scale Lng Market Value Analysis | Source: Fact.MR
What are the defining numbers behind Small Scale LNG Market growth?
USD 17.1 billion absolute opportunity by 2036, led by Liquefaction Terminals and Industrial Fuel alongside Industrial Enterprises and Cryogenic Liquefaction.
- Demand Drivers in the Market
- Liquefaction terminals require clear project evidence before buyers approve capital. Suppliers gain interest when they define site layout and storage fit. Offtake scheduling belongs in the same approval package.
- Industrial fuel users need reliable supply where pipeline access is weak or fuel switching depends on steady process heat. Small-scale LNG is expected to gain attention when delivery contracts reduce downtime risk.
- Direct supply contracts help buyers compare service accountability before they commit. Clear maintenance steps and delivery windows are expected to matter more than broad gas infrastructure claims.
- Cryogenic liquefaction remains central because buyers want proven low-temperature handling before field deployment. Equipment packages are expected to compete on safety documentation and operating consistency.
- Key Segments Analyzed
- By Product Type: Liquefaction Terminals are expected to hold 38.9% share in 2026 because terminal-led projects carry the clearest storage and supply proof.
- By Application: Industrial Fuel is projected to hold 30.7% share in 2026 as plants look for dependable fuel where pipeline reach is limited.
- By End User: Industrial Enterprises are anticipated to hold 31.9% share in 2026 since plant operators need documented delivery and safety procedures.
- By Distribution Channel: Direct Supply Contracts are estimated to hold 31.4% share in 2026 due to buyer preference for accountable supply terms.
- By Technology: Cryogenic Liquefaction is forecast to hold 43.7% share in 2026 as low-temperature reliability remains central to project approval.
- Analyst Opinion at Fact.MR
- Shambhu Nath Jha, Senior Analyst at Fact.MR, states, “Small-scale LNG suppliers have to show how a project is handed over after approval. Industrial Fuel demand converts faster when the offer connects fuel availability with service responsibility and site readiness.”
- Strategic Implications
- Utilities and industrial operators should tie liquefaction terminal proposals to a named operating problem. A stronger case shows where storage and delivery scheduling reduce fuel availability risk. Safety checks should appear in the same approval file.
- Suppliers can improve order conversion by separating product scope from service scope. Buyers need to see who owns installation checks and dispatch coordination. Maintenance response should be named before the order moves forward.
- Investors need to compare USA and Japan through buyer approval conditions. USA demand is expected to depend more on documentation and service accountability. Japan is expected to place more weight on compact footprints and reliability.
The USA is projected to grow at 10.9% CAGR from 2026 to 2036, supported by clear documentation and reliable service. Japan is expected to grow at 10.1% as buyers prefer compact and dependable systems. Germany is forecast at 9.3%, driven by product testing and supplier credibility. The UK is anticipated to record 8.4% growth as service coverage and long-term value influence contracts. Canada is estimated at 7.5% because users need dependable support across wide areas. Australia is projected at 6.7%, supported by remote-site demand and reliable project performance. Brazil is expected to reach 5.9% as distribution access and financing options improve.
How does the Small Scale LNG Market break down by segment?
Liquefaction Terminals leads Product Type at 38.9% share in 2026. Industrial Fuel leads Application at 30.7% share in the same year.
Why do Liquefaction Terminals lead Product Type?
Liquefaction Terminals are anticipated to hold 38.9% share in 2026.
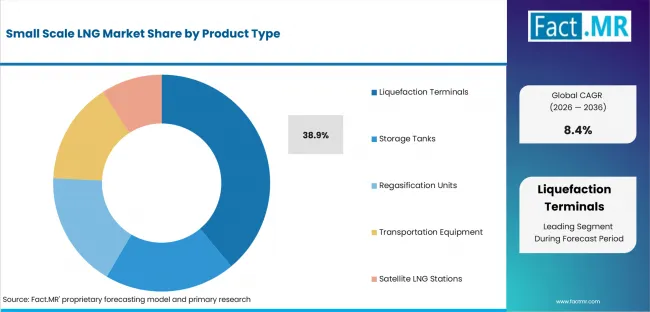
Small Scale Lng Market Analysis By Product Type | Source: Fact.MR
Large LNG projects depend on terminals to manage liquefaction, storage, loading, and delivery from one location. Their ability to handle higher volumes gives them a stronger position than smaller plant formats. Micro LNG Plants suit limited local demand, while Modular LNG Plants offer phased expansion. Storage Tanks support capacity additions but do not provide the complete processing role of a liquefaction terminal.
Why does Industrial Fuel lead Application?
Industrial Fuel is expected to hold 30.7% share in 2026.
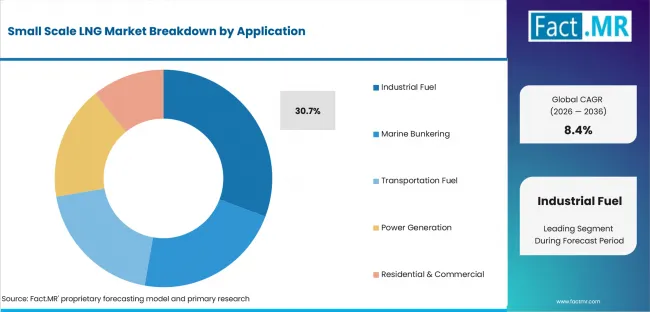
Small Scale Lng Market Analysis By Application | Source: Fact.MR
Factories use LNG as an alternative to diesel, fuel oil, or other costly fuels where pipeline gas is unavailable. Regular consumption across boilers, furnaces, and production equipment creates steady demand. Power Generation depends more on electricity requirements, while Process Heating serves specific operations. Marine Bunkering has growth potential, but port infrastructure and LNG-ready vessels limit wider use.
What supports Industrial Enterprises within End User?
Industrial Enterprises are forecast to hold 31.9% share in 2026.
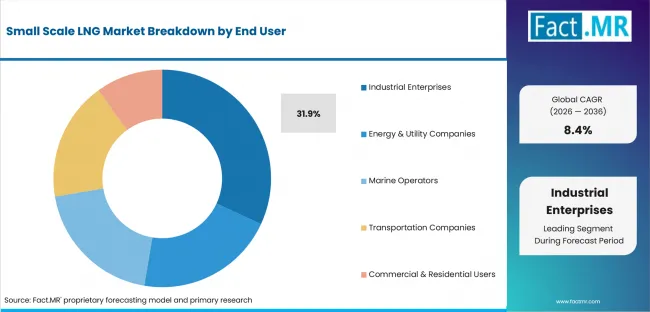
Small Scale Lng Market Analysis By End User | Source: Fact.MR
High daily energy consumption makes Industrial Enterprises the largest user group. Manufacturing plants and chemical facilities require dependable fuel supplies to avoid production delays and control operating costs. These users can also justify dedicated LNG infrastructure through long-term consumption. Energy and Utility Companies participate in larger supply projects, although their investment decisions usually involve regulatory reviews and longer approval periods.
How do Direct Supply Contracts shape Distribution Channel?
Direct Supply Contracts are estimated to hold 31.4% share in 2026.
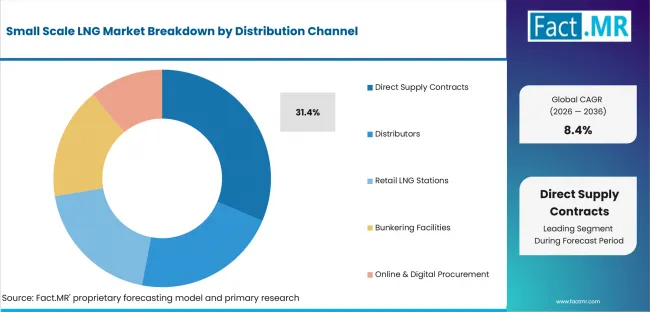
Small Scale Lng Market Analysis By Distribution Channel | Source: Fact.MR
Buyers prefer direct arrangements because pricing, delivery schedules, quality requirements, and technical support can be agreed with one supplier. This reduces uncertainty during project operation. Long-Term Supply Agreements are suitable for stable fuel demand, while Project-Based Contracts fit temporary or phased requirements. Distributors remain important for smaller customers that need local delivery rather than a customized supply arrangement.
What keeps Cryogenic Liquefaction ahead in Technology?
A 43.7% share is projected for Cryogenic Liquefaction in 2026.
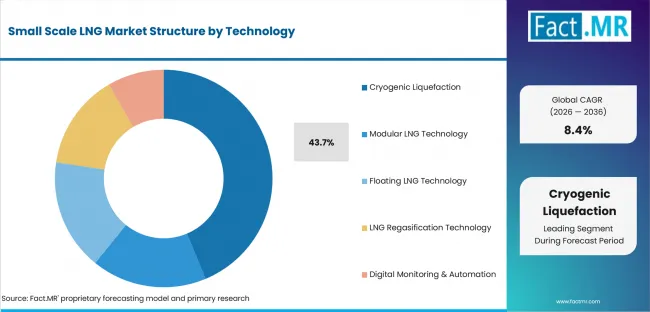
Small Scale Lng Market Analysis By Technology | Source: Fact.MR
Cryogenic Liquefaction remains widely used because it can cool natural gas to the very low temperatures required for efficient LNG production and transport. Its commercial track record supports use in large-capacity facilities. Mixed Refrigerant systems focus on energy efficiency, while Nitrogen Expansion systems are often selected for simpler or smaller plants. Modular LNG Technology mainly improves construction speed rather than replacing the core liquefaction process.
What is accelerating Small Scale LNG Market adoption, and what is holding it back?
Demand is supported by new LNG terminal projects and the shift toward LNG in industrial operations. High construction costs, difficult site planning, and unstable LNG prices may slow adoption.
Drivers Impact Analysis
| DRIVER | QUALITATIVE RELEVANCE | GEOGRAPHIC RELEVANCE | IMPACT TIMELINE |
|---|---|---|---|
| Liquefaction terminals specification pull | High | USA | Short term (<= 2 years) |
| Industrial fuel operating-duty expansion | High | Japan | Short term (<= 2 years) |
| USA route-to-market activity | Moderate | Germany | Medium term (2-4 years) |
| Industrial enterprises uptime and safety review | Selective | UK | Medium term (2-4 years) |
Source: Fact.MR analysis. Updated Jul 28, 2026
- Liquefaction terminals specification pull: Buyers are expected to approve projects faster when the terminal role is clear. The proposal has to connect liquefaction capacity with storage fit and daily offtake planning.
- Industrial fuel operating-duty expansion: Plant users need LNG systems that fit heat demand and site routines. Supplier selection is expected to depend on delivery confidence and quick service escalation.
- USA route-to-market activity: Channel activity is expected to convert better when suppliers document handover steps and service coverage. Buyers need proof that contract terms match operating responsibility after commissioning.
- Industrial enterprises uptime and safety review: Industrial buyers are expected to test LNG offers against downtime exposure and safety procedures. Clear inspection plans can shorten internal approval and reduce repeat questions from procurement teams.
Opportunity Impact Analysis
| OPPORTUNITY | QUALITATIVE RELEVANCE | GEOGRAPHIC RELEVANCE | IMPACT TIMELINE |
|---|---|---|---|
| Liquefaction terminals retrofit packages | High | USA | Medium term (2-4 years) |
| Service and inspection contracts | Moderate | Japan | Medium term (2-4 years) |
| USA project-module standardization | Selective | Germany | Medium term (2-4 years) |
Source: Fact.MR analysis. Updated Jul 28, 2026
- Liquefaction terminals retrofit packages: Retrofit demand is expected where owners need added capacity without a full site redesign. Packages that define tie-in work and safety checks can make upgrades easier to approve.
- Service and inspection contracts: Service-led offers are expected to gain attention when buyers want predictable operating support. Inspection coverage helps customers compare total cost beyond the equipment purchase.
- USA project-module standardization: Standardized modules can reduce repeated engineering effort across similar projects. Suppliers are expected to benefit when drawings and validation steps are reusable across multiple sites.
Restraints Impact Analysis
| RESTRAINT | QUALITATIVE RELEVANCE | GEOGRAPHIC RELEVANCE | IMPACT TIMELINE |
|---|---|---|---|
| Site-specific engineering and capital approval cycles for liquefaction terminals | High | USA | Short term (<= 2 years) |
| Price sensitivity around industrial fuel | Moderate | Japan | Medium term (2-4 years) |
| Slow conversion where liquefaction terminals lack buyer-side validation | Selective | Germany | Medium term (2-4 years) |
Source: Fact.MR analysis. Updated Jul 28, 2026
- Site-specific engineering and capital approval cycles for liquefaction terminals: Each site needs layout review and safety approval before procurement moves ahead. Weak documentation can stretch the decision period and delay purchase release.
- Price sensitivity around industrial fuel: Industrial users may delay LNG switching when fuel economics are unclear. Smaller suppliers face added pressure when buyers request service coverage and repeat delivery proof.
- Slow conversion where liquefaction terminals lack buyer-side validation: Conversion can slow when customers cannot compare offers using the same performance evidence. Suppliers need practical proof around storage fit and operating reliability.
Which countries are scaling Small Scale LNG Market fastest?
The global CAGR is 8.4%. Country rates show how small-scale LNG demand moves through project approval and service coverage. Channel depth then explains the final spread.
- The USA holds the highest listed CAGR because buyers place weight on terminal documentation and service accountability.
- Japan remains above the global rate where compact operating footprints and reliable fuel access influence approval.
- Germany stays near the forecast line as industrial buyers review validation evidence before switching fuel systems.
- The UK follows a service-led route because users compare delivery responsibility and life-cycle value before expanding contracts.
- Canada builds demand across dispersed sites where dependable service coverage reduces operating uncertainty.
- Australia remains within the forecast range because remote projects need clear support planning before approval.
- Brazil records a positive path where regional distribution and financing comfort decide conversion speed.
The full report provides country-level CAGR analysis across North America and Latin America. Europe and East Asia are covered in the same review. South Asia and Oceania complete the regional view alongside the Middle East and Africa.
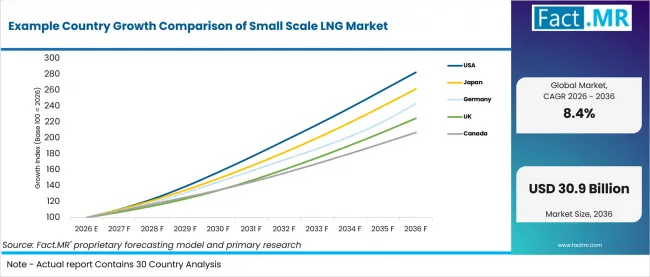
Example Country Growth Comparison Of Small Scale Lng Market | Source: Fact.MR
| Country | CAGR (2026-2036) |
|---|---|
| USA | 10.9% |
| Japan | 10.1% |
| Germany | 9.3% |
| UK | 8.4% |
| Canada | 7.5% |
| Australia | 6.7% |
| Brazil | 5.9% |
Source: Fact.MR analysis. Updated Jul 28, 2026
What supports USA adoption through 2036?
10.9% CAGR, supported by large industrial demand and stronger LNG infrastructure.
The USA is expected to lead the profiled countries as industrial users seek alternatives to pipeline gas and fuel oil. Existing gas production, storage capacity, and transport networks improve the case for new liquefaction projects. Demand is also supported by manufacturing plants, utilities, and remote facilities that require a steady fuel source. Project growth will depend on permitting speed, construction costs, and long-term supply economics.
Why does Japan remain above the global rate?
10.1% CAGR, backed by limited domestic energy resources and dependable fuel imports.
Japan relies heavily on imported energy, which strengthens the role of LNG in industrial and power applications. Compact modular plants can serve facilities where land availability is limited and installation space must be carefully managed. Buyers place strong emphasis on equipment reliability, safety controls, and uninterrupted operation. Suppliers offering smaller footprints and efficient cooling systems are likely to gain stronger acceptance.
How is Germany converting industrial demand?
9.3% CAGR, shaped by industrial decarbonization and fuel diversification.
Germany’s market is influenced by factories seeking to reduce dependence on higher-emission fuels while maintaining stable process heat. Chemical, metal, and manufacturing facilities create opportunities for LNG where electrification is not yet practical. Adoption is likely to move through pilot projects and carefully reviewed plant conversions. Strict safety standards and environmental requirements will remain central to investment decisions.
What shapes the UK route to adoption?
8.4% CAGR, led by energy security concerns and flexible fuel procurement.
UK buyers are expected to consider LNG where existing gas access is constrained or where businesses want greater control over fuel sourcing. Industrial sites, logistics hubs, and selected power users may adopt direct supply arrangements to improve delivery certainty. Growth will also depend on storage availability and contract pricing. Companies are likely to favor suppliers that can combine fuel delivery with technical support.
How does Canada build demand across distance?
7.5% CAGR, supported by remote industries and off-grid energy needs.
Canada has many mining, forestry, and industrial operations located far from major pipeline networks. Small-scale LNG can replace diesel at these sites and reduce the frequency of fuel deliveries. Cold-weather performance and long transport distances make storage design especially important. Market expansion will depend on regional supply points, dependable trucking routes, and equipment that can operate under harsh environmental conditions.
What holds Australia near the forecast range?
6.7% CAGR, shaped by mining activity and isolated industrial locations.
Australia’s LNG demand is closely connected to mining regions and remote processing facilities that require dependable on-site energy. Modular liquefaction systems can serve projects that are too distant from established gas infrastructure. Large travel distances may raise maintenance and delivery costs, which can slow purchasing decisions. Providers with local technical teams and transport partnerships are better positioned to support wider deployment.
Where does Brazil find demand growth?
5.9% CAGR, supported by expanding gas access and regional industrial development.
Brazil offers growth potential as LNG distribution moves beyond major coastal and pipeline-connected areas. Industrial facilities, commercial users, and smaller power projects can benefit where natural gas access remains limited. Demand may rise through truck-delivered LNG and regional storage hubs. However, currency pressure, financing conditions, and infrastructure gaps can affect project timing and make investment decisions more cautious.
Who leads the Small Scale LNG Market?
Shell plc and Linde plc show the direct relevance in the small-scale LNG market. Air Liquide and Chart Industries compete for specification-led and channel-led demand.
Shell plc supports LNG supply and trading networks that can serve smaller industrial and marine users. Linde plc contributes gas processing and cryogenic engineering capability for modular LNG projects. Air Liquide adds industrial gas infrastructure experience. Chart Industries strengthens the equipment field through cryogenic storage and liquefaction systems. Wartsila and Cryostar broaden the provider set through marine energy and supply. Gasum and Excelerate Energy add supply and terminal-related capabilities.
Competition is expected to depend on project documentation and service response from 2026 to 2036. Equipment proof remains important when buyers assess smaller-scale operation. Providers that explain installation responsibility and repeat support are likely to gain demand from industrial users and utilities.
Which companies are the key providers?
Key companies include Shell plc; Linde plc; Air Liquide; Chart Industries; Wartsila; Cryostar; Gasum; Excelerate Energy.
- Shell plc
- Linde plc
- Air Liquide
- Chart Industries
- Wartsila
- Cryostar
- Gasum
- Excelerate Energy
Bibliography
- U.S. Department of Energy. (2025, December 23). Listing of DOE authorizations, orders, and notices issued in 2025.
- U.S. Energy Information Administration. (2025, April 3). How will the start-up timing of the new U.S. LNG export facilities affect our forecast?
- Canada Energy Regulator. (2025, June). Market snapshot: Annual trade summary—Natural gas exports.
- Department of Industry, Science and Resources. (2025, December). Resources and energy quarterly: December 2025. Australian Government.
- Chart Industries. (2025, July 11). LNG Alliance selects Chart technology and modular solution.
- Wärtsilä. (2025, June 3). Wärtsilä regasification module selected by Höegh Evi for an important conversion project.
This Report Answers
- The report provides strategic intelligence on the Small Scale LNG Market across Product Type and Application choices that shape terminal-led project approval.
- Segment analysis covers Liquefaction Terminals and Industrial Fuel as the share leaders within the 2026 market.
- Country outlook evaluates the USA and Japan alongside Germany and the UK. Canada, Australia and Brazil complete the growth comparison across the profiled markets.
- Competitive analysis profiles Shell plc and Linde plc alongside Air Liquide and Chart Industries. Wartsila and Cryostar extend the provider list. Gasum and Excelerate Energy complete the provider set.
- Technology assessment covers Cryogenic Liquefaction and Mixed Refrigerant Process. Nitrogen Expansion Process and Modular LNG Technology complete the technology view.
What does the Small Scale LNG Market cover?
Small-scale LNG systems serve projects where LNG must be liquefied or regasified outside large-terminal economics.
The Small Scale LNG Market covers liquefaction terminals and related project packages. It includes industrial fuel and power generation where users need dependable LNG supply. Marine bunkering remains in scope when LNG is used directly for vessel fuel.
The market differs from large LNG terminals because commercial value comes from smaller projects that can be planned around local fuel needs. General gas trading remains outside the boundary. Broad energy infrastructure spending is excluded unless it directly supports small-scale LNG use.
What is included in the scope?
Coverage includes Product Type, Application and End User. Distribution Channel and Technology are included with regional demand.
The scope includes Liquefaction Terminals, Micro LNG Plants and Modular LNG Plants. Storage Tanks and Regasification Units are included when they support smaller LNG supply routes. Industrial Fuel, Power Generation and Marine Bunkering are covered when the purchase decision depends on small-scale LNG availability.
What is excluded from the scope?
General LNG megaproject spending and unrelated corporate fuel procurement remain outside the scope of this market.
The scope excludes pipeline gas spending that does not require small-scale LNG equipment. Large import terminals are excluded unless a defined smaller package is purchased for distributed use. Company revenue remains excluded when it does not have a clear connection to liquefaction or storage. Transport and regasification must be part of the market use case.
How Was the Analysis Built?
The analysis draws on 120+ sources, 35+ company portfolios, 25+ countries, and more than 20 industry interviews.
- Primary Research: Primary research includes discussions with manufacturers, service providers, technology developers, distributors, end users, procurement teams, and subject-matter experts. These conversations examine purchasing priorities, product adoption, operational challenges, approval requirements, competitive positioning, and the factors that influence wider market acceptance.
- Desk Research: Desk research covers government statistics, regulatory publications, company filings, trade data, technical studies, industry associations, standards, public policy, and other authoritative sources. Every source used in the analysis is documented in the bibliography.
- Market Sizing and Forecasting: Market estimates combine historical performance, demand indicators, pricing and volume trends, segment shares, company participation, country-level growth, adoption patterns, investment activity, and barriers to market expansion.
- Data Validation and Update Cycle: Findings are validated by comparing primary interviews with public data, company activity, regulatory changes, trade patterns, and industry developments. Regular updates review new product launches, capacity changes, partnerships, approvals, procurement trends, and shifts in commercial adoption.
Segmentation
What is the report’s scope and coverage?
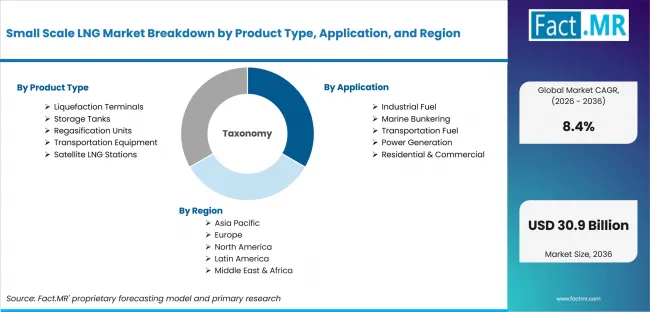
Small Scale Lng Market Breakdown By Product Type, Application, And Region | Source: Fact.MR
| Attribute | Details |
|---|---|
| Quantitative Units | USD billion in 2026 to USD billion by 2036 at CAGR |
| Market Definition | Small-scale LNG covers commercial buying and use of liquefaction terminals and related systems for plant operations, energy distribution, process control and asset reliability. |
| Product Type | Liquefaction Terminals; Micro LNG Plants; Modular LNG Plants; Storage Tanks; Cryogenic Storage Tanks; ISO LNG Containers; Regasification Units; Onshore Regasification Units; Mobile Regasification Units; Transportation Equipment; LNG Tank Trucks; LNG Bunkering Vessels; Satellite LNG Stations; Peak Shaving Stations; Remote LNG Distribution Stations |
| Application | Industrial Fuel; Power Generation; Process Heating; Marine Bunkering; Commercial Shipping; Offshore Support Vessels; Transportation Fuel; Heavy-Duty Trucks; Buses; Off-Grid Power Plants; Backup Power Systems; Residential & Commercial; City Gas Distribution; Remote Community Energy Supply |
| End User | Industrial Enterprises; Chemical Industry; Manufacturing Facilities; Energy & Utility Companies; Power Utilities; Gas Distribution Companies; Marine Operators; Commercial Shipping Companies; Port Authorities; Transportation Companies; Logistics Companies; Public Transport Operators; Commercial & Residential Users; Commercial Buildings; Remote Communities |
| Distribution Channel | Direct Supply Contracts; Long-Term Supply Agreements; Project-Based Contracts; Distributors; Regional LNG Distributors; Authorized Dealers; Retail LNG Stations; Public LNG Fueling Stations; Private LNG Fueling Stations; Bunkering Facilities; Port Bunkering Stations; Floating Bunkering Units; Online & Digital Procurement; E-Procurement Platforms; Digital Trading Platforms |
| Technology | Cryogenic Liquefaction; Mixed Refrigerant Process; Nitrogen Expansion Process; Modular LNG Technology; Containerized LNG Systems; Skid-Mounted LNG Systems; Floating LNG Technology; Floating Liquefaction Units; Floating Storage Units; LNG Regasification Technology; Ambient Air Vaporizers; Submerged Combustion Vaporizers; Digital Monitoring & Automation; Remote Asset Monitoring; Predictive Maintenance Systems |
| Regions Covered | North America; Latin America; Europe; East Asia; South Asia and Oceania; Middle East and Africa |
| Countries Covered | USA; Japan; Germany; UK; Canada; Australia; Brazil |
| Key Companies Profiled | Shell plc; Linde plc; Air Liquide; Chart Industries; Wartsila; Cryostar; Gasum; Excelerate Energy |
| Forecast Period | 2026 to 2036 |
| Approach | Hybrid top-down and bottom-up approach using LNG project demand; industrial fuel switching; liquefaction terminal capacity; direct supply contracts; technology mix; country adoption patterns and company portfolio review |
Source: Fact.MR analysis. Updated Jul 28, 2026
How is the market segmented?
-
By Product Type:
- Liquefaction Terminals
- Micro LNG Plants
- Modular LNG Plants
- Storage Tanks
- Regasification Units
-
By Application:
- Industrial Fuel
- Power Generation
- Process Heating
- Marine Bunkering
- Transportation Fuel
-
By End User:
- Industrial Enterprises
- Chemical Industry
- Manufacturing Facilities
- Energy & Utility Companies
- Marine Operators
-
By Distribution Channel:
- Direct Supply Contracts
- Long-Term Supply Agreements
- Project-Based Contracts
- Distributors
- Retail LNG Stations
-
By Technology:
- Cryogenic Liquefaction
- Mixed Refrigerant Process
- Nitrogen Expansion Process
- Modular LNG Technology
- LNG Regasification Technology
-
By Region:
- North America
- Latin America
- Europe
- East Asia
- South Asia and Oceania
- Middle East and Africa
Frequently Asked Questions
Which Product Type leads the market?
Which Application leads the market?
Which End User leads the market?
Which Distribution Channel leads the market?
Which Technology leads the market?
Which country records the highest listed CAGR?
What is the primary driver in this market?
What is the main restraint?
Why does Industrial Fuel lead demand?
Who worked on this report


Preview the report firsthand - request a free sample
Free SampleGet the brochure for pricing and purchase details
Download PDF