- Market Value (2025): USD 18.7 Bn
- Estimated Value (2026): USD 20.9 Bn
- Forecast Value (2036): USD 62.1 Bn
- CAGR (2026-2036): 11.5%
What is the Party Supply Rental Market forecast to be worth by 2036?
USD 20.9 billion in 2026 to USD 62.1 billion by 2036 at 11.5% CAGR.
- The party supply rental market reached USD 18.7 billion in 2025 as households and event planners continued to rent event assets for single-use occasions.
- Demand is projected to increase from USD 20.9 billion in 2026 to USD 62.1 billion by 2036.
- The market is forecast to record 11.5% CAGR from 2026 to 2036 as buyers ask for flexible inventory access and dependable setup support.
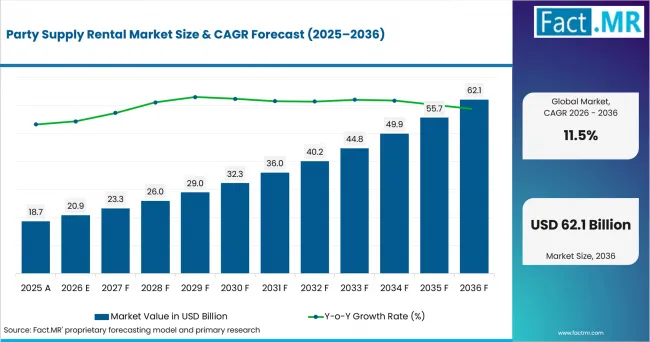
Party Supply Rental Market Value Analysis | Source: Fact.MR
What are the defining numbers behind Party Supply Rental Market growth?
USD 41.2 billion absolute opportunity by 2036.
- Demand Drivers in the Market
- Tables and chairs form the first rental decision because most event layouts need seating before decor or entertainment items are chosen.
- Wedding orders support larger baskets when families need furniture and decor from one rental partner for the same date.
- Direct rental stores help customers inspect item condition and settle delivery questions before they pay a deposit.
- Key Segments Analyzed
- By Product Type: Tables and Chairs are expected to hold 33.5% share in 2026 because they remain the base requirement before theme items are added.
- By Application: Weddings are projected to account for 28.4% share in 2026 since rental packages often begin with ceremony or reception needs.
- By End User: Individual Consumers are anticipated to capture 28.6% share in 2026 due to private hosting around planned dates.
- By Distribution Channel: Direct Rental Stores are estimated to represent 28.2% share in 2026 with local inspection and order-change support.
- By Rental Duration: One-Day Rental is forecast to hold 31.8% share in 2026 as many parties close within one event window.
- Analyst Opinion at Fact.MR
- Shambhu Nath Jha, Principal Consultant at Fact.MR, states, “Party supply rental buyers check whether a supplier can deliver clean inventory on time and solve replacement issues before the event begins.”
- Strategic Implications
- Rental operators should treat Tables and Chairs as the anchor bundle. Linens and tableware products items can then be added after the guest count is fixed.
- Suppliers can improve conversion by explaining delivery radius and damage terms before price comparison starts. This is useful for the wedding services where timing mistakes are costly.
- Investors should compare local rental density with inventory turnover. Exposure to the commercial tents becomes useful when outdoor bookings need weather backup.
Brazil is projected to record a 8.0% CAGR from 2026 to 2036. Australia is expected at 9.2%. The USA is anticipated at 15.0%. Canada records 10.4%; Germany records 12.7%; the UK records 11.5%; and Japan records 13.8%.
How does the Party Supply Rental Market break down by segment?
Tables and Chairs are expected to lead Product Type at 28.4% share in 2026. Weddings are projected to lead Application at 28.0% share in 2026.
Why do Tables and Chairs lead Product Type?
Tables and Chairs are projected to account for 33.5% share in 2026.
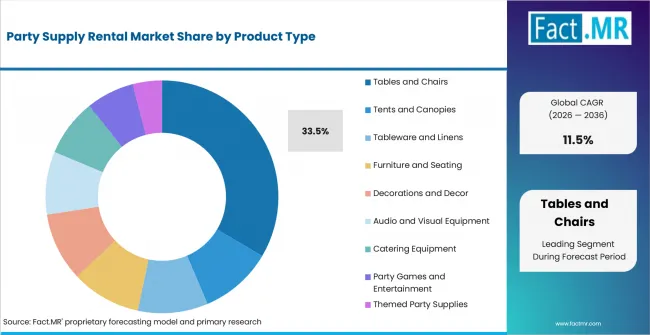
Party Supply Rental Market Analysis By Product Type | Source: Fact.MR
Seating comes first when hosts plan usable space. Banquet Tables and Chiavari and Folding Chairs support formal layouts. Tents and Canopies enter the order when weather cover is needed.
Why do Weddings lead Application?
Weddings are expected to hold 28.4% share in 2026.
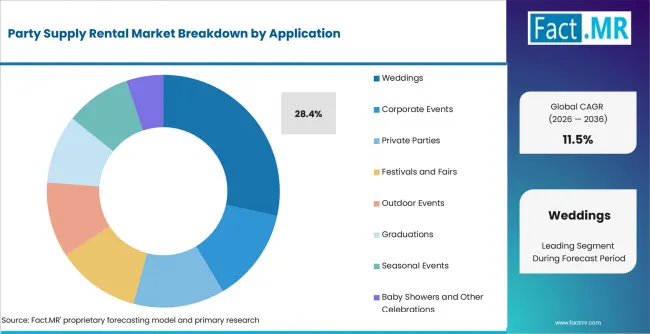
Party Supply Rental Market Analysis By Application | Source: Fact.MR
Wedding rentals need one confirmed service window. Decor and furniture must reach the venue before guests arrive. Corporate Events remain useful where branded staging is required.
What supports Individual Consumers within End User?
Individual Consumers are anticipated to represent 28.6% share in 2026.
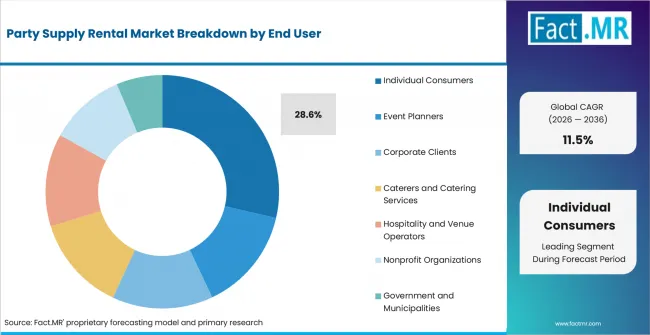
Party Supply Rental Market Analysis By End User | Source: Fact.MR
Private hosts rent supplies for one planned date and avoid storage afterward. Families use rentals for birthdays and anniversaries. Event Planners add demand through professional order handling.
How do Direct Rental Stores shape Distribution Channel?
Direct Rental Stores are estimated to lead with 28.2% share in 2026.
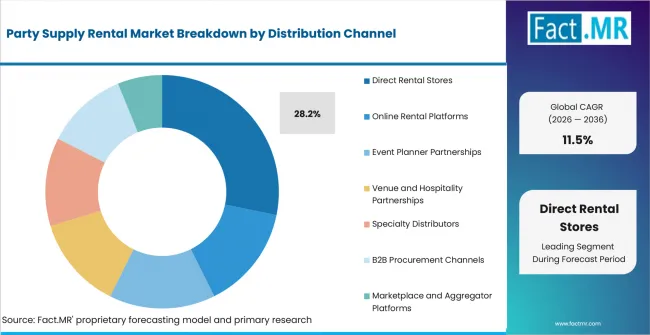
Party Supply Rental Market Analysis By Distribution Channel | Source: Fact.MR
Local stores let customers check condition and delivery rules. National Rental Branches support larger programs. Online Rental Platforms help when buyers know item count.
Why does One-Day Rental lead Rental Duration?
One-Day Rental is forecast to hold 31.8% share in 2026.
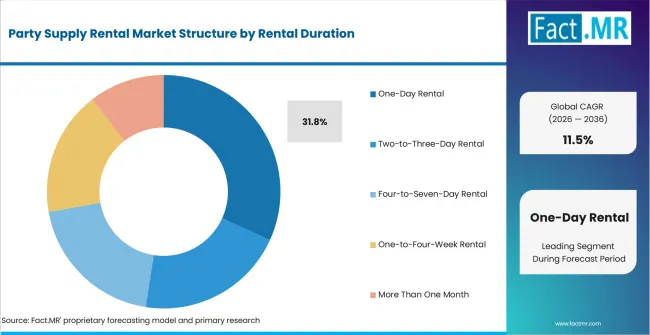
Party Supply Rental Market Analysis By Rental Duration | Source: Fact.MR
One-day terms match birthdays and short receptions. Same-Day Event Rentals solve quick needs. Two-to-Three-Day Rental supports events that need early setup.
What is accelerating Party Supply Rental Market adoption, and what is holding it back?
Demand is expected to rise through flexible access to event inventory and service-based wedding bookings. Delivery challenges and the risk of product damage may slow adoption.
Drivers Impact Analysis
| DRIVER | (~) % IMPACT ON CAGR | GEOGRAPHIC RELEVANCE | IMPACT TIMELINE |
|---|---|---|---|
| Tables and chairs rental pull | +8.0% | Brazil and USA | Short term (<= 2 years) |
| Wedding package demand | +9.2% | Australia and Canada | Short term (<= 2 years) |
| Direct-store service access | +8.0% | Brazil and Germany | Medium term (2-4 years) |
| Outdoor event equipment need | +9.2% | USA; UK; Australia | Medium term (2-4 years) |
| Planner-led bundled procurement | +1.1% | Urban event markets | Long term (>= 4 years) |
Source: Fact.MR analysis. Updated Jul 31, 2026
- Tables and chairs rental pull: Core furniture demand is expected to keep order volumes steady because most events need seating and dining surfaces.
- Wedding package demand: Reception orders are expected to raise basket size when linens and decor are booked with furniture.
- Direct-store service access: Store-led booking is likely to help customers resolve deposits and replacement questions before the event date.
Opportunity Impact Analysis
| OPPORTUNITY | (~) % IMPACT ON CAGR | GEOGRAPHIC RELEVANCE | IMPACT TIMELINE |
|---|---|---|---|
| Inventory bundles for weddings | +8.0% | Australia; Brazil; USA | Medium term (2-4 years) |
| Online booking and quotation tools | +10.4% | USA; UK; Canada | Medium term (2-4 years) |
| Venue and planner partnerships | +9.2% | Germany and Australia | Long term (>= 4 years) |
| Audio-visual add-on rentals | +0.6% | Corporate event locations | Long term (>= 4 years) |
Source: Fact.MR analysis. Updated Jul 31, 2026
- Inventory bundles for weddings: Suppliers can raise order value when furniture and decor are priced as one planned event package.
- Online booking and quotation tools: Digital quotes are expected to reduce friction when customers know guest count and rental duration.
- Venue and planner partnerships: Preferred-supplier lists can improve conversion since planners trust partners that know venue access rules.
Restraints Impact Analysis
| RESTRAINT | (~) % IMPACT ON CAGR | GEOGRAPHIC RELEVANCE | IMPACT TIMELINE |
|---|---|---|---|
| Delivery and pickup congestion | -1.2% | Urban event markets | Short term (<= 2 years) |
| Damage and cleaning cost exposure | -0.9% | Global | Short term (<= 2 years) |
| Seasonal utilization swings | -10.4% | Canada; UK; Germany | Medium term (2-4 years) |
| Price comparison across local suppliers | -9.2% | USA and Australia | Long term (>= 4 years) |
Source: Fact.MR analysis. Updated Jul 31, 2026
- Delivery and pickup congestion: Rental firms face margin pressure when tight venue windows require extra labor or repeat trips.
- Damage and cleaning cost exposure: Deposits and inspection records matter because damaged chairs and linens reduce reuse value.
- Seasonal utilization swings: Demand can cluster around wedding and holiday periods. Lower asset use during quiet months can limit returns.
Which countries are scaling Party Supply Rental Market fastest?
The country comparison is shaped by the spread between Brazil and Japan. Brazil and Australia remain above the global rate. The USA stays near the core market. Canada and Germany form a service-led middle group.
- Brazil records the highest listed CAGR because supplier access and private-event spending create a larger runway for rental penetration. Australia stays above the global rate since wedding and outdoor-event rentals keep service dependability central to supplier choice.
- The USA remains below the global rate with support from deep rental networks and event-planner relationships. Canada follows a coverage-led route where long travel distances make local inventory more valuable.
- Germany develops through venue-led purchasing where product condition and service terms influence supplier approval. The UK is expected to move through price-conscious customers that still need punctual service. Online quoting helps when delivery and collection rules are clear.
- Japan records the lowest listed CAGR as compact venues and selective celebration spending keep orders focused.
Comparable CAGRs can hide different purchase conditions. Timing depends on inventory depth and delivery discipline. Customer readiness reflects event type and the ability to manage late changes.
The full report provides country-level CAGR analysis across North America; Latin America; Europe; East Asia; South Asia; Oceania; and the Middle East and Africa.
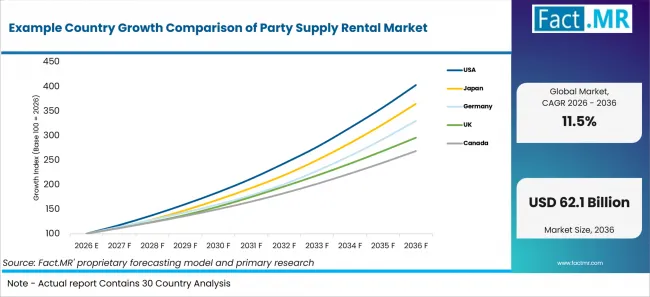
Example Country Growth Comparison Of Party Supply Rental Market | Source: Fact.MR
| Country | CAGR (2026-2036) |
|---|---|
| Brazil | 8.0% |
| Australia | 9.2% |
| USA | 15.0% |
| Canada | 10.4% |
| Germany | 12.7% |
| UK | 11.5% |
| Japan | 13.8% |
Source: Fact.MR analysis. Updated Jul 31, 2026
What supports Brazil adoption?
13.1% CAGR, supported by supplier access and private-event rental growth.
Brazil’s growth reflects household and event-organizer demand for affordable tables and seating. Local stores gain when product condition is visible and delivery timing is dependable.
How is Australia scaling demand?
11.8% CAGR, backed by wedding rentals and outdoor-event requirements.
Outdoor receptions and garden parties shape Australia’s rental route. Suppliers benefit when pickup timing and weather backup are explained before booking.
What supports USA adoption?
11.2% CAGR, supported by established rental networks and event-planner use.
The USA has a broad base of rental providers across private and corporate events. Repeat orders depend on local availability and clear inventory records.
How does Canada develop demand?
10.8% CAGR, led by service coverage and local inventory access.
Canada’s growth depends on wider delivery coverage without sharp cost increases. Regional fleets are useful when customers need tables and tents quickly.
What shapes Germany’s route to adoption?
10.2% CAGR, driven by venue-led procurement and condition checks.
Germany’s route is shaped by buyers that review product quality before confirming event packages. Clear liability terms can reduce approval friction.
How does the UK perform?
9.6% CAGR, supported by planner-led orders and private celebrations.
The UK is expected to move through price-conscious customers that still need punctual service. Online quoting helps when delivery and collection rules are clear.
What supports Japan’s growth?
8.9% CAGR, backed by compact events and selective rental use.
Japan’s growth reflects compact venues where space planning shapes rental choices. Providers that simplify booking may capture demand from small events.
Who leads the Party Supply Rental Market?
Boels Rental and Choura Experience Company show strong relevance, while United Rentals and National Construction Rentals strengthen the wider event-equipment and temporary-infrastructure landscape.
Boels Rental supports the market through broad rental capabilities and service coverage. Choura Experience Company contributes event furniture, staging and production support for commercial events. United Rentals and National Construction Rentals add scale through equipment access and temporary site solutions. Celebrations! Party Rentals and M&M Event Rentals strengthen the field through wedding and private-event inventory. Rock N Roll Rentals expands the provider group through party and entertainment equipment rentals.
Which companies are the key providers?
Key companies include Boels Rental; Choura Experience Company; United Rentals; National Construction Rentals; Celebrations! Party Rentals; M&M Event Rentals; and Rock N Roll Rentals.
- Boels Rental
- Choura Experience Company
- United Rentals
- National Construction Rentals
- Celebrations! Party Rentals
- M&M Event Rentals
- Rock N Roll Rentals
Bibliography
- Office for Product Safety and Standards. (2024, August 1). Product recall: Simpa white chair base sold via Amazon and B&Q Marketplace (2311-0082). GOV.UK.
- Office for National Statistics. (2025, November 18). Marriages and civil partnerships in England and Wales: 2023.
- Office for Product Safety and Standards. (2026, February 3). Product safety report: Baby camping chair (2601-0393a). GOV.UK.
- CORT Events. (2024, June 25). CORT Events expands trade show and event division with new warehouse in Round Rock, Texas.
This Report Answers
- The report provides strategic intelligence on the Party Supply Rental Market across Product Type and Application choices that shape event rental programs.
- Segment analysis covers Tables and Chairs and Weddings as the share leaders within the 2026 market.
- Country outlook evaluates Brazil and Australia alongside the USA. Canada; Germany; the UK; and Japan complete the growth comparison.
- Competitive analysis profiles Boels Rental and Choura Experience Company alongside United Rentals and National Construction Rentals. Celebrations! Party Rentals; M&M Event Rentals; and Rock N Roll Rentals complete the provider set.
- Channel assessment covers Direct Rental Stores and the online booking platforms. Venue partnerships complete the distribution view alongside specialty distributors and marketplaces.
What does the Party Supply Rental Market cover?
The market covers rented furniture and support assets for planned events.
The Party Supply Rental Market covers equipment used for weddings and private parties. Coverage extends to chairs and tables through tents and audiovisual support.
The market differs from retail party supplies because revenue is tied to temporary access and service timing. Product sales and venue fees are excluded when rented supply assets are not involved.
What is included in the scope?
Party supply rentals are used across individual consumers and professional event buyers.
The scope includes Product Type and Application alongside End User; Distribution Channel; and Rental Duration. Coverage spans furniture and tents through decor; audio-visual equipment; and rented serving assets for the catering services.
What is excluded from the scope?
Venue ownership and permanent furniture purchases remain outside the scope of this market.
The scope excludes assets purchased for permanent use. Catering food sales and entertainment services are excluded unless the transaction depends on rented party supplies.
How Was the Analysis Built?
The analysis draws on more than 120 sources and 35 company portfolios. It also considers 25 countries and more than 20 industry interviews.
- Primary Research: Primary research includes discussions with manufacturers and service providers. It also reviews feedback from developers and distributors. These interviews examine purchasing priorities and approval requirements that influence wider market acceptance.
- Desk Research: Desk research covers government statistics and regulatory publications. It also reviews company filings and industry associations. Every source used in the analysis is documented in the bibliography.
- Market Sizing and Forecasting: Market estimates combine historical performance with demand indicators. The model also reviews pricing trends and segment shares. Country-level growth and barriers are tested before the forecast is finalized.
- Data Validation and Update Cycle: Findings are validated by comparing primary interviews with public data. Regular updates review company activity and shifts in commercial adoption.
Segmentation
What is the report’s scope and coverage?
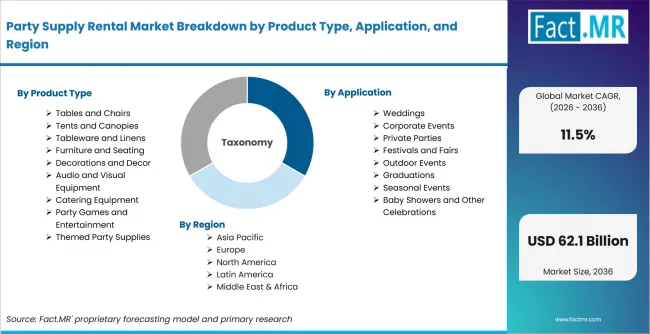
Party Supply Rental Market Breakdown By Product Type, Application, And Region | Source: Fact.MR
| Attribute | Details |
|---|---|
| Quantitative Units | USD billion in 2026 to USD billion by 2036 at CAGR |
| Market Definition | Rental of event furniture; tents; tableware; decor; audio-visual items; catering equipment; and related supplies for private and commercial celebrations |
| Product Type | Tables and Chairs; Tents and Canopies; Tableware and Linens; Furniture and Seating; Decorations and Decor; Audio and Visual Equipment; Catering Equipment; Themed Party Supplies |
| Application | Weddings; Corporate Events; Private Parties; Festivals and Fairs; Outdoor Events; Graduations; Seasonal Events |
| End User | Individual Consumers; Event Planners; Corporate Clients; Caterers and Catering Services; Hospitality and Venue Operators; Nonprofit Organizations |
| Distribution Channel | Direct Rental Stores; Online Rental Platforms; Event Planner Partnerships; Venue Partnerships; Specialty Distributors; B2B Procurement Channels |
| Rental Duration | One-Day Rental; Same-Day Event Rentals; Two-to-Three-Day Rental; Four-to-Seven-Day Rental; One-to-Four-Week Rental; More Than One Month |
| Regions Covered | North America; Latin America; Europe; East Asia; South Asia and Oceania; Middle East and Africa |
| Countries Covered | Brazil; Australia; USA; Canada; Germany; UK; Japan |
| Key Companies Profiled | Boels Rental; Choura Experience Company; United Rentals; National Construction Rentals; Celebrations! Party Rentals; M&M Event Rentals; Rock N Roll Rentals |
| Forecast Period | 2026 to 2036 |
| Approach | Hybrid top-down and bottom-up approach using event rental demand; segment shares; country growth; supplier participation; booking channels; inventory use; service coverage; and company portfolio review |
Source: Fact.MR analysis. Updated Jul 31, 2026
How is the market segmented?
-
By Product Type
- Tables and Chairs
- Tents and Canopies
- Tableware and Linens
- Furniture and Seating
- Audio and Visual Equipment
- Catering Equipment
- Themed Party Supplies
-
By Application
- Weddings
- Corporate Events
- Private Parties
- Festivals and Fairs
- Outdoor Events
- Graduations
- Seasonal Events
-
By End User
- Individual Consumers
- Event Planners
- Corporate Clients
- Caterers and Catering Services
- Hospitality and Venue Operators
- Nonprofit Organizations
- Government and Municipalities
-
By Distribution Channel
- Direct Rental Stores
- Online Rental Platforms
- Event Planner Partnerships
- Venue and Hospitality Partnerships
- Specialty Distributors
- B2B Procurement Channels
- Marketplace and Aggregator Platforms
-
By Rental Duration
- One-Day Rental
- Same-Day Event Rentals
- Two-to-Three-Day Rental
- Four-to-Seven-Day Rental
- One-to-Four-Week Rental
- More Than One Month
-
By Region
- North America
- Latin America
- Europe
- East Asia
- South Asia and Oceania
- Middle East and Africa
Frequently Asked Questions
Which Product Type leads the market?
Which Application leads the market?
Which End User leads the market?
Which Distribution Channel leads the market?
Which Rental Duration leads the market?
Which country records the highest listed CAGR?
What is the primary driver in this market?
What is the main restraint?
Why do Individual Consumers lead demand?
Who worked on this report


Preview the report firsthand - request a free sample
Free SampleGet the brochure for pricing and purchase details
Download PDF