- Market Value (2025): USD 50.3 Bn
- Estimated Value (2026): USD 52.7 Bn
- Forecast Value (2036): USD 84.2 Bn
- CAGR (2026-2036): 4.8%
What is the Plastic Caps Market forecast to be worth by 2036?
USD 52.7 billion in 2026 and USD 84.2 billion by 2036, implying a 4.8% CAGR.
- The Plastic Caps Market was valued at USD 50.3 billion in 2025.
- Demand is projected to increase from USD 52.7 billion in 2026 to USD 84.2 billion by 2036.
- The market is forecast to record 4.8% CAGR from 2026 to 2036 owing to screw-cap standardization, beverage packaging demand and direct supply programs.
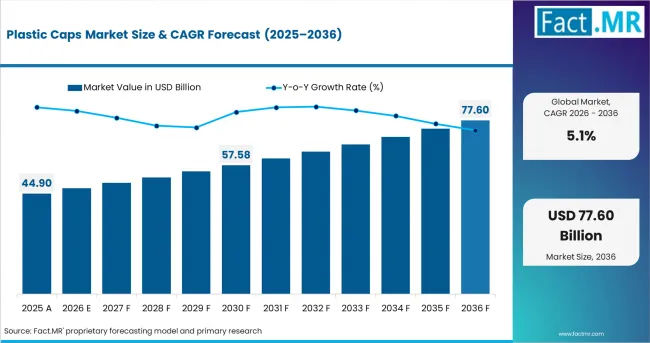
Plastic Caps Market Value Analysis | Source: Fact.MR
What are the defining numbers behind Plastic Caps Market growth?
Absolute opportunity is USD 31.5 billion by 2036.
- Demand Drivers in the Market
- Beverage manufacturers need capping systems that reduce line stoppage because each bottle must leave the line with a secure seal.
- Food processors require tamper-evident caps so sauces, condiments and edible oils remain protected after first opening.
- Personal care brands specify dispensing caps owing to controlled dosing needs in hair care and skin care formats.
- The European Commission states that Regulation (EU) 2025/40 on packaging and packaging waste entered into force on 11 February 2025 and generally applies from 12 August 2026. It covers all packaging and packaging waste and establishes requirements across the packaging life cycle.
- Key Segments Analyzed
- By Product: Screw Caps are expected to hold 68.70% share in 2026 because they fit high-volume beverage and food packaging lines.
- By Application: Beverage Packaging is projected to account for 43.50% share in 2026 owing to soft drink and packaged-water closure needs.
- By End Use: Beverage Manufacturers are anticipated to capture 74.10% share in 2026 since filling plants buy caps through repeat programs.
- By Technology: Injection Molding Technology is estimated to represent 57.80% share in 2026 due to fast-cycle production and thread accuracy.
- By Formulation: Polypropylene Based Caps are forecast to hold 36.40% share in 2026 as PP balances hinge performance, weight and cost.
- By Distribution Channel: Direct Sales are expected to account for 62.90% share in 2026 because large accounts prefer qualified supply contracts.
- Analyst Opinion at Fact.MR
- Shambhu Nath Jha, Principal Consultant at Fact.MR, states, “Plastic cap purchasing is increasingly decided by fit, weight and proof of recyclability. Closure suppliers are expected to win repeat work when they prove line compatibility early. The stronger case combines mold accuracy, tamper evidence, resin control and technical support.”
- Strategic Implications
- Brand owners should connect cap design with packaging tax exposure and shelf-opening experience before changing bottle neck finishes.
- UK closure suppliers should document recycled-content evidence carefully. HMRC reported in August 2025 that 38% of total plastic-packaging tonnage manufactured in and imported into the UK in 2024 to 2025 was declared taxable under PPT; its breakdown of the remaining 62% assigns 51 percentage points to packaging meeting the 30% or more recycled-plastic threshold.
- Distributors should keep common screw-cap and flip-top sizes available for replacement orders across beverage and personal care accounts.
- Investors should separate direct plastic cap exposure from wider rigid packaging activity before comparing supplier portfolios.
Germany leads at 5.2% CAGR through reusable beverage systems and EU packaging compliance. The USA follows at 4.2% as beverage filling scale and catalog closure availability support demand. The UK reaches 3.9% through plastic-packaging tax records and recycling obligations. France records 3.4% through recyclability pressure and beverage packaging needs, while Italy posts 2.9% through bottled-water use and food packaging applications.
How does the Plastic Caps Market break down by segment?
Screw Caps lead Product at 68.70%; Beverage Manufacturers lead End Use at 74.10%.
Which Product dominates?
Screw Caps are projected to account for 68.7% share in 2026.
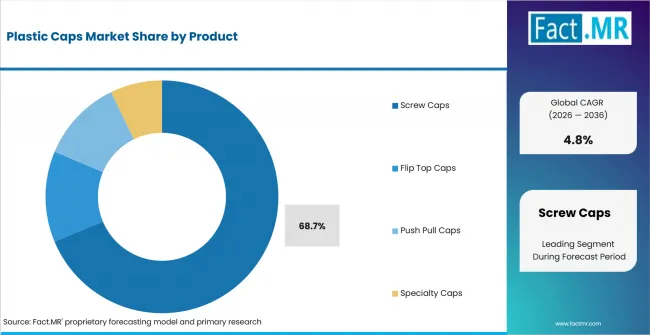
Plastic Caps Market Analysis By Product | Source: Fact.MR
Screw Caps are projected to account for 68.7% share in 2026 because they suit continuous-thread and tamper-evident programs. Flip Top Caps support dispensing in personal care and condiments. Push Pull Caps serve sports bottles. Specialty Caps cover disc-top and spout designs.
What leads the Application segment?
Beverage Packaging is expected to hold 43.5% share in 2026.
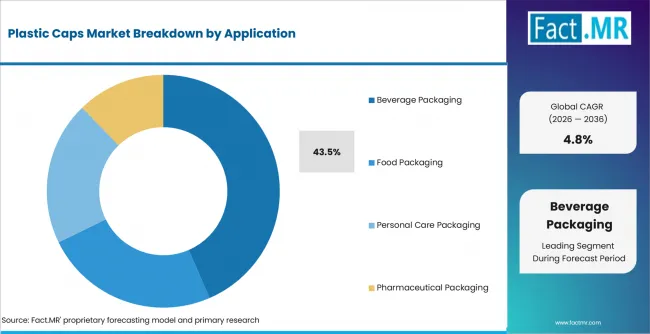
Plastic Caps Market Analysis By Application | Source: Fact.MR
Beverage Packaging is expected to hold 43.5% share in 2026 owing to packaged water and carbonated beverages. Eurostat reported in October 2025 that each person in the EU generated 35.3 kg of plastic packaging waste in 2023.
How does End Use shape demand?
Beverage Manufacturers are anticipated to lead with 74.1% share in 2026.
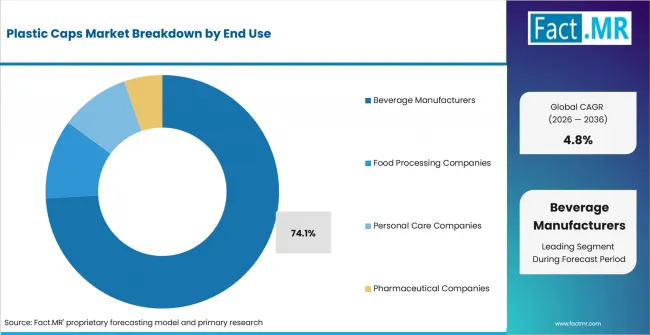
Plastic Caps Market Analysis By End Use | Source: Fact.MR
Beverage Manufacturers are anticipated to lead with 74.1% share in 2026 since bottle lines require large volumes of qualified closures. Food processors use caps where leak control affects release. Pharmaceutical accounts need stronger validation for child resistance and sealing integrity.
What supports Injection Molding Technology?
Injection Molding Technology is estimated to represent 57.8% share in 2026.
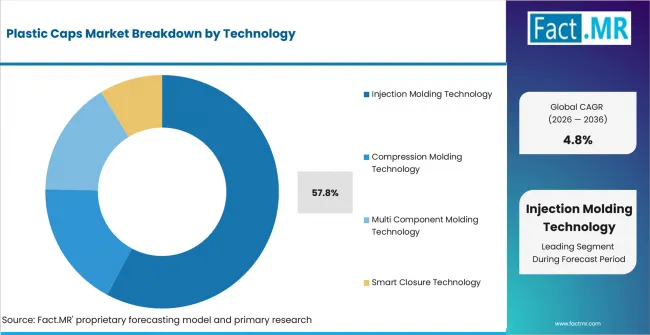
Plastic Caps Market Analysis By Technology | Source: Fact.MR
Injection Molding Technology is estimated to represent 57.8% share in 2026 due to fast cycle times and accurate thread formation. Compression Molding Technology remains relevant for lightweight caps. Multi Component Molding Technology supports closures with seals or connected features.
What supports Polypropylene Based Caps?
Polypropylene Based Caps are forecast to hold 36.4% share in 2026.
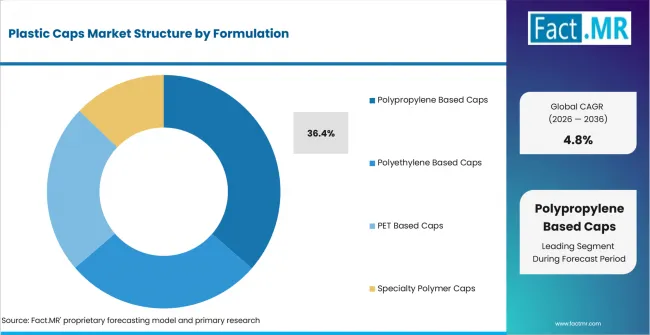
Plastic Caps Market Analysis By Formulation | Source: Fact.MR
Polypropylene Based Caps are forecast to hold 36.4% share in 2026 as PP supports hinge behavior and chemical resistance. Polyethylene Based Caps remain common where flexibility is valued. The Joint Research Centre reported in July 2026 that 5.9 million tonnes of plastic packaging were placed on the market in 2025 across the 19 EU countries considered in its study.
How does Distribution Channel affect supply?
Direct Sales are expected to account for 62.9% share in 2026.
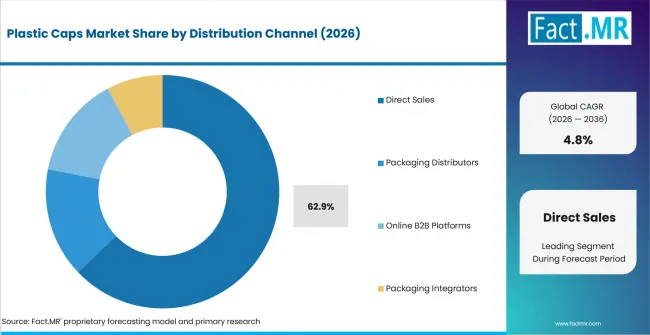
Plastic Caps Market Analysis By Distribution Channel | Source: Fact.MR
Direct Sales are expected to account for 62.9% share in 2026 because large accounts prefer qualified suppliers. Packaging Distributors remain useful for smaller orders. Online B2B Platforms support catalog discovery where standard caps are enough.
What is accelerating Plastic Caps Market adoption, and what is holding it back?
Beverage closure standardization drives it; resin and compliance costs restrain it.
Drivers Impact Analysis
| DRIVER | (~) % IMPACT ON CAGR | GEOGRAPHIC RELEVANCE | IMPACT TIMELINE |
|---|---|---|---|
| Beverage closure standardization | +1.4% | Germany, USA, UK | Short term (<= 2 years) |
| Tamper-evident reseal demand | +1.1% | Beverage and food applications | Short term (<= 2 years) |
| Filling-line compatibility | +0.9% | Beverage manufacturing centers | Medium term (2-4 years) |
| Polypropylene molding efficiency | +0.8% | Global | Medium term (2-4 years) |
| Direct supply agreements | +0.6% | Germany, USA, UK | Long term (>= 4 years) |
- Beverage closure standardization: Screw caps are expected to gain where fillers use common neck finishes. Standard formats reduce approval time when brands expand bottle sizes.
- Tamper-evident reseal demand: Tamper evidence is anticipated to raise cap value in beverage and food packaging. It supports packaged water and condiment formats where first-opening proof affects trust.
- Filling-line compatibility: Beverage plants are projected to favor caps that run cleanly on existing applicators. In the U.S. Census Bureau’s 2025 first-quarter Quarterly Survey of Plant Capacity Utilization table, beverage manufacturing (NAICS 3121) recorded 48.4 average plant hours per week in operation.
- Polypropylene molding efficiency: Polypropylene caps are expected to benefit where hinges and threads must be molded at high speed. Repeatable resin behavior helps protect cap weight and sealing force.
- Direct supply agreements: Direct procurement is forecast to expand where beverage groups want firm delivery schedules and qualification records. Large accounts prefer fewer substitutions when launch timing is fixed.
Opportunity Impact Analysis
| OPPORTUNITY | (~) % IMPACT ON CAGR | GEOGRAPHIC RELEVANCE | IMPACT TIMELINE |
|---|---|---|---|
| Tethered cap conversion | +0.8% | Europe | Medium term (2-4 years) |
| Lightweight cap designs | +0.7% | Global beverage accounts | Medium term (2-4 years) |
| Mono-material PP programs | +0.6% | Europe and North America | Long term (>= 4 years) |
| Stock closure platforms | +0.4% | USA and UK | Long term (>= 4 years) |
- Tethered cap conversion: Tethered caps are expected to create redesign work for beverage and carton closures in Europe. Hinge feel and bottle compatibility shape qualification.
- Lightweight cap designs: Lightweighting is anticipated to create value when cap weight falls without hurting opening torque. Brands still need stable handling on filling lines.
- Mono-material PP programs: Mono-material programs are projected to support cap redesign where recyclability claims require clearer polymer choices. The European Commission said PPWR generally applies from 12 August 2026.
- Stock closure platforms: Stock closures are forecast to help smaller fillers avoid custom tooling. Catalog formats support faster purchasing where standard neck finishes meet brand needs.
Restraints Impact Analysis
| RESTRAINT | (~) % IMPACT ON CAGR | GEOGRAPHIC RELEVANCE | IMPACT TIMELINE |
|---|---|---|---|
| Resin price exposure | -0.8% | Global | Short term (<= 2 years) |
| Recycled-content proof | -0.7% | UK and EU | Short term (<= 2 years) |
| Filling-line retrofit risk | -0.6% | Beverage plants | Medium term (2-4 years) |
| Food-contact approval time | -0.5% | Food and pharma packaging | Long term (>= 4 years) |
- Resin price exposure: Resin cost is expected to limit price flexibility for cap molders. Smaller converters face more pressure when customers resist price changes.
- Recycled-content proof: Recycled-content claims are anticipated to raise documentation work for UK packaging suppliers. HMRC reported in August 2025 that PPT revenue for 2024 to 2025 reached GBP 259 million.
- Filling-line retrofit risk: New cap formats are expected to face delays when closures require different capping heads. Suppliers must prove cap application before wide conversion.
- Food-contact approval time: Food and pharmaceutical uses are forecast to move more slowly when resin changes require additional checks. Safety formats require more documentation than standard beverage caps.
Which countries are scaling Plastic Caps Market fastest?
- The country comparison spans 2.3 percentage points and forms three practical growth bands across the forecast period.
- Germany remains 1.0 percentage point above the USA through reusable beverage systems and EU packaging compliance.
- The USA remains 0.3 percentage point above the UK through beverage filling scale and catalog closure availability.
- The UK remains 0.5 percentage point above France as plastic-packaging tax records and recycling obligations shape closure demand.
- France remains 0.5 percentage point above Italy through recyclability pressure and beverage packaging needs.
- Italy closes the displayed range through bottled-water use and food packaging applications.
Comparable CAGRs can create different entry conditions due to beverage filling scale, packaging regulation, recycling obligations and closure-supply depth. Full report coverage includes North America, Latin America, Europe, East Asia, South Asia and Pacific, Middle East and Africa.
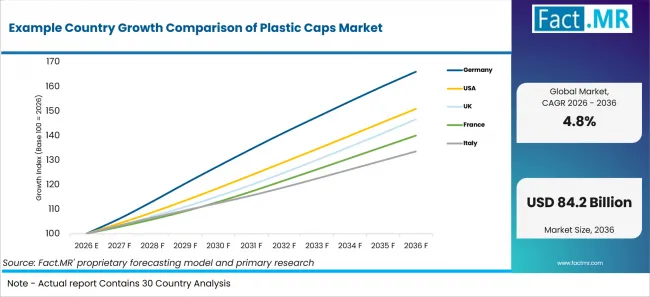
Example Country Growth Comparison Of Plastic Caps Market | Source: Fact.MR
| Country | CAGR (2026-2036) |
|---|---|
| Germany | 5.2% |
| USA | 4.2% |
| UK | 3.9% |
| France | 3.4% |
| Italy | 2.9% |
What supports Germany adoption?
5.2% CAGR, supported by reusable beverage systems and EU packaging compliance.
Germany’s 5.2% CAGR is supported by reusable beverage systems and EU packaging compliance. Umweltbundesamt reported on July 8, 2026 that 34.5% of beverages consumed in Germany were filled in reusable packaging in 2024. This established reuse base supports continued demand for plastic caps that meet beverage-line compatibility, closure performance and evolving packaging requirements.
How is the USA developing demand?
4.2% CAGR, backed by beverage filling scale and catalog closure availability.
The USA’s 4.2% CAGR is backed by beverage filling scale and broad catalog closure availability. In the U.S. Census Bureau’s 2025 first-quarter Quarterly Survey of Plant Capacity Utilization, beverage manufacturing (NAICS 3121) recorded a full-utilization rate of 70.2%. This production base supports continued demand for standardized plastic caps across high-volume beverage packaging operations.
What supports the UK outlook?
3.9% CAGR, shaped by plastic-packaging tax records and recycling obligations.
The UK’s 3.9% CAGR is shaped by plastic-packaging tax records and recycling obligations. DEFRA’s July 2025 release reported a 2024 UK plastic-packaging recycling rate of 51.0% under Methodology 1 and a provisional 53.7% under Methodology 2. These recycling requirements encourage closure suppliers to improve material documentation and align cap designs with packaging compliance needs.
How does France perform?
3.4% CAGR, led by recyclability pressure and beverage packaging needs.
France’s 3.4% CAGR is led by recyclability pressure and beverage packaging needs. Eurostat reported in October 2025 that France recycled 25.7% of plastic packaging waste in 2023, one of the three lowest rates highlighted in its EU comparison. This recycling gap strengthens pressure on packaging suppliers to improve cap design, material selection and recyclability performance.
What supports Italy adoption?
2.9% CAGR, supported by bottled water use and food packaging applications.
Italy’s 2.9% CAGR is supported by bottled water use and food packaging applications. The Joint Research Centre reported in July 2026 that, in its modelling results for Italy, plastic bottled water accounted for 46% of total plastic consumption. This strong bottled-water exposure supports ongoing demand for plastic caps used across beverage packaging and related food applications.
Who leads the Plastic Caps Market?
Competitive set includes Amcor plc, BERICAP, Silgan Holdings Inc. (Silgan Closures) and UNITED CAPS.
BERICAP supports beverage and liquid-food applications with tethered and sport-cap designs. Silgan Holdings Inc. (Silgan Closures) adds plastic closures for beverage, food and healthcare packaging. UNITED CAPS, Pano Cap Canada Ltd., MRP Solutions, Plastic Closures Limited, and Phoenix Closures Inc. round out the active provider set. Competition is expected to depend on mold capacity, stock closure breadth and support during filling-line approval.
Which companies are the key providers?
Key companies include Amcor plc; BERICAP; Silgan Holdings Inc. (Silgan Closures); UNITED CAPS; Pano Cap Canada Ltd.; MRP Solutions; Plastic Closures Limited; and Phoenix Closures Inc.
- Amcor plc
- BERICAP
- Silgan Holdings Inc. (Silgan Closures)
- UNITED CAPS
- Pano Cap Canada Ltd.
- MRP Solutions
- Plastic Closures Limited
- Phoenix Closures Inc.
Bibliography
- Amcor plc. (2025, April 30). Amcor completes combination with Berry Global; positioned to significantly enhance value for customers and shareholders.
- BERICAP. (2025, July 28). Benefits for the environment and consumers: BERICAP presents closure solutions at Drinktec 2025.
- Department for Environment, Food & Rural Affairs. (2025, July 23). UK statistics on waste. GOV.UK.
- Eurostat. (2025, October 22). Plastic packaging waste in the EU: 35.3 kg per person.
- U.S. Census Bureau. (2026, March 24). 2025 Quarterly Survey of Plant Capacity Utilization.
This Report Answers
- The report provides strategic intelligence on the Plastic Caps Market across Product and Application choices that shape package closure programs.
- Segment analysis covers Screw Caps and Beverage Packaging as the share leaders within the 2026 market.
- Country outlook evaluates Germany and the USA alongside the UK, France and Italy.
- Competitive analysis profiles Amcor plc and BERICAP alongside Silgan Holdings Inc. (Silgan Closures) and UNITED CAPS. Pano Cap Canada Ltd., MRP Solutions, Plastic Closures Limited, Phoenix Closures Inc. complete the set.
- Technology assessment covers Injection Molding Technology and Compression Molding Technology alongside Multi Component Molding Technology and Smart Closure Technology.
- Formulation assessment covers Polypropylene Based Caps, Polyethylene Based Caps, PET Based Caps and Specialty Polymer Caps.
- The analysis combines official packaging statistics, company portfolio checks, regulatory review and application-level cap demand mapping.
What does the Plastic Caps Market cover?
Screw Caps, Flip Top Caps, Push Pull Caps and Specialty Caps used for package closure and dispensing.
The Plastic Caps Market covers closures used to seal bottles, jars and selected rigid packaging formats. Coverage includes tamper-evident screw caps, dispensing closures and sport caps.
The market differs from broader rigid packaging because it measures closure components. Bottles, jars, tubes, liners and pumps are excluded unless sold as part of a closure package.
What is included in the scope?
Plastic cap systems used in beverage, food, personal care and pharmaceutical packaging.
The scope includes screw caps, flip-top caps, push-pull caps and specialty caps used across beverage packaging, food packaging, personal care packaging and pharmaceutical packaging. It includes injection molded, compression molded, multi-component and connected closure formats. The analysis considers plastic caps and closures alongside adjacent rigid plastic packaging and plastic bottles and containers where closure fit affects package selection.
What is excluded from the scope?
Full containers, pumps, labels and unrelated packaging components are outside the scope.
The scope excludes plastic bottles, jars, tubes and labels unless a plastic cap component is included. Pumps and sprayers are excluded when sold separately. Serialized closure components are considered only when the cap performs the traceability function.
How Was the Analysis Built?
The analysis draws on 120+ sources, 35+ company portfolios, 25+ countries, and more than 20 industry interviews.
- Primary Research: Primary research includes discussions with manufacturers, service providers, technology developers, distributors, end users, procurement teams, and subject-matter experts. These conversations examine purchasing priorities, product adoption, operational challenges, approval requirements, competitive positioning, and the factors that influence wider market acceptance.
- Desk Research: Desk research covers government statistics, regulatory publications, company filings, trade data, technical studies, industry associations, standards, public policy, and other authoritative sources. Every source used in the analysis is documented in the bibliography.
- Market Sizing and Forecasting: Market estimates combine historical performance, demand indicators, pricing and volume trends, segment shares, company participation, country-level growth, adoption patterns, investment activity, and barriers to market expansion.
- Data Validation and Update Cycle: Findings are validated by comparing primary interviews with public data, company activity, regulatory changes, trade patterns, and industry developments. Regular updates review new product launches, capacity changes, partnerships, approvals, procurement trends, and shifts in commercial adoption.
What is the report’s scope and coverage?
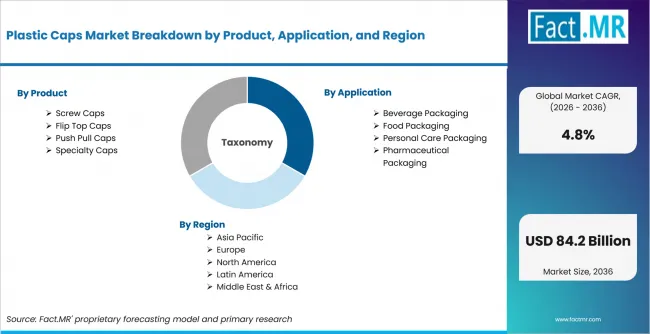
Plastic Caps Market Breakdown By Product, Application, And Region | Source: Fact.MR
| Attribute | Details |
|---|---|
| Quantitative Units | USD billion |
| Market Definition | Plastic caps used to seal, reseal, dispense, protect and authenticate packaged products across beverage, food, personal care and pharmaceutical supply chains |
| Product | Screw Caps; Continuous Thread Caps; Tamper Evident Screw Caps; Flip Top Caps; Push Pull Caps; Specialty Caps |
| Application | Beverage Packaging; Food Packaging; Personal Care Packaging; Pharmaceutical Packaging |
| End Use | Beverage Manufacturers; Food Processing Companies; Personal Care Companies; Pharmaceutical Companies |
| Technology | Injection Molding Technology; Compression Molding Technology; Multi Component Molding Technology; Smart Closure Technology |
| Formulation | Polypropylene Based Caps; Polyethylene Based Caps; PET Based Caps; Specialty Polymer Caps |
| Distribution Channel | Direct Sales; Packaging Distributors; Online B2B Platforms; Packaging Integrators |
| Regions Covered | North America; Latin America; Europe; East Asia; South Asia and Pacific; Middle East and Africa |
| Countries Covered | Germany; USA; UK; France; Italy |
| Key Companies Profiled | Amcor plc; BERICAP; Silgan Holdings Inc. (Silgan Closures); UNITED CAPS; Pano Cap Canada Ltd.; MRP Solutions; Plastic Closures Limited; Phoenix Closures Inc. |
| Forecast Period | 2026 to 2036 |
| Approach | Hybrid top-down and bottom-up approach using beverage packaging demand; food and personal care closure use; cap product mix; molding technology; polymer formulation; distribution channel activity; country adoption patterns and company portfolio review |
How is the market segmented?
-
By Product:
- Screw Caps
- Continuous Thread Caps
- Tamper Evident Screw Caps
- Flip Top Caps
- Standard Flip Top Caps
- Dispensing Flip Top Caps
- Push Pull Caps
- Sports Bottle Caps
- Beverage Dispensing Caps
- Specialty Caps
- Disc Top Caps
- Spout Caps
- Screw Caps
-
By Application:
- Beverage Packaging
- Carbonated Beverage Packaging
- Non Carbonated Beverage Packaging
- Food Packaging
- Sauce and Condiment Packaging
- Edible Oil Packaging
- Personal Care Packaging
- Hair Care Packaging
- Skin Care Packaging
- Pharmaceutical Packaging
- OTC Drug Packaging
- Prescription Drug Packaging
- Beverage Packaging
-
By End Use:
- Beverage Manufacturers
- Soft Drink Producers
- Packaged Water Companies
- Food Processing Companies
- Condiment Manufacturers
- Edible Oil Producers
- Personal Care Companies
- Hair Care Manufacturers
- Skin Care Manufacturers
- Pharmaceutical Companies
- Drug Manufacturers
- Healthcare Packaging Firms
- Beverage Manufacturers
-
By Technology:
- Injection Molding Technology
- Hot Runner Molding Systems
- Cold Runner Molding Systems
- Compression Molding Technology
- Direct Compression Systems
- Lined Compression Systems
- Multi Component Molding Technology
- Two Shot Molding Systems
- Overmolding Systems
- Smart Closure Technology
- Track and Trace Closures
- Connected Packaging Closures
- Injection Molding Technology
-
By Formulation:
- Polypropylene Based Caps
- Homopolymer Polypropylene Caps
- Copolymer Polypropylene Caps
- Polyethylene Based Caps
- HDPE Based Caps
- LDPE Based Caps
- PET Based Caps
- Virgin PET Caps
- Recycled PET Caps
- Specialty Polymer Caps
- Bio Based Polymer Caps
- Engineering Polymer Caps
- Polypropylene Based Caps
-
By Distribution Channel:
- Direct Sales
- OEM Supply Agreements
- Strategic Supply Partnerships
- Packaging Distributors
- Regional Packaging Distributors
- Specialty Packaging Suppliers
- Online B2B Platforms
- Industrial E Commerce Platforms
- Manufacturer Direct Platforms
- Packaging Integrators
- Contract Packaging Providers
- Packaging Solution Providers
- Direct Sales
-
By Region:
- North America
- Latin America
- Europe
- East Asia
- South Asia and Oceania
- Middle East and Africa

