- Market Value (2025): USD 995.2 Mn
- Estimated Value (2026): USD 1045.0 Mn
- Forecast Value (2036): USD 1702.2 Mn
- CAGR (2026-2036): 5.0%
What is the Sandstone Market forecast to be worth by 2036?
USD 1,045.0 million in 2026 to USD 1,702.2 million by 2036, at a 5.0% CAGR.
- The sandstone market crossed a valuation of USD 995.2 million in 2025 through continued natural-stone procurement across interior and exterior construction applications.
- Demand is projected to begin at USD 1,045.0 million in 2026 through continued procurement across major sandstone applications. The market is forecast to reach USD 1,702.2 million by 2036 through project specifications and replacement demand.
- The market is forecast to record a 5.0% CAGR from 2026 to 2036 through contractor and developer specifications for durable sandstone project surfaces.
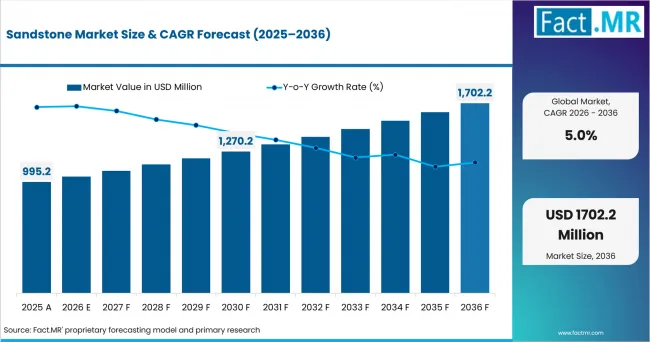
Sandstone Market Market Value Analysis | Source: Fact.MR
What are the defining numbers behind Sandstone Market growth?
USD 657.2 million absolute opportunity by 2036, led by Grey Sandstone and Flooring & Paving together with Residential Construction demand.
- Demand Drivers in the Market
- Architectural specifiers need documented quarry origin and finish consistency throughout phased projects containing visible sandstone surface packages.
- Landscape contractors need calibrated paving units supported by reliable thickness control so installation crews reduce site sorting and maintain level outdoor surfaces.
- Public works engineers need verified slip resistance and weathering performance owing to sandstone use in plazas and civic restoration work. These teams also specify sandstone for walkways or steps to preserve replacement continuity throughout long-term maintenance programs.
- Stone distributors need mixed formats from dependable quarry programs shaped by project schedules that combine paving with walling packages. They also need matching copings and cut pieces that arrive within the same coordinated project delivery sequence.
- Key Segments Analyzed
- By Type: Grey Sandstone is expected to account for 34.0% share in 2026 owing to its neutral appearance across varied paving and cladding specifications.
- By Application: Flooring & Paving is projected to account for 37.0% share in 2026 owing to recurring patio and walkway orders for calibrated stone units.
- By End Use: Residential Construction is anticipated to capture 46.0% share in 2026 due to external surfaces and landscape features creating repeated finished-stone demand.
- By Finish: Natural/Split is estimated to represent 44.0% share in 2026 owing to textured surface demand across outdoor paving and landscape applications.
- Analyst Opinion at Fact.MR
- Shambhu Nath Jha, Senior Analyst at Fact.MR states: “Sandstone purchasing increasingly starts with proof of quarry origin and batch consistency before price comparison begins. Demand is expected to favor suppliers that connect material selection with calibrated processing and installation guidance throughout project delivery. Project teams should combine sample control with technical records and phased delivery planning so replacement batches remain available during extended construction programs.”
- Strategic Implications
- Quarry operators should map production benches to saleable color ranges and retain batch records for repeat orders tied to long project schedules.
- Fabricators should publish tolerance data for paving and cladding formats before contractors commit labor plans or bedding-system quantities for installation work.
- Distributors should separate landscaping stock programs from specification-led façade packages due to material differences in approval cycles and replacement risks across those commercial routes.
- Contractors should approve installation mock-ups before bulk ordering to test joint width and bedding depth. Project teams should also check anchoring details and wet-weather appearance before acceptance so the approved mock-up reflects actual service conditions.
- Marshalls published an Environmental Product Declaration (EPD) for selected Indian sandstone products in February 2025 to support documented project specification and sustainability reporting requirements. The declaration provides standardized environmental performance data that can be used by architects, designers, and construction teams during material selection and procurement processes.
India is expected to record a 6.8% CAGR between 2026 and 2036 through construction activity and Rajasthan processing capacity. China is projected to post a 6.1% CAGR during the forecast period through urban renewal and public-space work. Australia is anticipated to advance at a 4.8% CAGR over the assessment period through residential and civil construction activity. United Kingdom demand is estimated to record a 4.5% CAGR to 2036 through repair work and hard-landscape replacement. The United States is forecast to post a 4.3% CAGR across the assessment period through residential spending and dimension-stone supply. Germany is projected to record a 4.0% CAGR through renovation demand and specification-led building activity. Japan is estimated to expand at a 3.7% CAGR through building replacement and established construction investment.
How does the Sandstone Market break down by segment?
Grey Sandstone accounts for 34.0% share in 2026, Flooring & Paving represents 37.0% share
Which Type category leads the market?
Grey Sandstone is estimated to represent 34.0% share in 2026
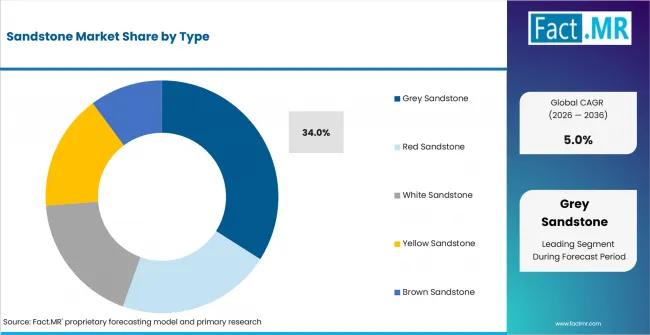
Sandstone Market Analysis By Type | Source: Fact.MR
Grey Sandstone is expected to account for 34.0% share in 2026 owing to neutral tones across diverse paving and façade schemes. Red Sandstone serves warmer architectural palettes across heritage-style landscape programs and selected exterior surface packages. White Sandstone supports lighter exterior surfaces while Yellow Sandstone serves paving and wall applications across varied project styles. Brown Sandstone provides earth-toned options for landscape programs and selected monuments requiring controlled color appearance. In January 2026 the U.S. Geological Survey reported that sandstone represented 17% of domestic dimension-stone tonnage during 2025. The material mix confirms a continuing supply base for differentiated sandstone types within finished stone procurement.
Which Application category has the largest share?
Flooring & Paving is estimated to account for 37.0% share in 2026
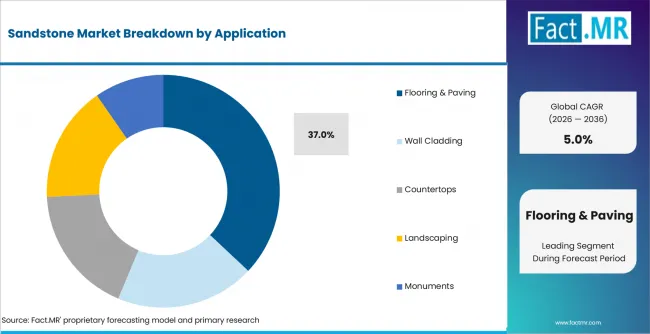
Sandstone Market Analysis By Application | Source: Fact.MR
Flooring & Paving is projected to account for 37.0% share in 2026 owing to repeat demand from patios and walkways across indoor and outdoor projects. Wall Cladding follows through architectural specifications that use sandstone for a visible surface with controlled color ranges. Countertops remain more selective due to abrasion and sealing requirements that influence material selection before fabrication begins. Landscaping applications extend across steps and garden structures while Monuments require stable stone selection and controlled finishing across long service periods. In July 2026 the U.S. Census Bureau placed May residential construction spending at an annualized USD 930.2 billion. The spending base sustains specification opportunities for sandstone surfaces used around housing and property improvement projects.
Which End Use category leads demand?
Residential Construction is projected to capture 46.0% share in 2026
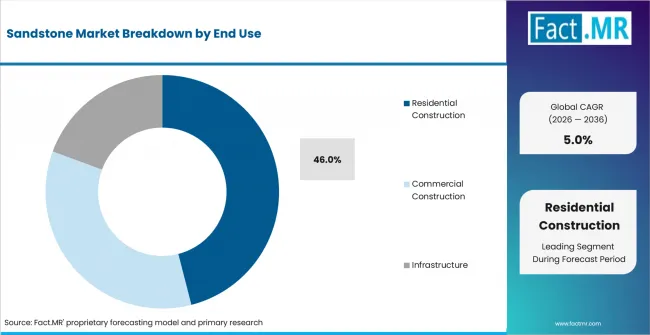
Sandstone Market Analysis By End Use | Source: Fact.MR
Residential Construction is anticipated to capture 46.0% share in 2026 owing to recurring patios and exterior surface demand across housing projects. Commercial Construction follows through hospitality and office projects that specify stone within visible floors and commercial cladding systems. Infrastructure demand includes plazas and pedestrian areas with replacement planning that influences specification decisions throughout project schedules. In June 2025 the Australian Bureau of Statistics reported that construction industry total income reached AUD 633.6 billion during 2023-24. The scale of construction activity illustrates broad project channels that can support sandstone demand across multiple end-use categories.
Which Finish category holds the largest share?
Natural/Split finish is forecast to hold 44.0% share in 2026
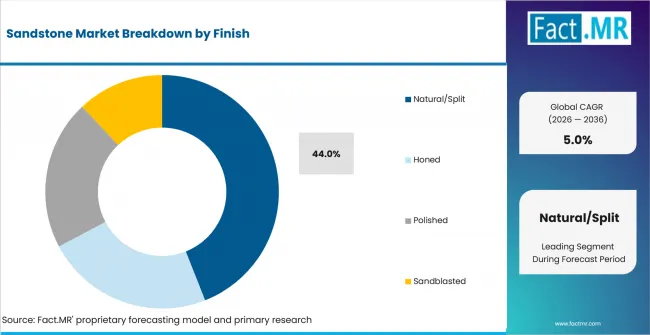
Sandstone Market Analysis By Finish | Source: Fact.MR
Natural/Split finish is estimated to represent 44.0% share in 2026 owing to outdoor paving demand and preference for visible stone texture. Honed finishes serve projects requiring a smoother appearance with lower surface relief and more controlled visual consistency. Polished sandstone remains selective due to stone density and maintenance conditions that affect suitability across different applications. Sandblasted surfaces provide another textured option for exterior areas requiring controlled appearance across repeat modules and phased deliveries. Finish selection ultimately depends on exposure conditions and slip requirements alongside cleaning expectations throughout the installed service period.
What is accelerating Sandstone Market adoption, and what is holding it back?
Construction surface specifications drive adoption while quarry variability and installation control costs restrain wider use across multiple project channels.
Drivers Impact Analysis
| DRIVER | (~) % IMPACT ON CAGR | GEOGRAPHIC RELEVANCE | IMPACT TIMELINE |
|---|---|---|---|
| Residential exterior surfaces and landscaping programs | +0.7% | North America, India and Australia | Medium term (2-4 years) |
| Public-realm paving and infrastructure refurbishment | +0.6% | India, China and Europe | Long term (≥ 4 years) |
| Heritage repair and stone-matching requirements | +0.4% | United Kingdom, Europe and United States | Medium term (2-4 years) |
| Quarry traceability and source documentation | +0.3% | Europe and export supply chains | Short term (≤ 2 years) |
| Calibrated formats and cut-to-size processing | +0.2% | Contractor channels across major regions | Medium term (2-4 years) |
Source: Fact.MR analysis. Updated Jul 10, 2026
- Residential exterior surfaces: Housing construction and property improvement programs create recurring sandstone orders for patios and steps plus walls and entrance paving. Professional landscaping services also influence product selection for coordinated paving and walling packages across large residential properties. In June 2026 the U.S. Census Bureau reported 1,413,000 annualized housing permits for May 2026 in the national housing market. Demand is expected to favor stock programs that pair calibrated paving with matching walling pieces and coordinated coping products.
- Public-realm paving: Civic plazas and pedestrian areas require repairable surface systems that combine wear resistance with project-specific appearance for long service cycles. Procurement is projected to expand across transport nodes and public spaces using natural stone within long service-life designs. Suppliers gain commercial ground through technical submittals that include sample boards and replacement-stock plans before contract award.
- Heritage repair: Restoration teams need replacement stone that matches color and bedding orientation while preserving compatible surface tooling on existing structures. Work is anticipated to remain specification-led due to visible mismatch risk after façade repairs or streetscape interventions. Quarry records and retained samples shorten the approval route for repeat restoration packages during phased conservation projects.
- Source documentation: Project teams increasingly request quarry origin records and evidence about worker management across stone processing locations. Adoption is estimated to strengthen for importers that connect purchase orders with traceability records and site-level corrective actions. Documentation depth affects contractor confidence on public tenders and long-duration private projects requiring accountable procurement records.
- Calibrated processing: Thickness control reduces site sorting and helps crews maintain consistent bedding depth on large paved areas during installation. Demand is forecast to widen for cut-to-size packages that arrive grouped by location and planned installation sequence. Fabricators that hold tolerances between repeat batches reduce rework risk while improving contractor confidence in phased deliveries.
Opportunity Impact Analysis
| OPPORTUNITY | (~) % IMPACT ON CAGR | GEOGRAPHIC RELEVANCE | IMPACT TIMELINE |
|---|---|---|---|
| Façade and public-space retrofit programs | +0.5% | Europe, United Kingdom and United States | Medium term (2-4 years) |
| Modular and preassembled stone cladding | +0.4% | Europe and commercial projects | Medium term (2-4 years) |
| Life-cycle material documentation | +0.3% | European Union and specification-led projects | Short term (≤ 2 years) |
| Traceable Indian sandstone supply programs | +0.3% | India, Europe and Australia | Long term (≥ 4 years) |
Source: Fact.MR analysis. Updated Jul 10, 2026
- Retrofit programs: Older building stock creates repeated sandstone demand for façade repair and external-area renewal in established urban property portfolios. The European Commission reported in June 2025 that 85% of EU buildings were built before 2000. Opportunity is expected to concentrate among suppliers supporting material matching and small-batch replenishment before restoration orders move to site. Technical review during specification also improves continuity between existing stone and replacement material during phased repair or conservation programs.
- Preassembled cladding: Factory-backed stone panels reduce some site cutting and give designers repeatable module dimensions on wall elevations during enclosure work. Adoption is projected to rise across façade systems requiring faster sequencing while retaining visible natural-stone texture on project exteriors. The commercial route depends on tested fixing details and clear interface responsibilities between panel suppliers and façade installers.
- Life-cycle documentation: European building rules are moving material decisions toward whole-life reporting and declared product information within project documentation. In December 2025 the European Commission stated that larger new buildings enter life-cycle GWP disclosure requirements from 2028. Specification opportunity is anticipated to improve for sandstone programs that document quarry distance and processing inputs. Suppliers also need transport assumptions and verified environmental records before project teams compare declared impacts.
- Traceable Indian supply: Rajasthan offers broad sandstone variety and export processing capability across paving formats and walling products plus setts and cut pieces. Opportunity is estimated to improve for importers that maintain supplier mapping and corrective-action records through quarry and factory tiers. Repeat programs reduce the commercial cost of rebuilding documentation for every project while preserving access to approved stone sources.
Restraints Impact Analysis
| RESTRAINT | (~) % IMPACT ON CAGR | GEOGRAPHIC RELEVANCE | IMPACT TIMELINE |
|---|---|---|---|
| Silica exposure controls and dust suppression costs | -0.4% | Quarry and fabrication operations | Short term (≤ 2 years) |
| Batch color and thickness variability | -0.3% | Specification projects across major regions | Medium term (2-4 years) |
| Freight exposure for heavy stone shipments | -0.3% | Long-haul import markets | Medium term (2-4 years) |
| Substitute surfaces and installation complexity | -0.2% | Residential and commercial interiors | Long term (≥ 4 years) |
Source: Fact.MR analysis. Updated Jul 10, 2026
- Silica control costs: Stone fabrication requires wet cutting and dust extraction plus exposure checks for workers who cut or finish sandstone products. In January 2026 the Health and Safety Executive stated that the workplace exposure limit for respirable crystalline silica is 0.1 mg/m³. Adoption is expected to remain selective among processors lacking extraction capacity or exposure-monitoring systems needed for safer high-dust cutting operations.
- Natural batch variability: Sandstone color and bedding character change between quarry benches or production runs due to geological variation remaining visible after processing. Large projects face rejection risk after delivered lots move outside approved visual ranges and documented finish expectations. Procurement is projected to favor suppliers that photograph batches and reserve material after sample approval before cutting begins.
- Freight exposure: Heavy stone carries a high transport burden relative to unit value over long export routes and multi-stage distribution chains. U.S. Geological Survey data published in January 2025 placed dimension-stone net import reliance at 83% by value during 2024. Near-term orders are anticipated to remain sensitive to freight changes and container availability in import-dependent project channels.
- Substitute surfaces: Porcelain and concrete paving compete in project programs prioritizing uniformity or simplified replacement across repeatable commercial surfaces. Plastic decking systems also compete in selected residential exterior areas requiring repeatable modules and lower stone-handling requirements. Sandstone installation needs substrate preparation and joint detailing that increase execution risk for inexperienced installation teams. Demand is estimated to stay more defensible in projects that value natural variation and repairable individual units within the design brief.
Which countries are scaling Sandstone Market notably?
India 6.8%; China 6.1%, Australia 4.8%, United Kingdom 4.5%, United States 4.3%.
The geographic segmentation covers North America and Europe before extending across Asia Pacific; Central and South America; and the Middle East and Africa.
.webp "Top Country Growth Comparison Sandstone Market Cagr (2026 2036)")
Top Country Growth Comparison Sandstone Market Cagr (2026 2036) | Source: Fact.MR
| COUNTRY | CAGR |
|---|---|
| India | 6.8% |
| China | 6.1% |
| Australia | 4.8% |
| United Kingdom | 4.5% |
| United States | 4.3% |
Source: Fact.MR analysis. Updated Jul 10, 2026
Why is India strengthening its sandstone market position?
6.8% CAGR, driven by construction expansion and Rajasthan sandstone processing capacity.
Rapid construction growth is reinforcing sandstone demand across housing projects and public infrastructure development. In May 2025, official estimates placed construction-sector growth at 9.4% for FY 2024–25. The sandstone market is expected to record a 6.8% CAGR over the assessment period due to project activity and established processing capabilities. Regional processors gain commercial opportunities when project-specific cutting and finishing services support domestic construction and export requirements.
How is urban renewal sustaining sandstone demand in China?
6.1% CAGR, supported by extensive building stock and continuing public-space renewal.
Despite property-market adjustment, China retains a vast building base that supports refurbishment and municipal improvement programs. In January 2026, the National Bureau of Statistics reported 881.01 million square meters of newly built commercial building floor space sold during 2025. The sandstone market is projected to post a 6.1% CAGR between 2026 and 2036 as urban renewal supports material demand. Suppliers can improve project access through consistent specifications and dependable delivery across large municipal construction programs.
Where is Australia finding new sandstone demand?
4.8% CAGR, owing to residential construction and selected civil project activity.
A renewed pipeline of dwelling construction is creating practical demand for paving and exterior landscape materials. The Australian Bureau of Statistics reported that total dwelling commencements increased 8.0% during the December 2025 quarter. Sandstone demand is anticipated to advance at a 4.8% CAGR during the forecast period due to residential exterior work and selected public projects. Distributor stock programs provide an advantage by reducing replenishment delays during phased landscape installations.
Why is repair activity supporting the United Kingdom outlook?
4.5% CAGR, owing to refurbishment cycles and recurring hard-landscape replacement requirements.
Existing properties create recurring opportunities for sandstone replacement across paving and external renovation work. In February 2026, the Office for National Statistics reported that annual construction output increased 1.8% during 2025. Demand is estimated to record a 4.5% CAGR by 2036 as refurbishment cycles sustain contractor purchasing. Suppliers gain account continuity when calibrated paving products support phased replacement work across existing properties.
What gives United States sandstone demand a stronger domestic base?
4.3% CAGR, reinforced by domestic dimension-stone output and exterior construction activity.
Domestic quarry production gives United States buyers access to established dimension-stone supply for construction and landscape applications. The U.S. Geological Survey estimated that domestic producers sold or used 2.3 million tons of dimension stone during 2025. Sandstone demand is forecast to post a 4.3% CAGR over the assessment period due to exterior construction and public-space applications. Specifiers gain confidence when products include testing records and installation guidance suited to regional exposure conditions.
How are permitting volumes shaping Germany’s sandstone outlook?
4.0% CAGR, supported by renovation activity and specification-led construction demand.
Permitting activity continues to create project opportunities alongside renovation work across Germany’s extensive existing building stock. Federal Statistical Office data recorded 21,775 dwellings covered by building permits during March 2026. Sandstone demand is projected to record a 4.0% CAGR over the assessment period through renovation programs and specification-led exterior work. Suppliers remain better positioned when dependable color ranges support phased delivery across public-space and building projects.
Why does replacement activity remain important in Japan?
3.7% CAGR, owing to refurbishment work and continuing construction activity across selected natural-stone applications.
Replacement-focused projects provide sandstone suppliers with targeted opportunities across landscaping and architectural refurbishment. In September 2025, Japan’s infrastructure ministry reported approximately 792,000 new housing starts during 2024. Sandstone demand is estimated to post a 3.7% CAGR by 2036 owing to paving and renovation requirements. Suppliers can strengthen account retention through consistent finishing and flexible order programs suited to phased refurbishment work.
Who are the major Sandstone Market providers?
Levantina Group leads while Marshalls plc and Boral Ltd compete through natural-stone and construction-material channels.
Key players such as Levantina Group combines quarry ownership with architectural stone processing and broad project access across diverse natural-stone applications. Marshalls plc competes through sandstone paving ranges plus established hard-landscaping channels serving commercial and public projects. Boral Ltd adds quarry-material scale and contractor access across Australian construction markets and infrastructure supply channels. Competition among these larger providers centers on supply reliability and project documentation across repeat construction programs. Format consistency also affects repeat orders throughout phased work and replacement programs requiring dependable material continuity.
Rajasthan Stones supplies quarry-based stone processing from Jaipur for domestic projects and export-oriented construction requirements. Smaller specialists compete through quarry access and custom processing capabilities that support project-specific formats and replacement requirements. Larger groups retain an advantage through distribution reach and technical documentation that shape procurement decisions across major project channels.
Which companies are the key providers?
Levantina Group; Marshalls plc; Boral Ltd; Rajasthan Stones;
- Levantina Group
- Marshalls plc
- Boral Ltd
- Rajasthan Stones
Bibliography
- Australian Bureau of Statistics. (2025, June 24). The nuts and bolts of the Australian construction industry. Australian Bureau of Statistics.
- Australian Bureau of Statistics. (2026, February 25). Construction work done, Australia, preliminary, December 2025. Australian Bureau of Statistics.
- Boral. (2025, May). Capability Statement 2025. Boral.
- European Commission. (2025, June 30). Commission sets the EU’s building sector on a pathway towards greater energy efficiency and decarbonisation. Directorate-General for Energy.
- European Commission. (2025, December 16). Commission encourages low-carbon construction materials with calculation framework for life-cycle global warming potential. Directorate-General for Energy.
- Federal Statistical Office of Germany. (2026, June 18). Building permits in building construction. Destatis.
- Health and Safety Executive. (2026, January 20). Silicosis - causes and risk controls. Health and Safety Executive.
- Marshalls. (2025, February 21). Environmental Product Declaration: Indian Sandstone - Natural Stone. Marshalls.
- Marshalls plc. (2026, March 16). Annual Report & Accounts 2025. Marshalls plc.
- Ministry of Land, Infrastructure, Transport and Tourism. (2025, September 2). Fiscal Year 2024 Trends Concerning Land. Government of Japan.
- Ministry of Statistics and Programme Implementation. (2025, May 30). Provisional estimates of annual gross domestic product for 2024-25 and quarterly estimates for the fourth quarter. Government of India.
- National Bureau of Statistics of China. (2026, January 19). National economy pushed forward with innovation-led and high-quality development and expected targets achieved successfully in 2025. National Bureau of Statistics of China.
- Office for National Statistics. (2025, September 12). Construction output in Great Britain: July 2025. Office for National Statistics.
- Office for National Statistics. (2026, February 12). Construction output in Great Britain: December 2025, new orders and Construction Output Price Indices, October to December 2025. Office for National Statistics.
- Levantina Group (2025, June 1). How limestone slabs enhance home exteriors: A comprehensive guide.
- U.S. Census Bureau. (2026, June 16). Monthly new residential construction, May 2026. U.S. Department of Commerce.
- U.S. Census Bureau. (2026, July 1). Monthly construction spending, May 2026. U.S. Department of Commerce.
- U.S. Geological Survey. (2025, January). Mineral Commodity Summaries 2025: Stone (Dimension). U.S. Geological Survey.
- U.S. Geological Survey. (2026, January). Mineral Commodity Summaries 2026: Stone (Dimension). U.S. Geological Survey.
This Report Addresses
- The report provides strategic intelligence on Sandstone through Type and Application choices that shape material selection and project specification decisions.
- Segment analysis covers Grey Sandstone and Flooring & Paving together with Residential Construction demand and Natural/Split finishing within the 2026 market structure.
- Regional outlook evaluates India and China before comparing Australia and the United Kingdom across the country forecast structure. The United States follows in the review before Germany and Japan complete the seven-country growth comparison.
- Competitive analysis profiles Levantina Group and Marshalls plc before reviewing Boral Ltd and Rajasthan Stones across major supplier channels.
- Type assessment covers Grey Sandstone and Red Sandstone before reviewing White Sandstone and Yellow Sandstone across defined project applications. Brown Sandstone completes the type structure through earth-toned products used in landscaping and monument applications.
- Use-case assessment covers Flooring & Paving and Wall Cladding before reviewing Countertops and Landscaping across project channels. Monuments complete the application structure through finished sandstone products used for memorial and architectural requirements.
What does the Sandstone Market cover?
Sandstone slabs and tiles support building surfaces plus public spaces through varied finishes and project-ready dimensional formats.
The Sandstone Market covers quarried stone processed into flooring units and paving products together with wall-cladding pieces and countertop slabs. Coverage also includes landscaping stone and monument applications with sandstone forming the primary visible or functional material. The Type dimension covers Grey Sandstone and Red Sandstone together with White Sandstone and Yellow Sandstone. Brown Sandstone completes the type structure through products for landscaping and monument applications across defined project programs.
The market differs from aggregate categories through value created by selected blocks and controlled processing before project use. The Finish dimension covers Natural/Split and Honed surfaces together with Polished and Sandblasted options across defined application conditions. Stucco systems provide an adjacent façade comparison for projects evaluating textured exterior surfaces and alternative finish requirements. Crushed sandstone used mainly for aggregates remains outside the boundary unless sell finished sandstone components for project installation.
What is included in the scope?
Sandstone products cover building envelopes and floors together with outdoor paving and landscape structures across construction projects.
The scope includes Grey Sandstone and Red Sandstone together with White Sandstone and Yellow Sandstone across finished product applications. Brown Sandstone remains included for defined project applications requiring earth-toned surfaces and controlled finishing across selected construction programs.
Application coverage spans Flooring & Paving and Wall Cladding together with Countertops and Landscaping across major project channels. Monuments remain included for finished sandstone material used in memorial and architectural applications requiring controlled selection. End Use coverage includes Residential Construction and Commercial Construction together with Infrastructure demand across public-space and transport projects. Finish views cover Natural/Split and Honed products alongside Polished and Sandblasted surfaces for varied exposure conditions. Adjacent granite slabs provide a natural-stone comparison for quarry processing and specification decisions across dimension-stone procurement programs. Natural-stone sealants add maintenance context without changing the sandstone product boundary used for market sizing or competitive analysis.
What is excluded from the scope?
Crushed stone aggregates and imitation stone surfaces remain outside the market scope for finished sandstone products and project-specific applications.
The scope excludes crushed sandstone sold mainly for aggregate production together with sand output and quarry equipment. Unrelated mineral extraction services also remain outside the market boundary for finished sandstone products and defined project applications. Vitrified tiles remain an adjacent surface category unless sandstone itself forms the purchased stone component. Floor panel systems also remain adjacent surface categories unless sandstone itself forms the purchased stone component within defined project work. General construction services are excluded except for activity that directly explains sandstone procurement or installation requirements.
How was the analysis built?
120+ sources, 40+ company portfolios, 25+ countries, 20+ interviews.
- Primary Research
- Primary research includes interviews with sandstone quarry operators, dimensional stone processors, construction material suppliers and building product distributors. It also includes input from architects, contractors, infrastructure developers, procurement managers and stone industry specialists involved in sourcing and application decisions.
- Desk Research
- Desk research reviews construction industry statistics, mining and quarrying reports, natural stone trade data, building material regulations and company product portfolios. Industry publications, project databases, sustainability reports and supplier catalogs are also assessed to evaluate market trends and competitive positioning.
- Market-Sizing and Forecasting
- Forecasting uses construction activity, infrastructure investment trends, natural stone consumption, quarry production volumes and average sandstone pricing across major regions. Models consider residential and commercial building demand, landscape applications, renovation activity and trade flows influencing sandstone consumption.
- Data Validation and Update Cycle
- Forecasts are validated through industry interviews that test assumptions on production capacity, demand trends and procurement activity. Portfolio mapping, regional construction assessment and stakeholder feedback help confirm market direction, while ongoing reviews of project pipelines, regulatory developments and quarry expansion activities support forecast updates.
Segmentation
What is the report’s scope and coverage?
| Attribute | Details |
|---|---|
| Quantitative Units | USD million |
| Market Definition | Quarried sandstone processed into slabs, tiles, paving units, setts, walling pieces, copings, steps, and cut-to-size components for building surfaces, landscaping, public spaces, and restoration. |
| Type | Grey Sandstone; Red Sandstone; White Sandstone; Yellow Sandstone; Brown Sandstone |
| Application | Flooring & Paving; Wall Cladding; Countertops; Landscaping; Monuments |
| End Use | Residential Construction; Commercial Construction; Infrastructure |
| Finish | Natural/Split; Honed; Polished; Sandblasted |
| Regions Covered | North America; Europe; Asia Pacific; Central and South America; Middle East and Africa |
| Countries Covered | India; China; Australia; United Kingdom; United States; Germany; Japan |
| Key Companies Profiled | Levantina Group; Marshalls plc; Boral Ltd; Rajasthan Stones; |
| Forecast Period | 2026 to 2036 |
| Approach | Hybrid top-down and bottom-up approach using construction activity; dimension-stone output; sandstone type mix; application demand; end-use construction channels; finish preferences; quarry processing |
Source: Fact.MR analysis. Updated Jul 10, 2026
How is the market segmented?
-
By Type
- Grey Sandstone
- Red Sandstone
- White Sandstone
- Yellow Sandstone
- Brown Sandstone
-
By Application
- Flooring & Paving
- Wall Cladding
- Countertops
- Landscaping
- Monuments
-
By End Use
- Residential Construction
- Commercial Construction
- Infrastructure
-
By Finish
- Natural/Split
- Honed
- Polished
- Sandblasted
-
By Region
- North America
- United States
- Canada
- Europe
- Germany
- United Kingdom
- France
- Italy
- Spain
- Asia Pacific
- India
- China
- Japan
- South Korea
- Australia
- Latin America
- Brazil
- Argentina
- Mexico
- Chile
- Middle East and Africa
- UAE
- Saudi Arabia
- South Africa
- North America
Frequently Asked Questions
Which Color category dominates the Sandstone Market?
How significant is the Flooring & Paving segment in the Sandstone Market?
Which end-use sector generates the largest demand for sandstone?
What position does Natural/Split finish hold in the Sandstone Market?
Which country is expected to witness the fastest growth in the Sandstone Market?
How is the Sandstone Market evolving in China?
What outlook is anticipated for Australia in the Sandstone Market?
How is demand expected to progress in the United Kingdom?
What growth trajectory is forecast for the United States?
How will Germany perform in the Sandstone Market?
What expansion rate is expected for Japan?
What factor primarily drives demand in the Sandstone Market?
Which challenge most significantly restrains market growth?
Why does Flooring & Paving remain a key application area?
Who worked on this report


Preview the report firsthand - request a free sample
Free SampleGet the brochure for pricing and purchase details
Download PDF