


- Base Value(2025): 1800 Mn
- Forecast Value (2035): 3475 Mn
- CAGR (2035): 7.7%
Sensor Inks Market Outlook (2025 to 2035)
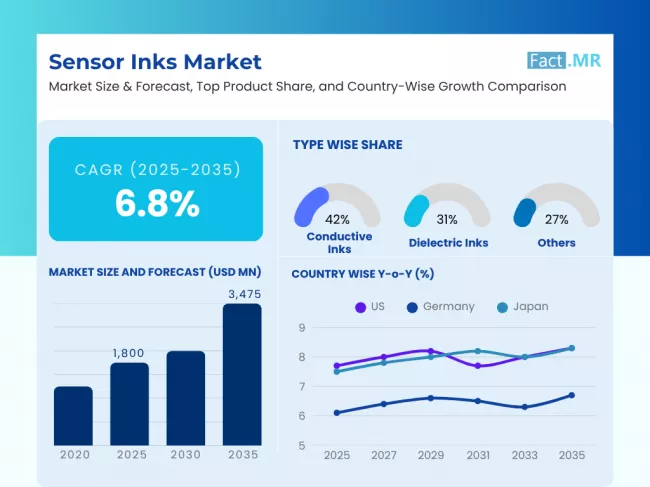
The global sensor inks market is expected to reach USD 3,475 million by 2035, up from USD 1,692 million in 2024. During the forecast period (2025 to 2035), the industry is projected to expand at a CAGR of 6.8%.
Flexible, low-cost perimeter sensor inks are emerging as flex enablers of next-generation electronics. The increasing demand for wearable health monitors, automotive pressure sensors, and intelligent packaging is contributing to the urgency in the market. The suitability to roll-to-roll printing, enhanced conductivity and stability of the materials make sensor inks invaluable in real-time diagnostics, condition monitoring, and embedded electronics applications.
What are the drivers of the sensor inks market?
The adoption of sensor ink is increasing due to the demand for low-cost, scalable sensing technologies. Inks used in medical wearable products must be able to adhere to the skin, withstand transport, and deliver accurate feedback. Silver nanoparticles or carbon-based inks fulfill these performance requirements, as they are compatible with the formation of a biocompatible substrate and enable rapid, high-speed biocompatible printing.
The other important driver is industrial automation. Printed temperature, pressure and strain sensors are increasingly being embedded in factory equipment by predictive maintenance tools. Sensor inks enable such applications due to their mechanical flexibility and durability, making them suitable for use in vibration-sensitive or thermally variable environments. This boosts their implementation in Industry 4.0 models.
The changing demands of retailing and shipping are driving the increased use of printed and electronic labels. Sensor inks enable low-power environmental monitoring applications, allowing for the real-time display of temperature, humidity, and food freshness. There is a high demand for inks that are developed to dry quickly and have a long shelf life. With the growing need for smart labeling by brands, sensor inks are also the keys to packaging innovation and supply chain intelligence initiatives.
What are the regional trends of the sensor inks market?
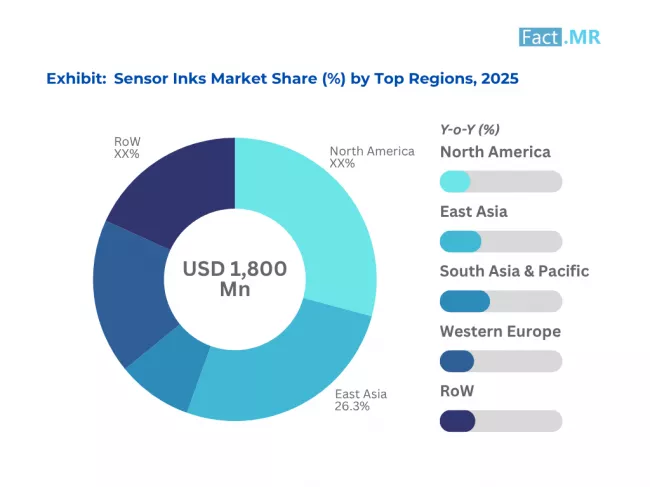
Commercialization is leading in North America, primarily in the healthcare sector. Companies in the United States incorporate sensor inks into patches they put on clothes, glucose meters and Remote surveillance of patients. The area has the benefits of venture capital, medical research complexes and early adopter OEMs.
Europe is concentrated on eco-compliance and automotive electronics. Germany is also developing printed sensor units for intelligent interiors and EV parts. Horizon Europe and similar EU funding programs continue to support the development of stretchable, recyclable sensor materials and sustainable ink formulations.
The fastest growth is measured in the Asia Pacific region, with top leadership of Japan and South Korea. Japan bets on robotic health aids and ambient assisted living systems based on printed sensors, and the South Korean companies produce flexible sensor arrays used in smartphones, displays, and automobiles. The development of China relies on mass production, with the second reason being state-sponsored electronics programs.
What are the challenges and restraining factors of the sensor inks market?
The variable performance across substrates presents one source of a serious bottleneck. The sensor ink should be able to cover a wide range of surfaces, including PET, TPU, and biodegradable films. Lack of consistency in adhesion decreases precise performance and the lifetimes of the devices.
The second difficulty is associated with satisfying regulatory and toxicological specifications. Concerns exist regarding metallic nano-particulate and chemical-based binders in conductive and piezoresistive inks, as raised by health and environmental regulators. Obtaining multi-region approvals can significantly delay the rollout of a product and also increase the cost of compliance.
Country-Wise Insights
United States - Leading in Biomedical Integration
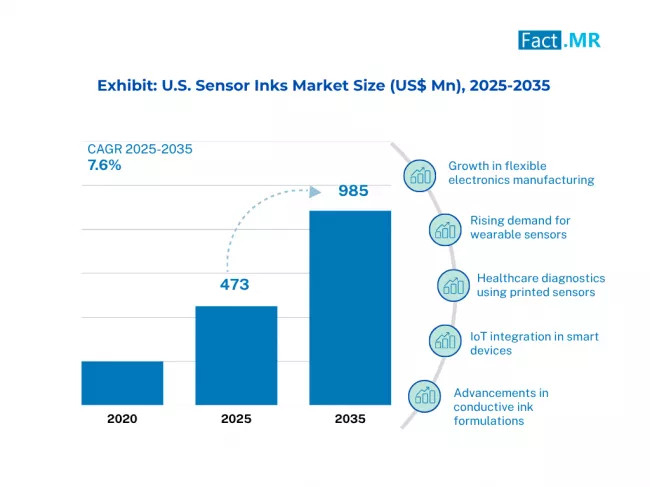
The United States has led the way in wearable and diagnostic sensor inks as the medical device company ecosystem is robust and connects with printed electronics startups. Advanced research centers are constantly shedding off material breakthroughs.
Medical wearables and smart packaging are leading the way in commercial development. Adjusted silver-based inks that are suitable in direct contact with the skin and disposables in diagnostics are rapidly growing. The defense industry also aids sensor reliability in R&D.
The level of consumption in the U.S. allows the companies to maintain a stable balance between imports and exports to Europe and Asia. Their competitive advantage lies in the formulations tailored to specific requirements and their collaboration with end-users. The relationships with healthcare OEMs and supply chain integrators serve to strengthen our market position. Government innovation grants ensure future leadership.
Japan - Precision Engineering and Electronics Leadership
Japan leads in the development of sensor ink formulations for robotics, healthcare, and the automotive industry. Its clean manufacturing process contributes to the manufacture of high-conductivity and tolerant inks of mini electronic devices.
Domestic applications primarily focus on aging-related care solutions and sensor-enhanced robotics. Motion tracking, physical therapy, and ambient assisted living platforms can be realized by using printed sensors.
Japanese companies sell high-reliability inks across Europe, the ASEAN region, and North America. The products they offer are long-lasting and multi-cycled. The strategic alliance between research collaborators and universities, as well as suppliers, has maintained worldwide confidence in Japanese technology for sensor ink and its ease of integration.
Germany - Automotive and Industrial Sensor Focus
The German advantage is that the country utilizes sensor inks in automation and in automobiles. Major automobile suppliers have been incorporating sensor-integrated components to monitor the condition of the cabin system.
Smart infrastructure, logistics, and energy also increase in the use of sensor inks. Ink retailers collaborate with equipment integrators and introduce high standards of material evaluation to sustain performance.
The export activity of Germans involves the intra-European and Middle East markets. Their value proposition is durability, compliance and performance in harsh conditions. Centers of innovation and cross-border R&D initiatives entrench Germany in high-stability sensor inks in harsh environments and long-existing asset incorporations.
Category-Wise Analysis
Conductive Inks Dominate Due to Pervasive Demand in Flexible Electronics
In sensor inks, conductive inks dominate due to their critical importance in the development of flexible, low-cost, high-performance electronic components. These are essential for printed circuit boards (PCBs), RFID tags, and flexible sensors, allowing for ease of electronic conductivity across a wide range of materials, including plastics, glass, and textiles.
They find wide usage in sectors such as the healthcare industry, the automotive sector, and the consumer electronics sector, where the compactness of integrating devices is crucial. Carbon-based and silver-based inks continue to be the leading inks because they have high competence and flexibility.
The other significant driver of demand is the increasing popularity of wearable electronics and smart textiles, driven by the rapid rise in IoT devices. Green laws, such as RoHS and REACH, are providing a boost to innovation in eco-friendly ink formulation. The economic projection for the conductive ink world is quite healthy and advanced, with the Asia-Pacific region serving as the production center.
Wearable Electronics Drive Massive Uptake of Sensor Inks
Wearable electronics account for the fastest-growing application segment in the sensor inks market, driven by growing consumer demand for wearable devices to monitor health, track fitness, and perform biometric sensing on the go. Such machines depend greatly on flexible, stretchable, and skin-friendly sensor inks to relay information on sensors sewn into outfits, watches, or even patches.
Conductive inks and thermochromic inks are also popular due to their responsiveness and durability, which enable them to be used in dynamically changing environments, including sporting and medical diagnostics applications.
The growth of printed electronics and an increase in investments in digital health drive the growth of this segment. The U.S., Germany, and Japan are among the countries witnessing a rapid upsurge in wearable technology, driven by the aging population and the growing shift toward preventive care.
High-quality, biocompatible sensor inks are also being encouraged by regulatory frameworks with an emphasis on patient safety and device efficacy. With AI penetration and real-time analytics becoming the norm, sensor ink has numerous uses yet to be realized, with wearable electronics being one of the highest-potential applications.
Competitive Analysis
Key players in the sensor inks industry include DuPont, Henkel AG & Co. KGaA, Sun Chemical Corporation, Heraeus Holding GmbH, Poly-Ink, NovaCentrix, Creative Materials Inc., Johnson Matthey, Vorbeck Materials, Electroninks, Applied Ink Solutions, and InkTec Co., Ltd..
The marketing strategy of sensor inks revolves around competition centered on the compatibility of prints, electrical performance, and durability. The major suppliers are developing formulations that will decrease curing time, enhance ink substrate adhesion, and be compatible with multiple surfaces. Hybrid systems incorporating silver nanoparticles, carbon, and graphene are developing rapidly to meet segment requirements.
Some of the differentiation mechanisms involve providing full-stack offerings, such as inks, substrate coatings, and integration support. A price rationale instigates the use of hybrid conductive options. Suppliers who provide pre-tested design libraries are in high demand, as they reduce the time to deployment.
The most competitive wearable biosensing and automotive interior activities are driven by innovation. The strength of IP protection in the field of dispersion technology, which enables sharper printed words, presents a challenge that cannot be ignored in markets with new companies entering the business, particularly in established regions.
Recent Development
- In June 2025, Veolia's PlastiLoop platform launched initiatives on World Environment Day to convert hard-to-recycle plastic waste into high-quality recycled resins. This includes a chemical recycling pilot in Europe and partnerships with packaging brands to integrate PlastiLoop resin into consumer products, aiming to divert millions of tonnes of ocean-bound and post-industrial plastics into closed-loop supply chains.
- In June 2025, Creative Materials Inc. launched its 126-40 series of multi-purpose conductive epoxies, available in SD and SP variants. These epoxies offered flexibility, fine-line precision, solvent resistance, and durability for applications such as touchscreen bus bars and membrane switches. Curing at temperatures as low as 100 °C, they reflected Creative Materials’ commitment to high-performance innovation in printed electronics.
Fact.MR has provided detailed information about the price points of key manufacturers of the Sensor Inks Market positioned across regions, sales growth, production capacity, and speculative technological expansion in the recently published report.
Methodology and Industry Tracking Approach
The 2025 sensor inks market report by Fact.MR compiles insights from 1,200 stakeholders across 12 countries, with a minimum of 75 responses per country. Among respondents, 65% were end users, including medical device companies, printed electronics suppliers, packaging innovators, and automotive sensor manufacturers. The remaining 35% comprised R&D directors, sourcing heads, quality assurance experts, and integration consultants.
Data was collected from June 2024 to May 2025, targeting performance indicators such as conductivity, drying time, adhesion to flexible substrates, substrate-ink compatibility, and sintering requirements. A regionally weighted model ensured accurate representation across North America, Europe, and Asia Pacific.
Inputs were validated using over 95 sources, including proprietary technical reports, peer-reviewed research, government filings, and product specification sheets. Fact.MR applied triangulation and forecasting models to deliver actionable insights on market sizing, growth opportunities, pricing dynamics, and end-use evolution across global sensor ink stakeholders and verticals.
Fact.MR applied rigorous analytical tools, such as multivariate regression and scenario modeling, to ensure data robustness. With continuous monitoring of the sensor inks market since 2018, this report provides a comprehensive roadmap for firms seeking a competitive advantage, innovation, and sustainable growth within the sector.
Segmentation of Sensor inks Market
-
By Type :
- Conductive Inks
- Dielectric Inks
- Piezoelectric Inks
- Thermochromic Inks
-
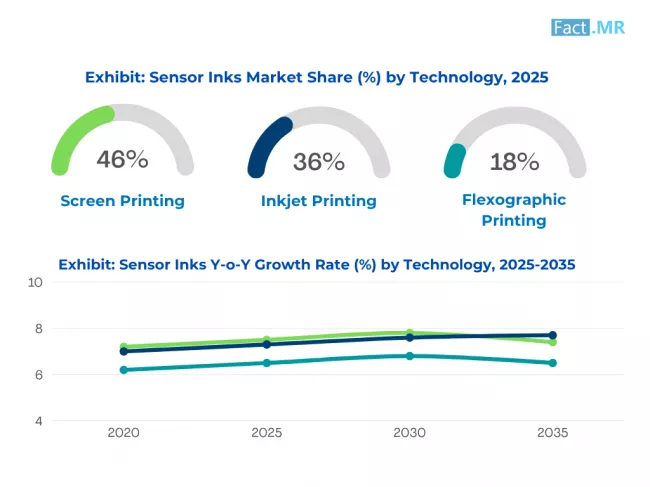
By Technology :
- Screen Printing
- Inkjet Printing
- Flexographic Printing
-
By Application :
- Wearable Electronics
- Automotive Sensors
- Medical Devices
- Industrial IoT
- Smart Packaging
-
By End-User Industry :
- Electronics & Semiconductors
- Healthcare
- Automotive
- Aerospace & Defense
- Consumer Goods
-
By Region :
- North America
- Latin America
- Western Europe
- Eastern Europe
- East Asia
- South Asia & Pacific
- Middle East & Africa
- Frequently Asked Questions -
What was the Global Sensor inks Market Size Reported by Fact.MR for 2025?
The global sensor inks market was valued at USD 1,800 million in 2025.
Who are the Major Players Operating in the Sensor inks Market?
Prominent players in the market are DuPont, Henkel AG & Co. KGaA, Sun Chemical Corporation, Heraeus Holding GmbH, among others.
What is the Estimated Valuation of the Sensor inks Market in 2035?
The market is expected to reach a valuation of USD 3,475 million in 2035.
What Value CAGR did the Sensor inks Market Exhibit Over the Last Five Years?
The historic growth rate of the sensor inks market was 6.0% from 2020 to 2024.