- Market Value (2025): USD 724.9 Mn
- Estimated Value (2026): USD 760.0 Mn
- Forecast Value (2036): USD 1220.0 Mn
- CAGR (2026-2036): 4.8%
What is the Tension Fabric Displays Market forecast to be worth by 2036?
USD 760.0 million in 2026 to USD 1220.0 million by 2036 at 4.8% CAGR.
- The tension fabric displays market crossed a valuation of USD 724.9 million in 2025 as customers increased spending on lighter display logistics and high-resolution textile printing.
- Market revenue is projected to move from USD 760.0 million in 2026 to USD 1220.0 million by 2036.
- The market is forecast to record 4.8% CAGR from 2026 to 2036. Rapid graphic refresh and reusable frames support the forecast. Demand for large seamless backdrops adds a further purchase reason.
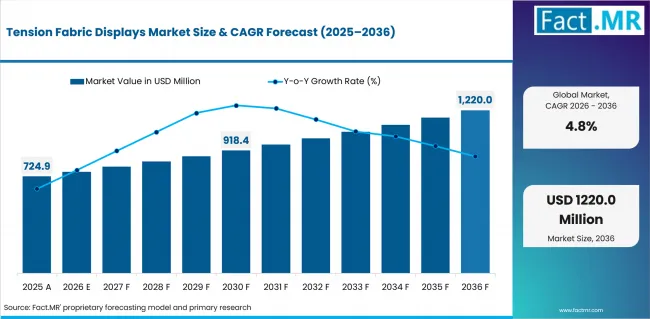
Tension Fabric Displays Market Value Analysis | Source: Fact.MR
What are the defining numbers behind Tension Fabric Displays Market growth?
USD 460.0 million absolute opportunity by 2036 led by Backdrop walls and Tube frames alongside Dye sublimation and Trade shows.
- Demand Drivers in the Market
- Lighter display logistics are expected to reduce handling effort when event assets move between venues and storage sites. Customers approve replacement programs faster when the frame and fabric work with a defined transport case.
- High-resolution textile printing is projected to give the display surface a cleaner brand finish. It supports updated campaign artwork where customers need fabric graphics that retain color after packing and setup.
- Rapid graphic refresh is anticipated to support campaign purchases because the same structure can carry new messages across several events. The value is clearest when artwork changes without replacing the frame system.
- Large seamless backdrops are expected to remain important because exhibitors want broad brand surfaces for photos and product launches. A well-tensioned fabric wall helps reduce visible joins and site adjustment work.
- Key Segments Analyzed
- By Product Form: Backdrop walls are expected to hold 33.0% share in 2026. They give customers a broad branded surface with manageable setup and packing needs.
- By Frame Profile: Tube frames are projected to account for 29.0% share in 2026. The format suits lightweight transport and repeatable assembly across recurring event programs.
- By Print Method: Dye sublimation is anticipated to capture 38.0% share in 2026. It fits textile graphics that need consistent color and a smooth surface finish.
- By Event Type: Trade shows are estimated to represent 36.0% share in 2026. Exhibitors continue to require portable backdrops and branded booth systems.
- By Reuse Frequency: 1-2 events are forecast to account for 18.0% share in 2026. Short-use programs still require polished graphics without permanent installation cost.
- Analyst Opinion at Fact.MR
- • Shambhu Nath Jha, Senior Analyst at Fact.MR, states, “A credible tension fabric display offer must make graphic fit and fabric durability easy to verify. Customers approve the product faster when the provider explains how the frame and print behave after packing and reuse.”
- Strategic Implications
- Event buyers can define artwork tolerances before ordering backdrops or modular walls. Clear specifications protect graphic fit and help providers align fabric selection with frame design and expected reuse frequency.
- Display providers benefit from documenting the installation and servicing process for tube frames and SEG systems. Backlit formats require particular care because fabric tension and lighting can make alignment problems more noticeable.
- Venue operators and agencies may test each display across different event layouts before approving it for repeated use. Early trials reveal installation risks before high-traffic exhibitions or programs with short turnaround times.
UAE is expected to post 5.5% CAGR as international event venues require fast setup and reliable support. USA is anticipated to grow at 4.8% through measured exhibitor procurement and repeat-use review. Japan is estimated at 4.7% because compact systems and careful setup remain important. UK is forecast at 4.5% through recurring business exhibitions. Germany is projected to reach 4.2% through technically demanding trade-fair use.
How does the Tension Fabric Displays Market break down by segment?
Backdrop walls are expected to lead Product Form at 33.0% share. Tube frames are projected to lead Frame Profile at 29.0% share in 2026.
Which product form dominates?
Backdrop walls are projected to account for 33.0% share in 2026.
Broad visual coverage and fast installation give backdrop walls the leading position. They work well for press moments, sponsor branding, and photo-focused event spaces without requiring a permanent structure. Fabric towers and hanging signs add vertical visibility, while counters and kiosks fit smaller booth layouts.
What leads the Frame Profile segment?
Tube frames are expected to hold 29.0% share in 2026.
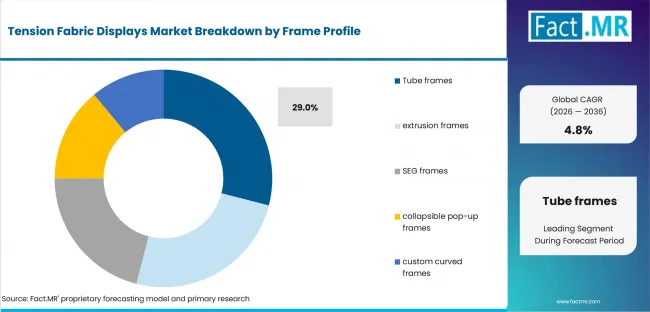
Tension Fabric Displays Market Analysis By Frame Profile | Source: Fact.MR
Portability and repeat assembly support demand for tube frames. Their rounded structure works well with fabric sleeves and compact transport cases. Extrusion frames and SEG frames remain relevant where exhibitors need tighter graphic fitting or a more structured modular wall system.
How does Print Method shape demand?
Dye sublimation is anticipated to lead with 38.0% share in 2026.
Tension Fabric Displays Market Analysis By Print Method | Source: Fact.MR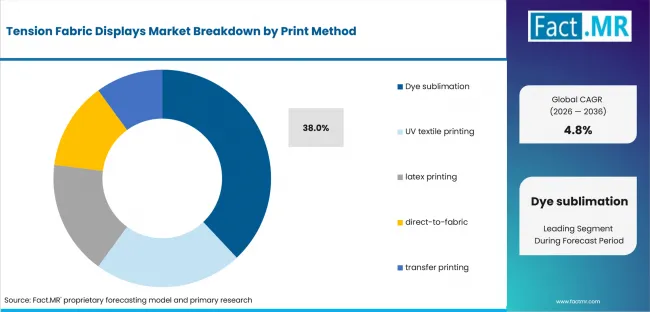
What supports Trade shows within Event Type?
Trade shows are estimated to represent 36.0% share in 2026.
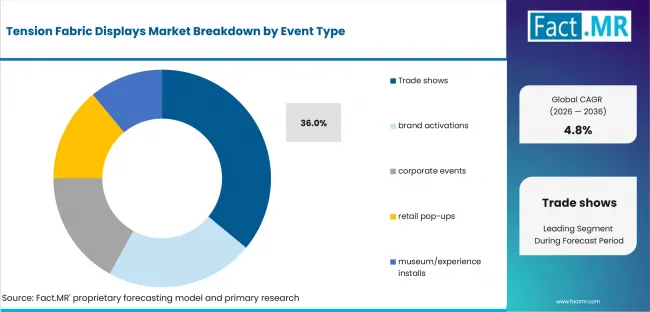
Tension Fabric Displays Market Analysis By Event Type | Source: Fact.MR
Frequent branding changes and varied booth footprints keep trade shows at the forefront of demand. Exhibitors value display systems that assemble quickly and accept updated graphics without a complete rebuild. Brand activations and corporate events add further demand, although their service and presentation requirements often differ.
Why do 1-2 events lead Reuse Frequency?
1-2 events are forecast to hold 18.0% share in 2026.
Many campaigns require a polished event presence for only a limited number of appearances. This makes short-use programs more common than long-term ownership models. Even with limited reuse, the display must arrive clean and fit correctly. Higher reuse categories place greater importance on fabric care, storage, and inspection after each event.
What is accelerating Tension Fabric Displays Market adoption, and what is holding it back?
Demand is expected to be driven by lighter display logistics and rapid graphic refresh. Adoption is expected to be held back by wrinkling and frame stress from incorrect tension.
Drivers Impact Analysis
| DRIVER | (~) % IMPACT ON CAGR | GEOGRAPHIC RELEVANCE | IMPACT TIMELINE |
|---|---|---|---|
| Lighter display logistics | +1.3% | Mature exhibition markets | Short term (<= 2 years) |
| High-resolution textile printing | +1.0% | Global | Short term (<= 2 years) |
| Rapid graphic refresh | +0.8% | North America and Europe | Medium term (2-4 years) |
| Demand for large seamless backdrops | +0.5% | China and UAE | Medium term (2-4 years) |
Source: Fact.MR analysis. Updated Jul 28, 2026
- Lighter display logistics: Portable frames and fabric graphics are expected to reduce storage and transport friction for recurring events. This helps customers compare total event cost with fewer freight and handling concerns.
- High-resolution textile printing: Better print quality is projected to raise expectations for color accuracy and surface finish. Customers are therefore expected to ask for clearer proof around fabric choice and post-event handling.
- Rapid graphic refresh: Campaign changes are anticipated to increase demand for structures that accept new artwork without a full rebuild. The advantage is strongest when replacement graphics fit the same frame consistently.
- Demand for large seamless backdrops: Large visual surfaces are expected to support event photography and sponsor visibility. Providers that control fabric stretch and installation sequence are expected to gain stronger approval from event planners.
Opportunity Impact Analysis
| OPPORTUNITY | (~) % IMPACT ON CAGR | GEOGRAPHIC RELEVANCE | IMPACT TIMELINE |
|---|---|---|---|
| Recycled textile programs | +0.9% | China and UAE | Short term (<= 2 years) |
| Acoustic fabric integration | +0.6% | USA and UK | Medium term (2-4 years) |
| Standard frame libraries | +0.4% | Germany and Japan | Medium term (2-4 years) |
Source: Fact.MR analysis. Updated Jul 28, 2026
- Recycled textile programs: Recycled fabric options are expected to appeal where exhibitors want lower-waste event assets. This route works only when print quality and fit remain stable after the material choice changes.
- Acoustic fabric integration: Acoustic fabrics are expected to extend display-wall value in meeting zones and enclosed event spaces. The use case works best when sound control does not weaken graphic finish or frame tension.
- Standard frame libraries: Shared frame sizes are expected to make replacement graphics easier to plan. This supports repeat orders because customers can refresh messaging without redesigning the full structure.
Restraints Impact Analysis
| RESTRAINT | (~) % IMPACT ON CAGR | GEOGRAPHIC RELEVANCE | IMPACT TIMELINE |
|---|---|---|---|
| Wrinkling and fit variation | -0.9% | Global | Short term (<= 2 years) |
| Print color consistency | -0.7% | Cost-sensitive regional markets | Medium term (2-4 years) |
| Frame stress from incorrect tension | -0.5% | Highly regulated venues | Short term (<= 2 years) |
Source: Fact.MR analysis. Updated Jul 28, 2026
- Wrinkling and fit variation: Adoption is expected to slow when fabric panels arrive creased or fail to align with the frame. Clear inspection steps and packing guidance reduce this risk.
- Print color consistency: Repeat orders are expected to face review when new graphics do not match earlier campaign materials. Providers need color checks that cover artwork files and fabric type.
- Frame stress from incorrect tension: Incorrect stretching is expected to create installation delays and damage risk. Customers are likely to favor systems with clear tension limits and service support.
Which countries are scaling Tension Fabric Displays Market fastest?
The country comparison is defined by how event calendars and service depth translate into repeatable display use. UAE form the upper pair because customers in those markets need fast-moving event assets and reliable installation support. USA and Japan create the middle cluster through measured procurement and compact event setups. UK and Germany remain slightly lower because recurring shows require durable systems and disciplined documentation.
- UAE remains close to China as international venues need fast setup and dependable local support.
- USA aligns with the global rate through procurement that compares event assets with measurable objectives and repeat-use economics.
- Japan holds a measured position where compact booth layouts reward clean fabric fit and careful packing.
- UK demand is supported by recurring exhibitions where rental and graphic replacement programs create steady use cases.
- Germany remains technically demanding since trade-fair customers expect durable frames and precise graphic presentation.
Comparable CAGRs can therefore produce different market entry conditions across these countries. Deployment timing depends on installation evidence and local service depth. Commercial readiness also reflects graphic care and frame compatibility.
The full report provides country-level CAGR analysis across North America and Latin America. It also covers Europe and East Asia with South Asia, Oceania and the Middle East and Africa.
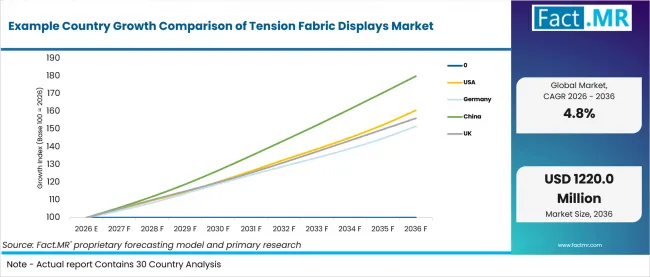
Example Country Growth Comparison Of Tension Fabric Displays Market | Source: Fact.MR
| Country | CAGR (2026-2036) |
|---|---|
| UAE | 5.5% |
| USA | 4.8% |
| Japan | 4.7% |
| UK | 4.5% |
| Germany | 4.2% |
Source: Fact.MR analysis. Updated Jul 28, 2026
How is UAE scaling demand?
5.5% CAGR, driven by high event throughput and international exhibitor needs.
The UAE’s outlook is tied to venues that host international exhibitors and fast-turnaround event programs. Customers are expected to value tension fabric displays that arrive clean and assemble quickly. Local service depth remains important when contractors and brand teams work on short timelines.
What is driving USA growth from 2026 to 2036?
4.8% CAGR, backed by measurement-led exhibitor procurement.
USA demand is shaped by customers that compare event assets against lead capture and repeated use. Tension fabric displays fit programs that need portable walls and frequent graphic changes. Providers are expected to compete through documentation and reliable replacement graphics.
How is Japan developing demand?
4.7% CAGR, tied to compact systems and reliable operation.
Japan’s growth reflects careful event execution and a preference for clean presentation within limited booth space. Compact tube-frame displays and dye-sublimated fabric graphics suit customers that need a polished appearance without heavy site work. Repeat demand is expected to depend on storage discipline and installation accuracy.
How does UK perform?
4.5% CAGR, led by recurring exhibitions and managed display services.
UK demand is supported by repeat exhibitors that need flexible backdrops and graphic replacement support. Rental and hybrid service formats remain useful for customers with changing booth sizes. Providers gain relevance when they coordinate artwork and venue setup.
What supports Germany growth?
4.2% CAGR, backed by technically demanding trade-fair use.
Germany’s growth reflects a mature trade-fair environment where display quality and installation discipline receive close attention. Customers are expected to evaluate tension fabric systems through frame durability and precise graphics. The market rewards providers that prevent fit variation before the event opens.
Who leads the Tension Fabric Displays Market?
Moss and Orbus Visual Communications show the direct relevance. Skyline Exhibits and Testrite Visual extend the competitive field through portable exhibits and modular display systems. Ultima Displays completes the provider set through fabric systems and display walls.
Moss supports tension fabric structures for branded environments and event programs. Orbus Visual Communications contributes tension fabric display lines such as portable backwalls and fabric structures. Skyline Exhibits adds exhibit systems and fabric graphic support for trade show booths. Testrite Visual is relevant through tension fabric structures and SEG display hardware. Ultima Displays completes the provider set with fabric systems and portable display walls.
Through 2036, suppliers are likely to compete on print accuracy, rapid production, and the ability to handle varied event formats. Fast artwork approval and dependable delivery will matter when exhibitors work with short campaign schedules. Providers that combine strong textile printing with adaptable frame options and responsive on-site support may secure more repeat business.
Which companies are the key providers?
Key companies include Moss; Orbus Visual Communications; Skyline Exhibits; Testrite Visual; Ultima Displays.
- Moss
- Orbus Visual Communications
- Skyline Exhibits
- Testrite Visual
- Ultima Displays
Bibliography
- U.S. Bureau of Economic Analysis. (2025, April 2). Arts and Cultural Production Satellite Account, U.S. and states, 2023.
- Department for Culture, Media and Sport. (2025, November 27). DCMS economic estimates: Business demographics, 2025-Main report. Government of the United Kingdom.
- Government of Dubai Media Office. (2026, April 7). DWTC welcomes nearly 3 million participants in 2025, reinforcing Dubai’s position as a leading global business destination.
This Report Answers
- The report provides strategic intelligence on the Tension Fabric Displays Market across Product Form and Frame Profile choices that shape event display purchasing decisions.
- Segment analysis covers Backdrop walls and Tube frames as the share leaders within the 2026 market. The report separates temporary event displays from retail signage when store fixtures do not involve event deployment.
- Country outlook evaluates China and UAE alongside USA and Japan. UK and Germany complete the growth comparison across the profiled markets.
- Competitive analysis profiles Moss and Orbus Visual Communications alongside Skyline Exhibits and Testrite Visual. Ultima Displays completes the provider set. The analysis separates fabric event systems from interactive displays when screens are not sold with a tension fabric frame.
- Use-case assessment covers display devices used for events when smooth fabric tension and replacement graphics shape the purchase.
What does the Tension Fabric Displays Market cover?
Display structures stretch printed textile graphics across lightweight frames for event and brand environments where graphic fit and repeatable setup determine commercial value.
The Tension Fabric Displays Market covers tube frames and SEG frames used with tensioned printed fabric as complete display products. Coverage includes backdrop walls and fabric towers. Hanging signs and counters complete the core product-form scope with curved display frames. Dye sublimation and UV textile printing are included when they support the finished display product. Latex and transfer printing follow the same rule.
The market differs from broader event equipment because the boundary is defined by the product’s display function. General banners and loose drape remain outside the valuation. Printing services without a display frame and floor POP displays are excluded unless they are delivered as a covered tension fabric display system.
What is included in the scope?
Tension fabric display systems are used across trade shows and brand activations. Corporate events and retail pop-ups are included when the product is used for temporary event presentation.
The scope includes Product Form and Frame Profile along with Print Method, Event Type and Reuse Frequency. Coverage spans backdrop walls and fabric towers. Hanging signs and counters complete the product-form scope with kiosks and curved display frames. It includes tube frames and extrusion frames. SEG frames and collapsible pop-up frames fall within the same boundary. Reuse frequency ranges from 1-2 events to long-term installations.
What is excluded from the scope?
General banners and loose drape remain outside the scope of this market. Printing services without a display frame and permanent architectural fabric are excluded. Coated fabrics sold as raw material remain outside the scope unless they are delivered within a complete display product.
The scope excludes unrelated venue construction and general event management. It also excludes floor-space rental and services that do not deliver the defined product function. Digital signage systems are excluded unless they are integrated into the covered tension fabric display product.
How Was the Analysis Built?
The analysis draws on 120+ sources, 35+ company portfolios, 25+ countries, and more than 20 industry interviews.
- Primary Research: Primary research includes discussions with manufacturers, service providers, technology developers, distributors, end users, procurement teams, and subject-matter experts. These conversations examine purchasing priorities, product adoption, operational challenges, approval requirements, competitive positioning, and the factors that influence wider market acceptance.
- Desk Research: Desk research covers government statistics, regulatory publications, company filings, trade data, technical studies, industry associations, standards, public policy, and other authoritative sources. Every source used in the analysis is documented in the bibliography.
- Market Sizing and Forecasting: Market estimates combine historical performance, demand indicators, pricing and volume trends, segment shares, company participation, country-level growth, adoption patterns, investment activity, and barriers to market expansion.
- Data Validation and Update Cycle: Findings are validated by comparing primary interviews with public data, company activity, regulatory changes, trade patterns, and industry developments. Regular updates review new product launches, capacity changes, partnerships, approvals, procurement trends, and shifts in commercial adoption.
Segmentation
What is the report’s scope and coverage?
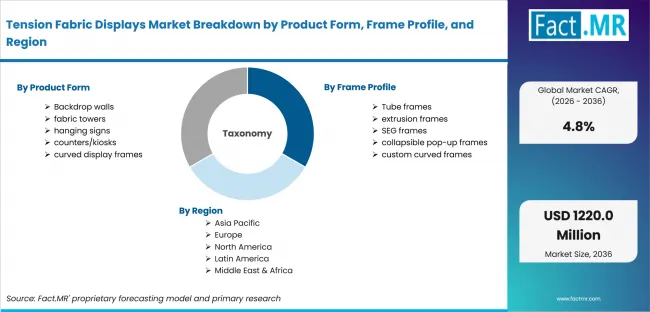
Tension Fabric Displays Market Breakdown By Product Form, Frame Profile, And Region | Source: Fact.MR
| Attribute | Details |
|---|---|
| Quantitative Units | USD million in 2026 to USD million by 2036 at CAGR |
| Market Definition | Display structures that stretch printed textile graphics across lightweight frames for event and brand environments when delivered as a commercial event solution. |
| Product Form | Backdrop walls; fabric towers; hanging signs; counters/kiosks; curved display frames |
| Frame Profile | Tube frames; extrusion frames; SEG frames; collapsible pop-up frames; custom curved frames |
| Print Method | Dye sublimation; UV textile printing; latex printing; direct-to-fabric; transfer printing |
| Event Type | Trade shows; brand activations; corporate events; retail pop-ups; museum/experience installs |
| Reuse Frequency | 1-2 events; 3-5 events; 6-10 events; seasonal programs; long-term installations |
| Regions Covered | North America; Latin America; Europe; East Asia; South Asia & Oceania; Middle East & Africa |
| Countries Covered | USA; Canada; Brazil; Mexico; Germany; U.K.; France; Italy; Spain; South Korea; Japan; Australia & New Zealand; GCC Countries; South Africa; UAE |
| Key Companies Profiled | Moss; Orbus Visual Communications; Skyline Exhibits; Testrite Visual; Ultima Displays |
| Forecast Period | 2026 to 2036 |
| Approach | Hybrid top-down and bottom-up approach using product-form demand; frame-profile selection; print-method use; event-type demand; reuse frequency; country growth; company participation; adoption barriers and service-depth review. |
Source: Fact.MR analysis. Updated Jul 28, 2026
How is the market segmented?
-
By Product Form:
- Backdrop walls
- fabric towers
- hanging signs
- counters/kiosks
- curved display frames
-
By Frame Profile:
- Tube frames
- extrusion frames
- SEG frames
- collapsible pop-up frames
- custom curved frames
-
By Print Method:
- Dye sublimation
- UV textile printing
- latex printing
- direct-to-fabric
- transfer printing
-
By Event Type:
- Trade shows
- brand activations
- corporate events
- retail pop-ups
- museum/experience installs
-
By Reuse Frequency:
- 1-2 events
- 3-5 events
- 6-10 events
- seasonal programs
- long-term installations
-
By Region:
- North America
- USA
- Canada
- Latin America
- Brazil
- Mexico
- Rest of Latin America
- Europe
- Germany
- U.K.
- France
- Italy
- Spain
- Rest of Europe
- East Asia
- South Korea
- Japan
- China
- South Asia & Oceania
- India
- Australia & New Zealand
- Rest of South Asia & Oceania
- Middle East & Africa
- GCC Countries
- South Africa
- UAE
- Rest of Middle East & Africa
- North America
Frequently Asked Questions
Which Product Form leads the market?
Which Frame Profile leads the market?
Which Print Method leads the market?
Which Event Type leads the market?
Which Reuse Frequency leads the market?
Which country records the highest listed CAGR?
What is the primary driver in this market?
What is the main restraint?
Why does backdrop wall lead demand?
Who worked on this report


Preview the report firsthand - request a free sample
Free SampleGet the brochure for pricing and purchase details
Download PDF