- Market Value (2025): USD 290.8 Mn
- Estimated Value (2026): USD 315.0 Mn
- Forecast Value (2036): USD 700.0 Mn
- CAGR (2026-2036): 8.3%
What is the Touchscreen Event Kiosks Market forecast to be worth by 2036?
USD 315.0 million in 2026 to USD 700.0 million by 2036 at 8.3% CAGR.
- The touchscreen event kiosks market reached USD 290.8 million in 2025 as event organizers placed more weight on faster check-in and lower registration staffing.
- Demand is projected to increase from USD 315.0 million in 2026 to USD 700.0 million by 2036.
- The market is forecast to record 8.3% CAGR from 2026 to 2036 owing to integrated badge printing and venue wayfinding requirements that turn registration into a repeatable workflow.
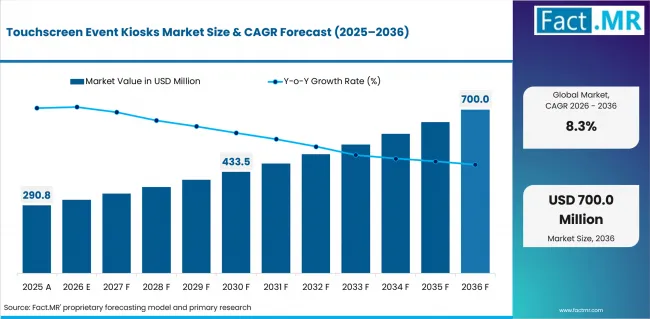
Touchscreen Event Kiosks Market Value Analysis | Source: Fact.MR
What are the defining numbers behind Touchscreen Event Kiosks Market growth?
USD 385.0 million absolute opportunity by 2036, led by Self-check-in and Freestanding kiosk formats alongside Registration platforms and Rental fleet deployment.
- Demand Drivers in the Market
- Faster attendee check-in is expected to make self-check-in kiosks a defined event requirement. Event operators approve the purchase when the kiosk can complete registration lookup and badge issue during peak arrivals. The value is easier to defend when support staff handle only exceptions.
- Lower registration staffing is anticipated to strengthen demand where organizers need more arrivals processed by the same floor team. Rental providers can position configured kiosks as a labor-control tool. The package still needs setup support and clear escalation rules.
- Integrated badge printing is projected to raise adoption because the badge becomes part of the same check-in step. The segment benefits when printers and registration records stay synchronized during peak periods. This lowers the chance that attendees are sent to another counter.
- Venue wayfinding demand is expected to widen use beyond registration desks. Large venues can route attendees to halls and sessions through the same terminal. The value improves when the screen keeps visitors moving after the badge is printed.
- Key Segments Analyzed
- By Kiosk Function: Self-check-in is expected to hold 32.0% share in 2026 because it handles the first attendee interaction. The segment gains preference when it connects registration lookup with badge output.
- By Hardware Format: Freestanding kiosk is projected to account for 35.0% share in 2026 as it fits temporary show entrances. Its value is clearest where a floor-ready unit can be placed without built-in counters.
- By Integration: Registration platforms are anticipated to capture 34.0% share in 2026 since they keep attendee records and badge rules in one workflow. This reduces manual correction after the show opens.
- By Deployment: Rental fleet is estimated to represent 38.0% share in 2026 due to the project-based nature of exhibitions. Organizers gain hardware access and removal without owning idle equipment after the event.
- By End Event: Trade shows are forecast to hold 31.0% share in 2026 as exhibitor traffic creates the clearest arrival pressure. The format requires fast badge issue and routing at the start of each show day.
- Analyst Opinion at Fact.MR
- Shambhu Nath Jha, Senior Analyst at Fact.MR, states, “Touchscreen event kiosks are purchased on operating proof before hardware design. Event operators need to know how the unit performs when badge stock or network access creates a queue. Clear recovery steps reduce the risk of an event-day failure.”
- Strategic Implications
- Event operators need to test the full attendee journey before the show begins. The check includes registration lookup, badge printing, offline access, and staff support. Early testing helps resolve problems before queues build.
- Kiosk providers benefit from listing hardware, software, and field support separately in each quote. This gives customers a clear view of equipment costs and event-day service.
- Venue and agency operators must assign uptime responsibility before one package is used across several clients. Replacement arrangements also require confirmation before setup. Clear ownership reduces disruption when several contractors manage the same check-in process.
The UAE follows with a forecast CAGR of 9.0% during the same period. The USA is expected to expand at an 8.3% CAGR, while Japan is anticipated to post an 8.2% CAGR. The United Kingdom is estimated to grow at an 8.0% CAGR. Germany is projected to advance at a 7.7% CAGR from 2026 to 2036.
How does the Touchscreen Event Kiosks Market break down by segment?
Self-check-in is expected to lead Kiosk Function at 32.0% share. Freestanding kiosk is projected to lead Hardware Format at 35.0% share in 2026.
Why does Self-check-in lead Kiosk Function?
Self-check-in is projected to account for 32.0% share in 2026.
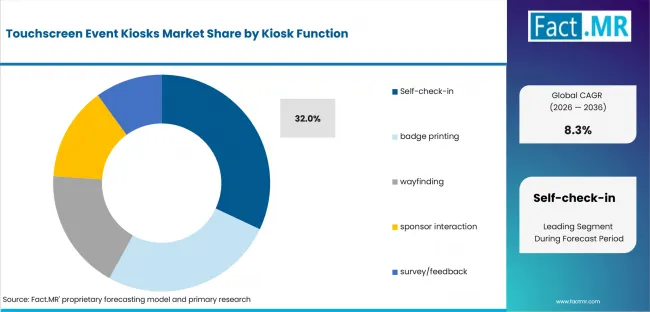
Touchscreen Event Kiosks Market Analysis By Kiosk Function | Source: Fact.MR
The function addresses the main reason organizers install kiosks: reducing dependence on staffed counters. Attendees can retrieve their registration and collect a badge in one short process. This helps venues absorb sudden arrival spikes without adding the same number of temporary staff. Its value is strongest at events where thousands of visitors enter within a narrow time window.
Why does Freestanding kiosk lead Hardware Format?
Freestanding kiosk is expected to hold 35.0% share in 2026.
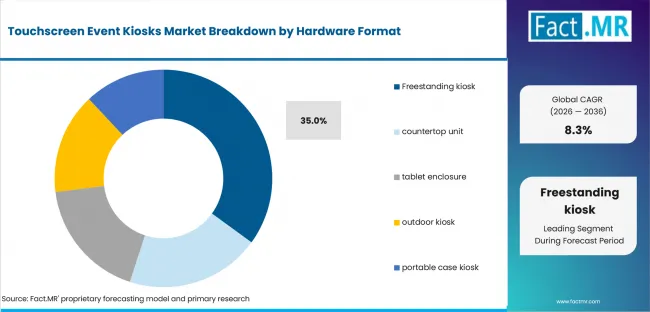
Touchscreen Event Kiosks Market Analysis By Hardware Format | Source: Fact.MR
Mobility gives freestanding kiosks an advantage across temporary event layouts. Units can be positioned near entry gates, sponsor areas, or overflow zones as traffic patterns change. Organizers also avoid permanent installation work and can reuse the same hardware at different venues. This flexibility supports rental companies that manage equipment across several events each month.
Why do Registration platforms lead Integration?
Registration platforms are anticipated to lead with 34.0% share in 2026.
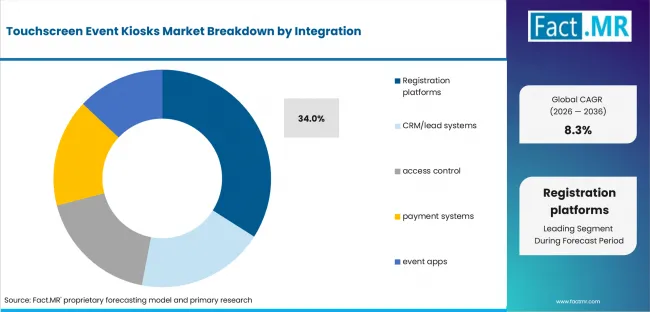
Touchscreen Event Kiosks Market Analysis By Integration | Source: Fact.MR
Registration integration connects the kiosk directly with attendee profiles, ticket categories, and badge permissions. Accurate data exchange prevents duplicate records and reduces manual checks at the entrance. It also allows late registrations or profile changes to appear at the kiosk without separate updates. This makes the integration essential for maintaining a consistent check-in record across online and on-site channels.
Why does Rental fleet lead Deployment?
Rental fleet is estimated to represent 38.0% share in 2026.
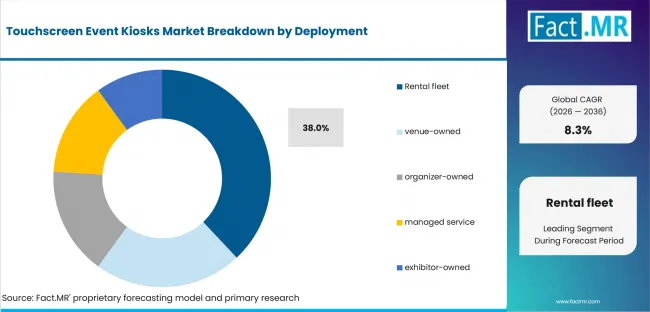
Touchscreen Event Kiosks Market Analysis By Deployment | Source: Fact.MR
Many exhibitions require kiosks for only a few days, making ownership difficult to justify. Rental fleets convert hardware spending into an event-based operating cost and give organizers access to extra units when attendance rises. Delivery, installation, testing, and collection may also be included in the package. This arrangement suits agencies that run events in different cities and need equipment only when a project is active.
Why do Trade shows lead End Event?
Trade shows are forecast to hold 31.0% share in 2026.
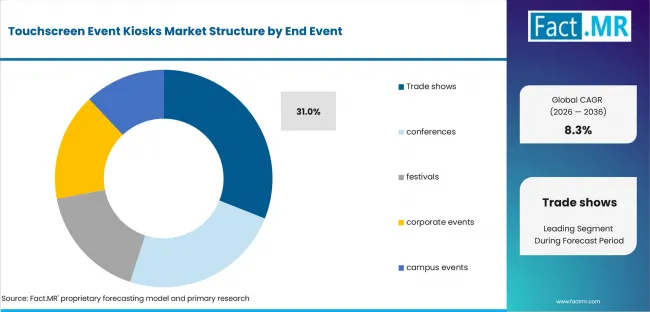
Touchscreen Event Kiosks Market Analysis By End Event | Source: Fact.MR
Trade shows create complex entry conditions because exhibitors, buyers, media visitors, and service staff often use different badge types. Kiosks help manage these categories while keeping registration desks available for exceptions. They also support reprinting when badges are lost or details change during the event. Strong opening-day traffic and repeated attendee movement make automated check-in especially useful in this setting.
What is accelerating Touchscreen Event Kiosks Market adoption, and what is holding it back?
Faster attendee check-in is expected to remain the primary demand catalyst. Adoption is expected to be held back by printer and peripheral failure when service ownership is unclear.
Drivers Impact Analysis
| DRIVER | (~) % IMPACT ON CAGR | GEOGRAPHIC RELEVANCE | IMPACT TIMELINE |
|---|---|---|---|
| Faster attendee check-in | +2.2% | Mature exhibition markets | Short term (<=2 years) |
| Lower registration staffing | +1.7% | Global | Short term (<=2 years) |
| Integrated badge printing | +1.3% | North America and Europe | Medium term (2-4 years) |
| Venue wayfinding demand | +0.9% | China and UAE | Medium term (2-4 years) |
Source: Fact.MR analysis. Updated Jul 28, 2026
- Faster attendee check-in: Self-check-in kiosks are expected to shorten the registration lane when attendee lookup and badge output happen in one place. The benefit is strongest where operators measure transaction time before repeating the setup across several shows.
- Lower registration staffing: Labor pressure is expected to move kiosk approval from a convenience purchase to a staffing decision. Organizers still need trained support nearby because exception handling remains part of the arrival plan.
- Integrated badge printing: On-demand badge production is anticipated to reduce pre-print waste and make late registration easier to absorb. The mechanism works only when printer stock and attendee records remain synchronized.
- Venue wayfinding demand: Wayfinding is projected to extend kiosk use after check-in. It becomes more valuable when the screen helps visitors find halls and sessions without another staffed question point.
Opportunity Impact Analysis
| OPPORTUNITY | (~) % IMPACT ON CAGR | GEOGRAPHIC RELEVANCE | IMPACT TIMELINE |
|---|---|---|---|
| Multilingual workflow templates | +1.5% | USA and UK | Short term (<=2 years) |
| Portable kiosk fleets | +1.1% | Germany and Japan | Medium term (2-4 years) |
| Identity and access integration | +0.7% | China and UAE | Medium term (2-4 years) |
Source: Fact.MR analysis. Updated Jul 28, 2026
- Multilingual workflow templates: Multilingual templates are expected to improve utilization at international events where attendees need the same transaction in different languages. Providers gain service value when translations are tested before the event opens.
- Portable kiosk fleets: Portable fleets are projected to expand where organizers run several events across different venues. The case is strongest when transport and spare-unit access are included in the booking.
- Identity and access integration: Identity and access integration is expected to deepen adoption at events with controlled zones or paid sessions. Approval depends on accurate permissions and a secure handoff between the kiosk and access-control process.
Restraints Impact Analysis
| RESTRAINT | (~) % IMPACT ON CAGR | GEOGRAPHIC RELEVANCE | IMPACT TIMELINE |
|---|---|---|---|
| Printer and peripheral failure | -1.6% | Cost-sensitive regional markets | Short term (<=2 years) |
| Registration-system integration risk | -1.2% | Highly regulated venues | Medium term (2-4 years) |
| Queue transfer without queue removal | -0.8% | Global | Short term (<=2 years) |
Source: Fact.MR analysis. Updated Jul 28, 2026
- Printer and peripheral failure: Printer faults are expected to remain the most visible adoption barrier because a stopped badge line is immediately public. Operators reduce the risk through spare printers and clear replacement ownership.
- Registration-system integration risk: Integration risk increases when registration records and kiosk software are managed by different vendors. The issue can delay rollout unless the data handoff is tested with real attendee records.
- Queue transfer without queue removal: Kiosks may move the bottleneck from staff desks to self-service stations if layouts are poorly planned. Operators need floor guidance and exception lanes to prevent that shift.
Which countries are scaling Touchscreen Event Kiosks Market fastest?
The country comparison is defined more by operating requirements than by the CAGR ranking alone. China and UAE track above the 8.3% global rate. The remaining listed countries form a lower group that still has clear demand. The pattern reflects event calendars and service expectations.
- UAE ranks second as international event traffic places more pressure on fast setup and controlled visitor movement. Premium venues need visible service quality from opening hour. Kiosks fit best when field support is ready on site.
- USA matches the global CAGR because event operators already use established registration systems. Customers usually require measurable operating proof before adding hardware. The purchase case improves when uptime and recovery are clear.
- Japan grows slightly below the global rate but compact venue layouts make reliability a recurring purchase test. Smaller entry points expose weak placement decisions quickly. Freestanding systems must keep the queue moving without crowding the front area.
- UK remains close to Japan as recurring exhibitions create demand for flexible workflow templates. Organizers benefit when one check-in format can be reused across shows. Badge edits and exceptions still need support at the venue.
- Germany records the lowest listed CAGR because documentation and contractor routines can slow approval. The trade-fair base remains deep. Providers need clear operating evidence before customers use one package across several venues.
Comparable CAGRs can therefore lead to different market entry conditions across these countries. Deployment timing depends on setup speed and software compatibility. Commercial readiness depends on whether the kiosk removes an arrival problem or shifts it to another line.
The full report provides country-level CAGR analysis across North America; Latin America; Europe; East Asia; South Asia & Oceania; and the Middle East & Africa.
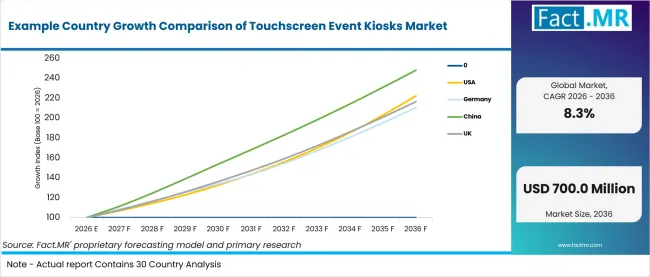
Example Country Growth Comparison Of Touchscreen Event Kiosks Market | Source: Fact.MR
| Country | CAGR (2026-2036) |
|---|---|
| UAE | 9.0% |
| USA | 8.3% |
| Japan | 8.2% |
| UK | 8.0% |
| Germany | 7.7% |
Source: Fact.MR analysis. Updated Jul 28, 2026
Why is the UAE emerging as a high-growth event kiosk market?
9.0% CAGR, driven by rapid event turnover and international participation.
The UAE market places strong weight on speed because venues often serve international audiences under tight opening schedules. Operators favor kiosks that can be installed quickly, configured for multiple languages, and supported during concentrated arrival periods. Demand also benefits from frequent business events, conferences, and rotating exhibitions. Identity and access integration becomes useful when it protects service flow without creating another approval step. Reliable on-site support remains important when event turnover leaves little room for technical delays.
What keeps the USA on a steady adoption path?
8.3% CAGR, backed by measurement-led procurement and established registration platforms.
USA demand reflects a mature event technology base where customers compare check-in results across recurring shows, conferences, and corporate events. Kiosks must integrate with established registration platforms and provide measurable evidence of uptime, transaction speed, and issue resolution. Buyers also look for flexible software that supports badge changes, multilingual templates, and remote monitoring. Adoption is strongest when providers can demonstrate lower staffing pressure at entry points without adding complexity to existing event systems or reporting processes.
Where does Japan gain an advantage in event check-in systems?
8.2% CAGR, led by compact systems and reliable operation.
Japanese demand is shaped by compact venue entrances, disciplined operating routines, and strong expectations for predictable service. Freestanding and tablet-based systems must deliver stable workflows without crowding reception areas or disrupting attendee movement. Providers often need to prove hardware reliability, printing accuracy, and simple staff controls before wider deployment. Growth is also supported by business events that value orderly access. Full attendee-journey testing under peak load helps reduce visible failures during tightly managed opening periods.
How are recurring events shaping demand in the UK?
8.0% CAGR, supported by recurring exhibitions and flexible visitor workflows.
The UK growth path reflects steady use of exhibitions, conferences, and business events that require repeatable arrival management. Kiosk adoption becomes more credible when organizers can reuse registration templates across multiple shows and venues. Stronger demand also comes from agencies that manage changing attendee volumes and short setup windows. The most competitive offers combine self-check-in with badge edits, exception handling, and remote support. This flexibility helps operators maintain service quality without expanding temporary staffing for every event.
Why does Germany remain important for advanced kiosk deployment?
7.7% CAGR, driven by an international and technically demanding trade-fair base.
Germany’s outlook is shaped by an established trade-fair network, international visitor flows, and demanding documentation standards. Kiosk providers must align with venue rules, contractor processes, and data-handling requirements before large-scale rollout. Customers often assess operational evidence such as uptime records, badge accuracy, and recovery procedures before selecting a reusable platform. Demand is strongest where systems support multilingual registration and complex exhibitor categories. These requirements favor suppliers with proven integration capability rather than one-event hardware packages.
Who leads the Touchscreen Event Kiosks Market?
Elo Touch Solutions and Meridian Kiosks show the direct relevance to touchscreen event kiosks. KIOSK Information Systems, Olea Kiosks and Pyramid Computer extend the provider field through self-service hardware and custom kiosk engineering.
Elo Touch Solutions provides touchscreen hardware for self-service check-in systems. Meridian Kiosks supports visitor registration and badge-printing applications. KIOSK Information Systems develops customized kiosk setups for demanding event environments. Olea Kiosks brings experience in check-in and registration kiosk design. Pyramid Computer supplies hardware used for visitor identification and access management.
Competition through 2036 will center on dependable performance and easy connection with registration software. Buyers will review support quality, printer recovery, and system response before expanding deployments. Suppliers with reliable service teams and proven event experience are likely to perform better in rental and managed-service contracts.
Which companies are the key providers?
Key companies include Elo Touch Solutions; Meridian Kiosks; KIOSK Information Systems; Olea Kiosks; and Pyramid Computer.
- Elo Touch Solutions
- Meridian Kiosks
- KIOSK Information Systems
- Olea Kiosks
- Pyramid Computer
Bibliography
- National Institute of Standards and Technology. (2025, August 1). NIST SP 800-63A-4: Digital identity guidelines—Identity proofing and enrollment.
- U.S. Customs and Border Protection. (2025, May 21). Chicago CBP and Chicago Department of Aviation introduce updated technology to eliminate long lines at ORD.
- Immigration & Checkpoints Authority. (2025, March 27). Full implementation of QR code clearance at the land checkpoints. Government of Singapore.
- Government of the Hong Kong Special Administrative Region. (2026, February 4). LCQ9: Attracting visitors to spend in Hong Kong.
- KIOSK Information Systems. (2025, April 26). Kiosk placement for a successful deployment.
This Report Answers
- The report provides strategic intelligence on the touchscreen event kiosks market across Kiosk Function and Hardware Format choices that shape purchasing decisions.
- Segment analysis covers Self-check-in and Freestanding kiosk as the share leaders within the 2026 market.
- Country outlook evaluates UAE alongside USA and Japan. UK and Germany complete the growth comparison across the profiled markets.
- Competitive analysis profiles Elo Touch Solutions and Meridian Kiosks alongside KIOSK Information Systems, Olea Kiosks and Pyramid Computer.
- Use-case assessment covers self-check-in and badge printing. Wayfinding and sponsor interaction complete the event-use view alongside survey workflows.
What does the Touchscreen Event Kiosks Market cover?
Self-service event terminals handle check-in and badge production. They also support directions and attendee transactions.
The Touchscreen Event Kiosks Market covers kiosk hardware and software used inside event-arrival workflows. Coverage includes enclosures; touchscreens; printers; scanners; and registration connections when they are delivered as a configured event solution. Portable terminals are included only when they are used inside event-registration workflows.
The market differs from broader kiosk categories because commercial value comes from managing temporary event flow. Permanent retail and government transactions remain outside the boundary. Smart city kiosk networks are outside scope unless a venue uses the same terminal for event check-in or visitor guidance.
What is included in the scope?
Touchscreen event kiosk systems are used across exhibitions and conferences. Festivals, corporate events and campus events are included.
The scope includes Kiosk Function and Hardware Format alongside Integration, Deployment and End Event. Coverage spans self-check-in; badge printing; wayfinding; sponsor interaction; and survey or feedback workflows. Registration platforms and access-control integrations follow the same event-use rule.
What is excluded from the scope?
General retail kiosks, permanent government terminals and registration software sold without hardware remain outside this market.
The scope excludes unrelated venue construction and general event management. Floor-space rental is outside the boundary unless it includes the defined kiosk function. Broad interactive displays are excluded unless they are part of a kiosk used for attendee transactions.
How Was the Analysis Built?
The analysis draws on 120+ sources, 35+ company portfolios, 25+ countries, and more than 20 industry interviews.
- Primary Research: Primary research includes discussions with manufacturers, service providers, technology developers, distributors, end users, procurement teams, and subject-matter experts. These conversations examine purchasing priorities, product adoption, operational challenges, approval requirements, competitive positioning, and the factors that influence wider market acceptance.
- Desk Research: Desk research covers government statistics, regulatory publications, company filings, trade data, technical studies, industry associations, standards, public policy, and other authoritative sources. Every source used in the analysis is documented in the bibliography.
- Market Sizing and Forecasting: Market estimates combine historical performance, demand indicators, pricing and volume trends, segment shares, company participation, country-level growth, adoption patterns, investment activity, and barriers to market expansion.
- Data Validation and Update Cycle: Findings are validated by comparing primary interviews with public data, company activity, regulatory changes, trade patterns, and industry developments. Regular updates review new product launches, capacity changes, partnerships, approvals, procurement trends, and shifts in commercial adoption.
Segmentation
What is the report’s scope and coverage?
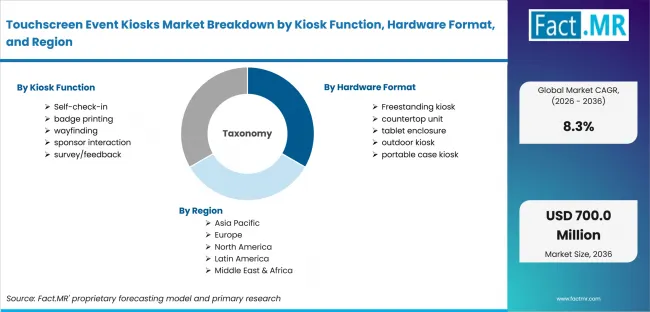
Touchscreen Event Kiosks Market Breakdown By Kiosk Function, Hardware Format, And Region | Source: Fact.MR
| Attribute | Details |
|---|---|
| Quantitative Units | USD million in 2026 to USD million by 2036 at CAGR |
| Market Definition | Self-service event terminals used for check-in, badge production, directions and attendee transactions when delivered as a commercial event solution |
| Kiosk Function | Self-check-in; Badge printing; Wayfinding; Sponsor interaction; Survey/feedback |
| Hardware Format | Freestanding kiosk; Countertop unit; Tablet enclosure; Outdoor kiosk; Portable case kiosk |
| Integration | Registration platforms; CRM/lead systems; Access control; Payment systems; Event apps |
| Deployment | Rental fleet; Venue-owned; Organizer-owned; Managed service; Exhibitor-owned |
| End Event | Trade shows; Conferences; Festivals; Corporate events; Campus events |
| Regions Covered | North America; Latin America; Europe; East Asia; South Asia & Oceania; Middle East & Africa |
| Countries Covered | UAE; USA; Japan; UK; Germany |
| Key Companies Profiled | Elo Touch Solutions; Meridian Kiosks; KIOSK Information Systems; Olea Kiosks; Pyramid Computer |
| Forecast Period | 2026 to 2036 |
| Approach | Hybrid top-down and bottom-up approach using event-kiosk demand; check-in workflows; badge printing requirements; hardware format adoption; integration needs; rental activity; end-event demand; country adoption patterns and company portfolio review |
Source: Fact.MR analysis. Updated Jul 28, 2026
How is the market segmented?
-
By Kiosk Function:
- Self-check-in
- Badge printing
- Wayfinding
- Sponsor interaction
- Survey/feedback
-
By Hardware Format:
- Freestanding kiosk
- Countertop unit
- Tablet enclosure
- Outdoor kiosk
- Portable case kiosk
-
By Integration:
- Registration platforms
- CRM/lead systems
- Access control
- Payment systems
- Event apps
-
By Deployment:
- Rental fleet
- Venue-owned
- Organizer-owned
- Managed service
- Exhibitor-owned
-
By End Event:
- Trade shows
- Conferences
- Festivals
- Corporate events
- Campus events
-
By Region:
- North America
- USA
- Canada
- Latin America
- Brazil
- Mexico
- Rest of Latin America
- Europe
- Germany
- U.K.
- France
- Italy
- Spain
- Rest of Europe
- East Asia
- South Korea
- Japan
- China
- South Asia & Oceania
- India
- Australia & New Zealand
- Rest of South Asia & Oceania
- Middle East & Africa
- GCC Countries
- South Africa
- UAE
- Rest of Middle East & Africa
- North America
Frequently Asked Questions
Which Kiosk Function leads the market?
Which Hardware Format leads the market?
Which Integration category leads the market?
Which Deployment leads the market?
Which End Event leads the market?
What is the primary driver in this market?
What is the main restraint?
Why does rental fleet lead demand?
Who worked on this report


Preview the report firsthand - request a free sample
Free SampleGet the brochure for pricing and purchase details
Download PDF