
Automotive Antifreeze Market Size, Market Forecast and Outlook By Fact.MR
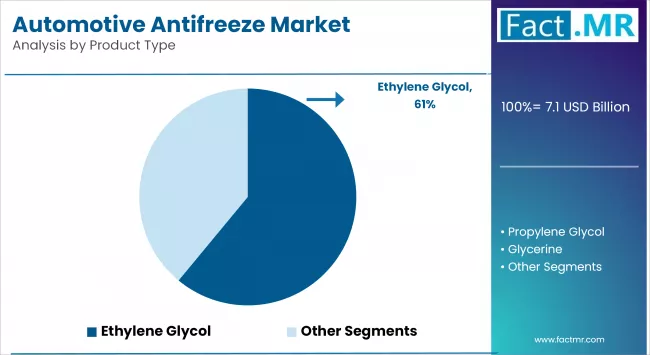
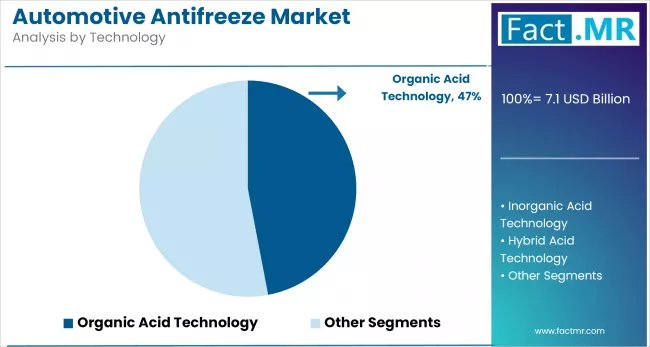
The global automotive antifreeze market was valued at USD 7.10 billion in 2025, projected to reach USD 7.58 billion in 2026, and is forecast to expand to USD 14.49 billion by 2036 at a 6.7% CAGR. Ethylene glycol holds 54.7% of the product type segment in 2026, reflecting its established position as the primary coolant base fluid across global automotive and commercial vehicle cooling systems where its well-understood corrosion inhibition chemistry, thermal properties, and production cost advantages over alternatives maintain its dominant formulation position. Organic Acid Technology commands 48.9% of the technology segment, as OAT formulations offering extended service life of five years or 150,000 kilometres versus the two-year service intervals of conventional Inorganic Additive Technology coolants have achieved strong OEM specification penetration in European and North American factory-fill applications.
The absolute dollar expansion of USD 6.91 billion over the forecast period reflects both volume growth from expanding vehicle fleets in emerging markets and per-unit value increases from the migration toward extended-life OAT and HOAT formulations that carry higher price points than conventional IAT coolants. Aftermarket channels account for 61.3% of sales, consistent with antifreeze as a periodic maintenance fluid purchased at scheduled service intervals across the vehicle ownership lifetime, generating consistent repeat purchase cycles from the global installed vehicle base. The emergence of electric vehicle thermal management as a new coolant application is creating a growth segment beyond conventional engine cooling, as EV battery packs and power electronics require dedicated thermal management fluid circuits with different chemical compatibility requirements than conventional engine coolants.
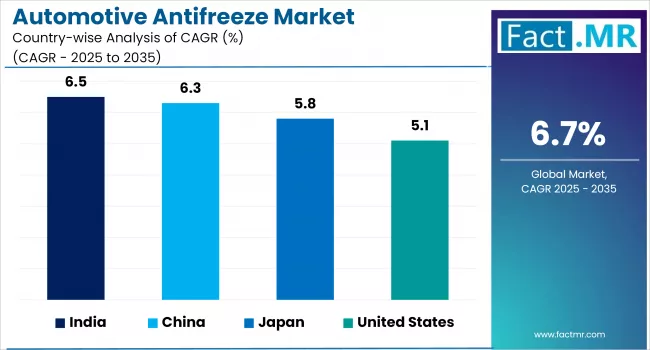
India leads country growth at 6.5% CAGR through 2036, driven by rapidly expanding vehicle ownership, improving vehicle maintenance awareness among first-time owners, and the growing proportion of vehicles using OAT and HOAT coolants that require periodic replacement at prescribed service intervals. China follows at 6.3% CAGR, supported by a large vehicle fleet spanning conventional and electric powertrains, with EV thermal management fluid demand adding a new coolant revenue stream alongside established engine cooling replacement volumes. Japan registers 5.8% CAGR, reflecting steady replacement demand from a large mature vehicle fleet and Japanese OEM specification preference for high-performance HOAT formulations in domestic market vehicles. The United States advances at 5.1% CAGR, driven by the large vehicle parc replacement cycle and growing EV thermal management fluid demand from accelerating electric vehicle adoption.

Automotive Antifreeze Market Key Takeaways
| Metric | Details |
|---|---|
| Industry Size (2026) | USD 7.58 Billion |
| Industry Value (2036) | USD 14.49 Billion |
| CAGR (2026-2036) | 6.7% |
Automotive Antifreeze Market Definition
The automotive antifreeze market encompasses glycol-based coolant fluids formulated with corrosion inhibitor additive packages for automotive and commercial vehicle engine cooling systems, as well as battery thermal management and power electronics cooling circuits in electric and hybrid vehicles. The scope covers ready-to-use and concentrate coolant formulations across Inorganic Additive Technology, Organic Acid Technology, and Hybrid Organic Acid Technology chemistries supplied through OEM factory-fill and aftermarket maintenance channels.
Automotive Antifreeze Market Inclusions
Market scope includes ethylene glycol, propylene glycol, and glycerol-based antifreeze concentrates and pre-mixed ready-to-use coolant formulations for engine cooling, battery thermal management, and power electronics cooling applications. Geographic analysis covers North America, Latin America, Europe, East Asia, South Asia, Oceania, and Middle East and Africa. Forecast scope spans 2026 to 2036 with segment breakdowns by product type, technology, vehicle type, sales channel, and region.
Automotive Antifreeze Market Exclusions
Industrial process cooling fluids, data centre thermal management fluids, HVAC system refrigerants and heat transfer fluids for non-automotive applications, and windshield washer fluid formulations containing glycol as a freeze-point depressant but without automotive cooling system corrosion inhibitor packages fall outside this market scope. Coolant additive concentrates sold as supplemental treatments rather than complete coolant formulations are also excluded.
Automotive Antifreeze Market Research Methodology
- Primary Research: Fact.MR analysts conducted interviews with automotive lubricants and fluids category managers at oil company distribution networks, vehicle OEM coolant specification engineers, and aftermarket service chain buyers to validate OAT and HOAT adoption rates, EV thermal fluid specification trends, and pricing dynamics across passenger car and commercial vehicle maintenance segments.
- Desk Research: Secondary research incorporated coolant chemistry standard updates from ASTM International and SAE, OEM vehicle service interval documentation specifying coolant change frequencies, ethylene glycol commodity price data from chemical industry publications, and EV thermal management system specifications from vehicle manufacturer technical publications.
- Market-Sizing and Forecasting: Baseline market values derive from a bottom-up aggregation of coolant volume consumption by vehicle type, system fill volume per vehicle, and service interval replacement frequency, multiplied by average coolant prices across IAT, OAT, and HOAT formulation tiers. EV thermal management fluid volume growth was modeled as an incremental demand stream based on EV production forecasts and battery pack cooling fluid fill volume estimates.
- Data Validation and Update Cycle: Segment forecasts are cross-validated against revenue disclosures from publicly listed automotive fluids manufacturers and vehicle registration statistics from national transport registries. Annual updates incorporate ethylene glycol commodity price movements and updated EV production volume actuals affecting thermal management fluid demand projections.
Summary of Automotive Antifreeze Market
- Automotive Antifreeze Market Definition
- The automotive antifreeze market covers glycol-based coolant formulations across IAT, OAT, and HOAT technology chemistries for engine cooling, battery thermal management, and power electronics cooling in passenger and commercial vehicles, supplied through OEM factory-fill and aftermarket maintenance channels globally.
- Demand Drivers in the Market
- Extended-Life OAT Coolant OEM Specification Penetration: Progressive adoption of Organic Acid Technology factory-fill specifications by European and Asian vehicle manufacturers is increasing per-vehicle coolant revenue relative to conventional IAT formulations, as OAT concentrates carry higher unit prices and generate quality-assured aftermarket replacement demand when vehicle owners renew coolant to original equipment specification at service intervals.
- Electric Vehicle Battery Thermal Management Fluid Demand: Growing electric vehicle production is creating demand for dedicated battery cooling circuit fluids with chemical compatibility requirements specific to aluminium heat exchangers, polymer seals, and electrochemical components in battery pack thermal management systems, establishing a new coolant revenue category beyond conventional engine cooling that carries premium pricing relative to standard automotive antifreeze formulations.
- Vehicle Fleet Expansion in South and Southeast Asia: Rising vehicle ownership rates in India, Indonesia, Vietnam, and surrounding markets are expanding the total vehicle parc requiring periodic coolant maintenance, with first-time vehicle owners in tropical climate markets purchasing antifreeze primarily for corrosion protection rather than freeze protection, creating a large volume market for single-function corrosion inhibitor coolant formulations with different product specifications than cold-climate markets.
- Key Segments Analyzed in the Fact.MR Report
- Ethylene Glycol Product Type: Commands 54.7% share in 2026, maintaining its dominant position as the primary coolant base fluid through established corrosion inhibitor chemistry compatibility, thermal property advantages over propylene glycol alternatives, and production cost efficiency that sustains its OEM and aftermarket specification prevalence across global passenger car and commercial vehicle cooling systems.
- Organic Acid Technology: Holds 48.9% technology segment share in 2026, reflecting the OEM specification shift toward extended service life formulations that offer five-year replacement intervals versus two years for conventional IAT coolants, reducing vehicle maintenance visit frequency while generating higher per-replacement-event coolant revenue from the premium OAT product tier.
- Aftermarket Sales Channel: Accounts for 61.3% of 2026 market value, driven by the periodic replacement nature of antifreeze as a maintenance fluid that generates consistent repeat purchase events across the vehicle parc at prescribed service intervals, with aftermarket volume expanding proportionally with the total size of the global registered vehicle fleet.
- Analyst Opinion at Fact.MR
- Fact.MR analysis indicates that the automotive antifreeze market is benefiting from a structural product mix upgrade cycle driven by OEM specification migration toward OAT and HOAT extended-life formulations that command sustainable price premiums over conventional IAT coolants. This premiumisation dynamic is most pronounced in established vehicle markets where OEM service documentation specifies OAT replacement and vehicle owners are conditioned to purchase quality-matched replacements at authorised service centres. The simultaneous emergence of electric vehicle battery thermal management as a distinct coolant application segment is adding incremental revenue growth potential that did not exist in the previous market cycle, as EV battery cooling systems require dedicated fluid circuit fills that are separate from and additive to any engine cooling demand in hybrid vehicle architectures. The primary growth constraint in the near term is consumer awareness in price-sensitive emerging markets where antifreeze is not yet treated as a regular scheduled maintenance item, and where the lowest-cost IAT products dominate aftermarket sales regardless of OEM specification requirements.
- Strategic Implications / Executive Takeaways
- EV Thermal Management Fluid Product Line Development: Antifreeze manufacturers should develop and certify dedicated battery thermal management fluid formulations compatible with EV aluminium heat exchanger and polymer seal materials, positioning these products as a premium OEM and aftermarket revenue stream that complements rather than competes with conventional engine coolant volumes as the vehicle fleet electrification share grows.
- OAT Aftermarket Brand Investment in Emerging Markets: Manufacturers should invest in OAT and HOAT brand education programs targeting independent service centres and vehicle owner communities in India, Southeast Asia, and Latin America, where the lack of OEM specification awareness and price sensitivity currently constrains premium coolant adoption below the levels that OEM vehicle specifications technically require.
- Ethylene Glycol Supply Chain Diversification: Given ethylene glycol's commodity price volatility driven by petrochemical feedstock markets, coolant manufacturers should develop flexible formulation capabilities that allow partial substitution with propylene glycol or bio-based glycol alternatives when cost dynamics shift, reducing margin exposure to EG commodity price spikes that compress coolant production economics in fixed-price aftermarket supply contracts.
What are the drivers of Automotive Antifreeze Market?
The automotive antifreeze market is experiencing significant growth due to the global increase in automotive production. The demand for efficient engine cooling systems is rising as a result of the ongoing advancements in automotive technologies.
Antifreeze coolants not only regulate the engine's temperature in extreme conditions, but they also prevent corrosion and scaling within the cooling system, thereby increasing the engine's overall lifespan. Furthermore, the market is experiencing substantial growth due to increasing awareness of the advantages of using high-quality antifreeze coolants and proper vehicle maintenance.
Stringent emission regulations implemented by governments worldwide are another factor contributing to the automotive antifreeze market expansion. Advanced coolants with enhanced thermal transfer capabilities and reduced environmental impact are being developed in response to these regulations.
Manufacturers are making substantial investments in research and development to create formulations that meet these rigorous standards while delivering exceptional performance. This trend toward highly efficient and environmentally friendly products is expected to sustain the market's upward trajectory throughout the forecast period.
Additionally, the growing popularity of electric and hybrid vehicles is influencing the demand for sophisticated antifreeze coolants. To regulate the temperature of batteries and other components, these vehicles require specialized cooling systems.
As the automotive industry continues to transition to electric mobility, the demand for innovative coolant solutions is anticipated to increase, thereby further stimulating the automotive antifreeze market growth. This transition is generating opportunities for market participants to develop new products specifically designed to meet the unique needs of hybrid and electric vehicles.
What are the regional trends of Automotive Antifreeze Market?
The demand and growth drivers in the automotive antifreeze market exhibit significant disparities across key geographies for regional trends. In 2025, the Asia Pacific region dominated the global market. This growth was fueled by the rapid production of vehicles, urbanization, increasing disposable incomes, and robust automotive manufacturing in countries such as China, India, and Japan.
The growing number of electric vehicles (EVs), which necessitate specialized cooling systems, and the automotive aftermarket sector additionally bolster the region’s expansion. North America is characterized by a mature aftermarket ecosystem, frequent coolant replacement due to severe winters, and a high production and demand for large-engine vehicles.
In terms of consumption, the U.S. is the leader, and the region is anticipated to expand at the fastest CAGR during the forecast period. The primary trends in the region are sustainability and innovation, including the use of eco-friendly and extended-life coolants.
Europe is a mature and innovation-driven market, with growth being driven by stringent EU regulations, a strong OEM presence, and a focus on sustainable, high-performance antifreeze formulations. The demand for sophisticated coolant solutions is being driven by the rise of hybrid and electric vehicles, as well as the cold climates in Northern and Eastern Europe.
Among all regions, Europe is anticipated to experience the most rapid growth. The expansion of automotive production, the increasing ownership of vehicles, and the diverse climate conditions necessitating a variety of antifreeze formulations are all contributing to the constant growth of Latin America.
Extended-life coolants are gaining popularity in the commercial vehicle sector, particularly in countries such as Brazil, Mexico, and Argentina, as a means of reducing maintenance costs.
The Middle East & Africa are experiencing development as a result of the region's increasing infrastructure, rising vehicle sales, and high temperatures, particularly in South Africa and the Gulf countries. Advanced cooling systems are in high demand, and the market is expanding due to the expansion of the aftermarket segment and increasing urbanization.
In general, the global automotive antifreeze market is influenced by several factors, including the increasing production of vehicles, the transition to electric vehicles (EVs), climate-driven demand, regulatory pressures for environmentally friendly products, and the growing market.
What are the challenges and restraining factors of the Automotive Antifreeze Market?
The automotive antifreeze market faces several key challenges and restraining factors. Stringent environmental and regulatory constraints are a major issue, particularly due to the toxicity of ethylene glycol, which has led governments to introduce eco-friendly directives and protocols for hazardous waste disposal.
This increases R&D and production costs, especially for smaller firms, and complicates international product standardization due to varying regional regulations. Volatility in raw material prices, particularly for glycols and additives derived from crude oil, results in unstable production costs and impacts the competitiveness of smaller players.
Geopolitical tensions, supply chain disruptions, and seasonal demand fluctuations further contribute to pricing uncertainty. The market is also challenged by the proliferation of counterfeit and substandard products, particularly in emerging economies, which undermines branded products and can compromise vehicle performance and safety.
Ensuring product traceability and maintaining consumer trust remains a challenge. Compatibility issues across different engines necessitate that manufacturers develop specific formulations for various vehicle types, thereby increasing complexity and the need for extensive testing and technician training.
The rise of hybrid and electric vehicles introduces new thermal management requirements, demanding innovation in antifreeze formulations to suit these powertrains. Recycling and disposal of used antifreeze present additional hurdles, as waste antifreeze is hazardous due to its toxicity and heavy metal content, making recycling technically and economically challenging.
Engine downsizing to meet emission regulations also affects demand, as smaller engines may require less coolant, although they operate at higher temperatures and necessitate more advanced cooling solutions. Competition, regulatory hurdles, and economic factors continue to restrain market growth, requiring ongoing adaptation and investment from manufacturers.
Country-Wise Outlook
U.S. automotive antifreeze market sees growth driven by rising vehicle production and sales
The U.S. automotive antifreeze market is seeing significant growth, primarily driven by the increasing demand for advanced engine cooling solutions that enhance vehicle performance across a range of temperatures. The rapid expansion of the electric vehicle (EV) sector, supported by federal incentives and a growing consumer preference for sustainable options, is a key factor, as EVs require specialized cooling systems for batteries and powertrains.
Additionally, the growing vehicle fleet, increased production of both passenger and commercial vehicles, and higher ownership rates are driving the demand for antifreeze, as these fluids are crucial for engine protection in extreme climates.

Stricter environmental regulations from agencies like the EPA and DOT are pushing automakers to adopt long-life, low-toxicity, and biodegradable antifreeze solutions, aligning with broader trends toward sustainability. The growing automotive aftermarket, which includes regular coolant replacement and maintenance, further sustains demand.
Innovations in EV-specific coolants and the shift toward organic-based, less toxic formulations are also shaping the market. Furthermore, the rise of fleet management and shared mobility services, such as ride-hailing and rentals, is accelerating coolant consumption due to higher vehicle utilization rates. Overall, these factors collectively drive the robust expansion of the U.S. automotive antifreeze market.
China witnesses rapid market growth backed by country's growing demand for vehicles
The automotive antifreeze market in China is experiencing consistent growth, primarily driven by the country's increasing demand for vehicles. Rapid urbanization, rising disposable incomes, and the expanding middle class have all contributed to this surge in automobile ownership and usage.
Furthermore, the demand for sophisticated antifreeze formulations that can effectively manage heat and safeguard against freezing and corrosion is driven by technological advancements in engine design, such as the development of more potent and compact engines that operate at elevated temperatures.
The market is also expanding due to the adoption of electric vehicles (EVs), which necessitate specialized coolants for the thermal management of battery and power electronics. Additionally, manufacturers are being compelled to adopt eco-friendly and high-performance antifreeze solutions in response to stringent environmental regulations.
Meanwhile, their ongoing investments in research and development are fostering innovation in coolant technology. A significant development is the approval of Dober’s EV-LC Coolant, which has passed China’s new GB standard (GB29743.2) for electric vehicle coolants. This standard, introduced to address safety concerns such as EV battery fires, sets strict requirements for electrical conductivity (below 100 microsiemens per centimeter), corrosion resistance, and thermal stability.
Dober’s product is among the first to meet these rigorous criteria, enabling its entry into the Chinese market and reflecting the country’s focus on next-generation, high-performance coolants for electric vehicles.
Japan sees precision manufacturing fuels demand for automotive antifreeze
The Japan automotive antifreeze market is witnessing notable growth, primarily fueled by the expanding vehicle parc and the increasing demand for advanced engine thermal management solutions. This growth is further supported by technological advancements, such as the development of more efficient and long-lasting antifreeze formulations, and by heightened environmental awareness that is driving the adoption of eco-friendly products.
The market's expansion is also linked to the rising number of vehicles on the road, which boosts the need for regular maintenance and coolant replacement. Additionally, regulatory trends encouraging sustainable and low-toxicity solutions are prompting innovation among manufacturers, ensuring the market remains dynamic and responsive to both consumer and legislative demands. The market is also experiencing increased demand for coolants specifically designed for electric and hybrid vehicles, reflecting the growing adoption of these vehicle types in Japan.
Category-wise Analysis
Ethylene glycol's to exhibit leading by product type
Ethylene glycol is the dominant product type in the automotive antifreeze coolant market, owing to its superior heat transfer capabilities and widespread use in passenger and commercial vehicles. It offers excellent protection against engine overheating and freezing, making it highly effective in a wide range of temperature conditions. Despite its toxicity, ethylene glycol remains the preferred choice due to its low cost, high performance, and compatibility with various engine types, especially in regions with established vehicle manufacturing and service infrastructure.
Propylene glycol is the fastest-growing segment, gaining popularity due to its lower toxicity and environmental friendliness. It is increasingly used in applications where human or animal exposure is a concern, such as in buses, fleet vehicles, and heavy-duty trucks operating in sensitive environments. While slightly less efficient in heat transfer compared to ethylene glycol, its safety profile and biodegradable nature make it a favorable alternative. Growing regulatory pressure and consumer preference for greener alternatives are driving the rising adoption of this technology.
Organic acid to exhibit leading by technology
Organic Acid Technology (OAT) is the leading segment in the Japanese automotive antifreeze market, holding a significant share due to its long-lasting performance and increasing preference among manufacturers. Unlike traditional coolants, OAT-based formulations are free of silicates, allowing for an extended service life and reduced frequency of coolant replacement. This translates into lower maintenance costs and improved convenience for vehicle owners, making OAT-based antifreeze a preferred choice in both passenger and commercial vehicle segments.
OAT technology’s continued dominance is further supported by its superior corrosion protection and compatibility with modern engine components, such as aluminum and plastics. These qualities enhance engine longevity and efficiency, aligning well with evolving automotive engineering trends. As consumers and OEMs increasingly seek advanced, low-maintenance solutions, OAT-based coolants are expected to maintain their lead over Inorganic Acid Technology (IAT) and Hybrid Acid Technology (HOAT) in the Japanese market during the forecast period.
Passenger to exhibit leading by vehicle type

Passenger cars dominate the automotive antifreeze coolant market, accounting for the largest share due to the high volume of passenger vehicle production and ownership worldwide. These vehicles require regular coolant maintenance to ensure optimal engine temperature, prevent corrosion, and extend engine life. With growing urbanization, rising disposable incomes, and expanding middle-class populations, especially in emerging markets, the demand for reliable and efficient engine cooling solutions in passenger cars continues to drive significant market growth.
Heavy commercial vehicles (HCVs) are a steadily growing segment, driven by the expansion of logistics, construction, and industrial transportation sectors. These vehicles operate under intense workloads and in harsh environments, making efficient and durable antifreeze solutions critical to engine health and vehicle uptime. The need for long-life coolants with enhanced thermal stability and corrosion protection is fueling the adoption of advanced antifreeze formulations in the HCV segment, particularly in regions with extreme temperature variations.
OEMs to exhibit leading by sales channel

OEM (Original Equipment Manufacturer) is the dominating segment in the automotive antifreeze coolant market, accounting for a significant share due to the increasing production of vehicles globally. Automotive manufacturers typically fill engines with coolant during vehicle assembly, ensuring compatibility and optimal performance from the start. As the demand for passenger and commercial vehicles rises, especially in emerging economies, OEM sales continue to thrive. OEM coolants are also preferred for meeting strict quality, warranty, and performance standards set by automakers.
The aftermarket segment is growing steadily, driven by the need for periodic coolant replacement and maintenance in existing vehicles. As vehicles age, owners often turn to aftermarket channels for cost-effective and accessible coolant solutions. This segment benefits from a vast base of on-road vehicles, especially in regions with extreme weather conditions where regular coolant top-ups or replacements are necessary. Independent service centers, auto part retailers, and online platforms play a key role in expanding the reach of aftermarket coolant products.
Competitive Analysis

The automotive antifreeze market is highly competitive, with the presence of several multinational companies and regional players. Continuous innovation, strategic partnerships, mergers and acquisitions, and an emphasis on product portfolio expansion are the defining characteristics of the competitive landscape.
Major participants in the market are making substantial investments in research and development to develop sophisticated coolant formulations that satisfy the changing demands of consumers and regulatory standards. The competition is also characterized by endeavors to improve distribution networks, both online and offline, to expand the consumer base.
The development of eco-friendly antifreeze coolants is a result of the growing emphasis on sustainability and environmental impact among companies. Stringent regulations and the increasing consumer predilection for environmentally friendly products are the primary factors driving this trend.
The competitive landscape is also influenced by the proliferation of electric and hybrid vehicles, which require specialized cooling systems. Players who are capable of innovation and provide products that are specifically designed for these emerging automotive technologies are likely to acquire a competitive advantage.
An additional critical component of the competitive landscape is the emphasis on strategic partnerships and collaborations. To expand their product lines and market presence, organizations are forming partnerships with automotive manufacturers, suppliers, and technology providers. These partnerships enable organizations to leverage each other's strengths, stimulate innovation, and improve operational efficiency.
Key players in the automotive antifreeze industry include Valvoline International Inc., BP Plc, Chevron Corporation, ExxonMobil Corporation, Fuchs Petrolub SE, KOST USA Inc., Prestone Products Corporation, Recochem Inc., Rock Oil Company, Total S.A., and other notable companies.
Recent Development
- In June 2025, Setco Automotive Limited expanded its product portfolio by introducing a new Automotive Water Pump, marking its entry into engine cooling solutions for Light Commercial Vehicles (LCVs) and medium- and heavy-duty commercial vehicles (MHCVs). This water pump is engineered to deliver optimal coolant flow and maintain thermal stability.
- In October 2024, Witham Group, a leading UK lubricant manufacturer renowned for its commitment to innovation and quality, introduced its new QualGuard range of antifreeze and coolants. This latest product line introduces cutting-edge Si-OAT (Silicated Organic Acid Technology) to two new offerings, setting a new standard in engine protection and performance.
Bibliography
- 1. ASTM International. (2023). ASTM D3306: Standard Specification for Glycol Base Engine Coolant for Automobile and Light-Duty Service. ASTM International.
- 2. SAE International. (2024, January). SAE J1034: Engine Coolant Concentration and Maintenance Practices for Automotive Cooling Systems. SAE International.
- 3. International Energy Agency. (2024, April). Global EV Outlook 2024: Battery Thermal Management System Specifications and Fluid Requirements. IEA.
- 4. European Chemicals Agency. (2024, March). Ethylene Glycol Substance Registration and Safe Use Guidance for Automotive Cooling System Applications. ECHA.
- 5. Government of India, Ministry of Road Transport and Highways. (2024, June). Automotive Component Quality Standards: Coolant and Maintenance Fluid Specifications for Indian Market Vehicles. MoRTH.
- 6. World Bank Group. (2024, February). Vehicle Ownership and Maintenance Market Development in South and Southeast Asia: Automotive Fluids Consumption Trends. World Bank.
This bibliography is provided for reader reference. The full Fact.MR report contains the complete reference list with primary research documentation.
This Report Addresses
- Market sizing and quantitative forecast metrics: detailing precise revenue projections, absolute dollar growth, and compound annual growth rates across major antifreeze segments and geographies through 2036.
- Segmentation analysis: mapping the adoption velocity of leading product, technology, and end-use categories and evaluating structural factors driving segment share transitions over the forecast period.
- Regional deployment intelligence: comparing growth dynamics in high-momentum Asia Pacific and emerging markets against the mature replacement and upgrade demand patterns prevalent in European and North American industry hubs.
- Regulatory compliance assessment: analyzing how evolving product safety standards, environmental directives, and sector-specific mandates are reshaping procurement decisions, material specifications, and supplier qualification criteria.
- Competitive posture evaluation: tracking consolidation trends, platform integration strategies, technology differentiation investments, and the resulting competitive dynamics among established market players and emerging challengers.
- Capital project strategic guidance: defining the procurement specifications, investment thresholds, and performance benchmarks required to support next-generation product adoption and facility modernization programs.
- Supply chain vulnerability analysis: identifying sourcing concentration risks, logistics bottlenecks, raw material price dependencies, and geographic exposure scenarios that affect market participant cost structures.
- Custom data delivery formats: encompassing interactive dashboards, raw Excel datasets, and comprehensive PDF narrative reports tailored for executive decision-making and analyst reference applications.
Scope of the Report
| Metric | Value |
|---|---|
| Quantitative Units | USD 7.58 billion to USD 14.49 billion, at a CAGR of 6.7% |
| Market Definition | Glycol-based coolant formulations across IAT, OAT, and HOAT chemistries for engine cooling, battery thermal management, and power electronics cooling in passenger and commercial vehicles, supplied through OEM and aftermarket channels. |
| Product Type Segmentation | Ethylene Glycol, Propylene Glycol, Glycerol |
| Technology Segmentation | Inorganic Additive Technology, Organic Acid Technology, Hybrid Organic Acid Technology |
| Vehicle Type Segmentation | Passenger Cars, LCVs, HCVs |
| Sales Channel Segmentation | OEM, Aftermarket |
| Regions Covered | North America, Latin America, Europe, East Asia, South Asia, Oceania, Middle East and Africa |
| Countries Covered | India, China, Japan, USA, and 40 plus countries |
| Key Companies Profiled | ExxonMobil Corporation, Valvoline International Inc., BP Plc, Chevron Corporation, Fuchs Petrolub SE, KOST USA Inc., Prestone Products Corporation, Recochem Inc., Rock Oil Company, Total S.A. |
| Forecast Period | 2026 to 2036 |
| Approach | Bottom-up aggregation of coolant volume by vehicle type and service interval frequency with EV thermal management fluid incremental demand modeling |
Segmentation of Automotive Antifreeze Market
-
By Product Type :
- Ethylene Glycol
- Propylene Glycol
- Glycerine
-
By Technology :
- Organic Acid Technology
- Inorganic Acid Technology
- Hybrid Acid Technology
-
By Vehicle Type :
- Passenger Cars
- Light Commercial Vehicles
- Heavy Commercial Vehicles
- Construction Vehicles
-
By Sales Channel :
- OEM
- Aftermarket
-
By Region :
- North America
- Latin America
- Western Europe
- Eastern Europe
- East Asia
- South Asia & Pacific
- Middle East & Africa
- Frequently Asked Questions -
How large is the automotive antifreeze market in 2026?
The global automotive antifreeze market is estimated to be valued at USD 7.58 billion in 2026.
What will the antifreeze market size be by 2036?
The automotive antifreeze market is projected to reach USD 14.49 billion by 2036.
What is the expected CAGR between 2026 and 2036?
The market is expected to grow at a CAGR of 6.7% between 2026 and 2036.
Which product type leads the market in 2026?
Ethylene glycol commands 54.7% product type share in 2026, maintaining dominance through established corrosion inhibitor chemistry compatibility, thermal property advantages, and production cost efficiency across global passenger car and commercial vehicle cooling system specifications.
Which coolant technology holds the largest share?
Organic Acid Technology holds 48.9% technology segment share in 2026, driven by OEM specification adoption for extended five-year service life formulations that command price premiums over conventional two-year IAT coolants and generate quality-matched aftermarket replacement demand.
Why does the aftermarket channel account for 61.3% share?
Aftermarket dominance reflects antifreeze as a periodic maintenance fluid requiring scheduled replacement across the vehicle ownership lifetime, generating consistent repeat purchase events proportional to the size of the global registered vehicle fleet independent of new vehicle production volumes.
What is driving India's 6.5% CAGR leadership?
India's growth is driven by rapidly expanding vehicle ownership, improving maintenance awareness among first-time vehicle owners, and growing OAT and HOAT coolant adoption as the proportion of vehicles with extended-service-life factory-fill specifications increases in the Indian market.
How are electric vehicles creating new antifreeze market demand?
EV battery packs and power electronics require dedicated thermal management cooling circuits with chemical compatibility requirements specific to aluminium components and polymer seals, establishing a premium coolant revenue category additive to conventional engine cooling demand that grows proportionally with EV production volumes.
What is excluded from the scope of this report?
Industrial process cooling fluids, HVAC refrigerants, data centre thermal management fluids, windshield washer fluids, and coolant additive concentrates sold as supplemental treatments rather than complete formulations fall outside this market scope.

Author:
Shubham Patidar

Editor:
Naved Ahmed