Automotive Lift Market

Automotive Lift Market Analysis, By Product, By Lifting Capacities, By End-Use, and Region - Market Insights 2025 to 2035

Analysis of Automotive Lift Market Covering 30+ Countries Including Analysis of US, Canada, UK, Germany, France, Nordics, GCC countries, Japan, Korea and many more

Automotive Lift Market Outlook (2025 to 2035)

The global automotive lift market is projected to increase from USD 3.2 billion in 2025 to USD 4.9 billion by 2035, with a CAGR of 4.4%, driven by increasing vehicle ownership and the need for advanced, efficient repair and maintenance infrastructure. Their ability to safely elevate vehicles for inspections and repairs makes automotive lifts ideal for garages, service centers, and dealership workshops.

Automotive Lift Market Value Analysis 2025 To 2035

Metric Value
Industry Size (2025E) USD 3.2 billion
Industry Size (2035F) USD 4.9 billion
CAGR (2025 to 2035) 4.4%

What are the Drivers of Automotive Lift Market?

Globally, growing vehicle ownership has led to increased demand for automotive maintenance and repair services. This expansion necessitates efficient workshop infrastructure, which includes automotive lifts for routine inspections, repairs, and servicing.

The growing consumer preference for preventive maintenance is encouraging service centers to invest in versatile and high-performance lifting equipment. This shift promotes the development of multipurpose lifts capable of handling a wide range of vehicle types, from compact cars to light commercial vehicles.

Government regulations requiring regular vehicle safety checks and emissions testing also play a crucial role in driving market growth. Workshops must be equipped with lifts to facilitate thorough underbody inspections and compliance-related modifications, which increases the demand.

Advancements in automotive technology, such as electric vehicles and new chassis designs, are encouraging service providers to use more adaptable and technologically advanced lift systems. Because EVs frequently require different maintenance setups, the market is adapting with compatible lift designs to meet these demands.

What are the Regional Trends of Automotive Lift Market?

North America continues to lead the market due to its mature automotive service industry and high vehicle ownership rates. In 2023, the U.S. alone had over 280 million registered vehicles, creating a high demand for vehicle lifts in repair shops, dealerships, and fleet service centres. The strict ALI (Automotive Lift Institute) safety standards encourage workshops to use certified, high-quality lift systems.

Germany, France, and the U.K. lead the way in Europe in terms of demand. The region's emphasis on vehicle safety, combined with EU regulations governing garage equipment standards, has led to the adoption of advanced lift technologies, such as alignment lifts and in-ground lifts. The rise in electric vehicle sales, which are expected to reach nearly 3 million in Europe by 2023, has prompted investments in EV-compatible lifting systems.

The Asia-Pacific region, specifically China and India, is experiencing rapid market expansion. China, the world's largest automobile market, sold over 26 million vehicles in 2023, resulting in a strong demand for service infrastructure. Similarly, India sold over 4 million passenger cars in fiscal year 2023-24, increasing the demand for small garages and service chains seeking low-cost, compact lifting equipment.

Growth in Latin America, the Middle East & Africa is modest but increasing as automotive aftermarkets expand and urbanization accelerates. Lifts are increasingly being installed in tire shops and multi-brand garages in countries such as Brazil and the UAE. However, the adoption of advanced systems is slow due to budget limitations.

What are the Challenges and Restraining Factors of the Automotive Lift Market?

The automotive lift market faces several significant challenges that limit its growth, especially in emerging economies. One of the main concerns is the substantial initial investment required for installation. Advanced lift systems, like in-ground or mobile column lifts, can cost up to ₹6 lakh ($7,000), making them unaffordable for small to mid-sized garages. This financial barrier hinders market penetration in cost-sensitive regions, such as Southeast Asia, Latin America, and certain parts of India.

Compliance with international safety standards is another pressing concern. Automotive lifts must meet stringent regulatory requirements, such as ALI/ETL certifications in North America and CE marking in the European Union. Lack of awareness and noncompliance often lead to operational hazards. According to the United States Occupational Safety and Health Administration (OSHA), over 600 injuries related to lift operations occur annually, underscoring the critical need for certified, safe equipment and adequate operator training.

EVs are typically 20-30% heavier than internal combustion engine vehicles due to battery packs, necessitating more robust lifting equipment. For instance, the Ford F-150 Lightning weighs more than 3,000 kg, which exceeds the load capacity of many standard two-post lifts. As EV adoption increases, many existing service centers must upgrade their lifts to be EV-compatible, resulting in higher capital costs.

Furthermore, a lack of skilled technicians familiar with modern lifting systems prevents proper operation and maintenance. In developing markets, informal garages often use outdated or poorly maintained lifts, which increases safety risks and decreases operational efficiency. This discourages investment in advanced lifting technologies, posing a barrier to modernization.

Country-Wise Outlook

The U.K. Automotive Lift Market sees Growth Driven by Strict Safety Regulations
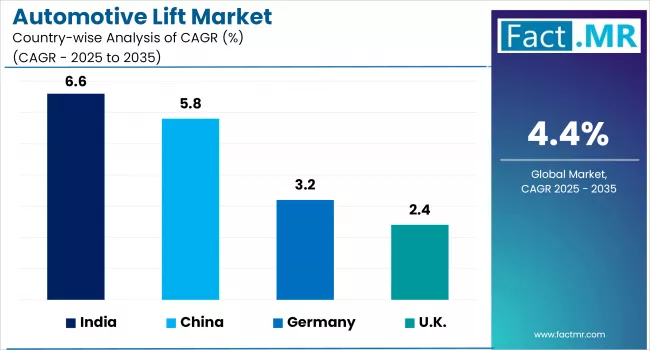
Automotive Lift Market Country Wise Analysis Of CAGR 2025 To 2035

Countries CAGR (2025 to 2035)
United Kingdom 2.4%
China 5.8%
India 6.6%

The U.K. automotive lift market is driven by a well-established automotive servicing industry and strict safety regulations. With over 40 million registered vehicles in 2023, the UK anticipates high demand for routine vehicle inspections, maintenance, and MOT testing, all of which necessitate dependable lift systems. Lift sales remain steady in independent garages and authorized service centers because of the constant need for servicing.

Health and safety regulations heavily influence the UK lift market. The Lifting Operations and Lifting Equipment Regulations (LOLER) and the Provision and Use of Work Equipment Regulations (PUWER) mandate regular inspections and certifications of all lifting equipment, encouraging service providers to invest in compliant and technologically advanced lifts. This has increased the demand for durable and safe equipment capable of handling a variety of vehicle types.

As the number of EVs in the UK grows to over 1.1 million by 2024, garages are upgrading their lifts to accommodate the heavier battery weights of these models. Lifts with precise load balancing, reinforced arms, and EV-specific adaptors are increasingly popular among service providers catering to emerging mobility trends.

China witnesses Rapid Market Growth Backed by Rising Car Ownership

Rising car ownership (over 325 million vehicles as of early 2024) drives the demand for versatile and efficient lifting systems. Two-post and scissor lifts are particularly popular due to their low installation costs and space-saving designs, which are ideal for compact urban repair shops.

China's push toward electrification is reshaping demand for equipment. Manufacturers are developing EV-compatible lifts with improved weight distribution and underbody access to support heavier batteries. Several local businesses, including Launch Tech and EAE Automotive, have begun to provide these solutions to support the country's EV servicing infrastructure.

Smart and automated lift systems are gaining popularity, especially in Tier 1 cities. Workshops are implementing IoT-enabled lifts for diagnostics, remote operation, and workflow optimization. This trend is consistent with China's broader industrial automation efforts under the "Made in China 2025" initiative, which promotes technological upgrades in the manufacturing and service sectors.

Regulatory enforcement for workplace safety is also becoming increasingly stringent. China's market is increasingly favoring certified equipment that meets CE and ISO standards, requiring local manufacturers to improve safety features. Certified Chinese lifts are less expensive in Southeast Asia and Latin America, which benefits exporters.

India Automotive Lift Market Growth Driven by Increased Vehicle Ownership and Repair Demand

The automotive lift market in India is experiencing steady growth, driven by a rapid increase in vehicle ownership and rising demand for automotive repair and maintenance services. More than 4 million passenger vehicles were sold in fiscal year 2023-24, indicating a strong recovery in the post-pandemic auto sector. The increase in vehicle numbers has resulted in a proliferation of service centers, garages, and workshops, all looking for efficient vehicle lifting solutions for routine servicing, wheel alignment, and underbody repair.

Government programs such as FAME II and various state-level subsidies have accelerated EV adoption, particularly in major cities like Delhi, Mumbai, and Bangalore. This has increased the demand for heavy-duty, battery-accessible lift systems, as EVs have different underbody service requirements than internal combustion vehicles. Companies are now incorporating electro-hydraulic lifts and in-ground lifts designed for EV platforms to cater to this market segment.

The trend is toward IoT-enabled lifts with diagnostic capabilities and remote monitoring features. Compact scissor lifts and portable lift models are increasingly popular in small urban garages with limited space. Meanwhile, high-capacity four-post lifts remain popular in multi-bay dealerships and tire chains.

On the regulatory side, workshops are increasingly required to adhere to ISO standards for lift safety and operation, causing suppliers to improve their product quality. Certification and compliance are increasingly important for dealerships and service centers to keep their operational licenses and brand partnerships.

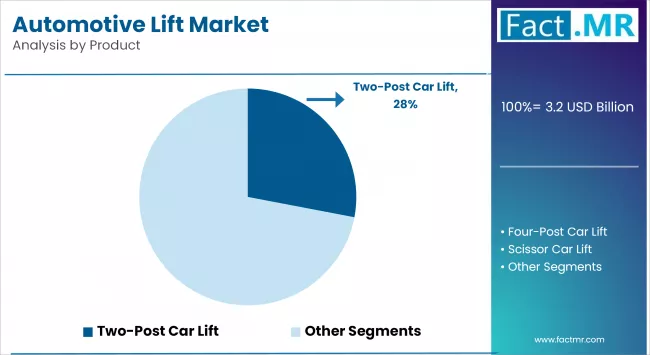
Category-wise Analysis

Two-post Car to Exhibit Leading by Product

The two-post car lift is a popular choice among automotive lifts due to its space efficiency and cost-effectiveness. There are two strong columns with adjustable arms that lift the vehicle by its frame, allowing access to the wheels and undercarriage. Professional garages and service centers with limited floor space often use two-post lifts due to their smaller footprint and lower maintenance requirements.

Automotive Lift Market Value Analysis By Product

Scissor car lifts raise the platform vertically in a crisscross motion. These compact lifts are ideal for quick service, tire changes, and bodywork in small workshops. Available in portable and in-ground models, scissor lifts provide a clean, unobstructed workspace. The low-profile design makes them suitable for vehicles with low clearance, and advanced models can lift heavy loads. Urban repair facilities and quick-lube centers favour their space-saving and mobility.

9000-12000 lbs to Exhibit Leading by Lifting Capacities

The 9000-12000 lbs range is one of the most popular categories in the automotive lift market. It primarily serves passenger cars, SUVs, and light-duty trucks, making it ideal for general service applications. This load capacity is suitable for two- and four-post lifts, which are commonly used in independent garages, tire shops, and dealership service bays. Its popularity stems from the ability to handle a wide range of vehicle types without the need for specialized equipment, achieving the ideal balance of capacity, space efficiency, and affordability.

Automotive Lift Market Value Analysis By Lifting Capacities

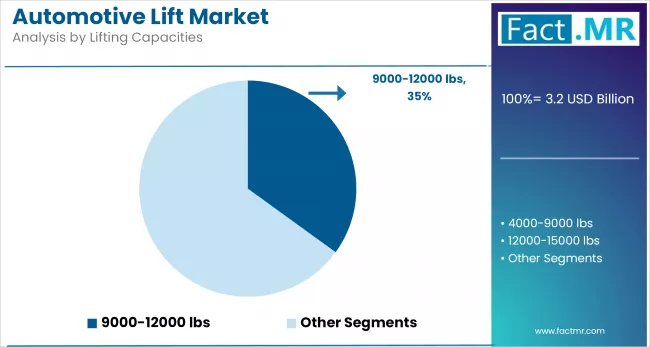
The 12000-15000 lbs segment is another important and increasingly popular category, especially among commercial vehicle service providers. This range is suitable for medium-duty trucks, utility vehicles, and fleet maintenance operations. As commercial delivery and logistics fleets grow, there is a greater demand for lifts that can support heavier and larger chassis vehicles. Shops that handle both consumer and light commercial vehicles frequently invest in this segment for its increased flexibility and strength without transitioning to more industrial-scale equipment.

Garages to Exhibit Leading by End-Use

Garages are an important end-use segment in the automotive lift market, with a consistent and growing demand base. Independent repair shops and service centers rely heavily on various lift types, such as two-post and scissor lifts, to efficiently perform routine maintenance, diagnostics, and repairs. Lifts are essential equipment in garage operations because they save space and are versatile, and cost-effective. Garages remain a significant consumer of automotive lift technologies as vehicle ownership grows and aging fleets require more maintenance.

Auto manufacturers also contribute significantly to the market because they extensively use automotive lifts in assembly lines, testing areas, and inspection bays. High-capacity lifts, such as in-ground and four-post lifts, are utilized in manufacturing plants to accommodate a range of vehicle sizes during production and quality control. With increased global vehicle production and a shift toward electric vehicle manufacturing, auto OEMs are investing in modern, automated lift systems to improve factory floor efficiency and safety.

Competitive Analysis

The global automotive lift market is becoming increasingly competitive, with a mix of established equipment manufacturers, specialized workshop solution providers, and emerging automation-focused firms serving various segments including passenger vehicles, commercial fleets, and EV servicing.

This competitive environment is largely driven by innovation in lift capacity, compact and space-saving designs, enhanced safety features, and compliance with international standards such as ANSI/ALI ALCTV and CE certification. Companies offering advanced technologies like automated systems, mobile lift configurations, and superior load-handling capabilities are gaining a distinct competitive advantage.

Rising global vehicle ownership has boosted the demand for automotive lifts in both commercial garages and personal workshops. Due to their stability, load capacity, and vehicle compatibility, two-post and four-post lifts are the most favored options. Compactness and versatility are essential for scissor lifts, which are increasingly popular in urban and space-limited areas.

Electric and battery-powered car lifts are replacing hydraulic models. These electric versions are popular in eco-friendly markets due to their energy efficiency, quieter operation, and lower maintenance costs. Premium lift manufacturers that integrate sustainable technology and digitized diagnostics stand out.

Key players in the automotive lift industry include BendPak Inc., Challenger Lift, Inc., Nussbaum Automotive Solutions LP, Dover Corp-Rotary Lift, Stertil-Koni USA, Inc., SUGIYASU Co.Ltd, ARI-HETRA, Ravaglioli S.p.A, PEAK Corp, EAE Automotive Equipment Co.Ltd., Guangzhou Gaochang Hydraulic Electromechanical Technic CO.,LTD, Dannmar Equipment, Titan Lift, LLC, Hunter Engineering Company, Cascos Maquinaria, and other players.

Recent Development

  • In January 2025, BendPak introduced 12AP-SRT, a professional and short-rise two-post lift for high-volume tire shops and service centers. Its 12,000-lb capacity, compact 93.5-inch height, and faster lifting speed enable ergonomic wheel and brake work, reducing technician strain.
  • In November 2024, Stertil-Koni introduced a Cab-Off Adapter for its mobile column lifts, allowing for the safe removal of truck cabs during heavy-duty maintenance. This adapter improves safety and precision when servicing large commercial vehicles, a crucial requirement for bus and truck servicing requirement

Segmentation of the Automotive Lift Market

  • By Product :

    • Four-Post Car Lift
    • Two-Post Car Lift
    • Scissor Car Lift
    • Portable Car Lift
    • In-Ground Car Lift
    • Alignment Car Lift
    • Mobile Column Car Lift
    • Parking Lift
  • By Lifting Capacities :

    • 4000-9000 lbs
    • 9000-12000 lbs
    • 12000-15000 lbs
    • 15000-20000 lbs
    • 20000-35000 lbs
    • Above 35000 lbs
  • By End-Use Application :

    • Garage
    • Auto Manufacturers
    • Tire Manufacturers
  • By Region :

    • North America
    • Latin America
    • Western Europe
    • Eastern Europe
    • East Asia
    • South Asia & Pacific
    • Middle East & Africa

Table of Content

  1. Executive Summary
    • Global Market Outlook
    • Demand-side Trends
    • Supply-side Trends
    • Technology Roadmap Analysis
    • Analysis and Recommendations
  2. Market Overview
    • Market Coverage / Taxonomy
    • Market Definition / Scope / Limitations
  3. Market Background
    • Market Dynamics
      • Drivers
      • Restraints
      • Opportunity
      • Trends
    • Scenario Forecast
      • Demand in Optimistic Scenario
      • Demand in Likely Scenario
      • Demand in Conservative Scenario
    • Opportunity Map Analysis
    • Product Life Cycle Analysis
    • Supply Chain Analysis
      • Supply Side Participants and their Roles
        • Producers
        • Mid-Level Participants (Traders/ Agents/ Brokers)
        • Wholesalers and Distributors
      • Value Added and Value Created at Node in the Supply Chain
      • List of Component Suppliers
      • List of Existing and Potential Buyers
    • Investment Feasibility Matrix
    • Value Chain Analysis
      • Profit Margin Analysis
      • Wholesalers and Distributors
      • Retailers
    • PESTLE and Porter’s Analysis
    • Regulatory Landscape
      • By Key Regions
      • By Key Countries
    • Production and Consumption Statistics
    • Import and Export Statistics
  4. Global Market Analysis 2020 to 2024 and Forecast, 2025 to 2035
    • Historical Market Size Value (USD Bn) & Volume (Units) Analysis, 2020 to 2024
    • Current and Future Market Size Value (USD Bn) & Volume (Units) Projections, 2025 to 2035
      • Y-o-Y Growth Trend Analysis
      • Absolute $ Opportunity Analysis
  5. Global Market Pricing Analysis 2020 to 2024 and Forecast 2025 to 2035
  6. Global Market Analysis 2020 to 2024 and Forecast 2025 to 2035, By Product
    • Introduction / Key Findings
    • Historical Market Size Value (USD Bn) & Volume (Units) Analysis By Product, 2020 to 2024
    • Current and Future Market Size Value (USD Bn) & Volume (Units) Analysis and Forecast By Product, 2025 to 2035
      • Four-Post Car Lift
      • Two-Post Car Lift
      • Scissor Car Lift
      • Portable Car Lift
      • In-Ground Car Lift
      • Alignment Car Lift
      • Mobile Column Car Lift
      • Parking Lift
    • Y-o-Y Growth Trend Analysis By Product, 2020 to 2024
    • Absolute $ Opportunity Analysis By Product, 2025 to 2035
  7. Global Market Analysis 2020 to 2024 and Forecast 2025 to 2035, By Lifting Capacities
    • Introduction / Key Findings
    • Historical Market Size Value (USD Bn) & Volume (Units) Analysis By Lifting Capacities, 2020 to 2024
    • Current and Future Market Size Value (USD Bn) & Volume (Units) Analysis and Forecast By Lifting Capacities, 2025 to 2035
      • 4000–9000 lbs
      • 9000–12000 lbs
      • 12000–15000 lbs
      • 15000–20000 lbs
      • 20000–35000 lbs
      • Above 35000 lbs
    • Y-o-Y Growth Trend Analysis By Lifting Capacities, 2020 to 2024
    • Absolute $ Opportunity Analysis By Lifting Capacities, 2025 to 2035
  8. Global Market Analysis 2020 to 2024 and Forecast 2025 to 2035, By End-Use Application
    • Introduction / Key Findings
    • Historical Market Size Value (USD Bn) & Volume (Units) Analysis By End-Use Application, 2020 to 2024
    • Current and Future Market Size Value (USD Bn) & Volume (Units) Analysis and Forecast By End-Use Application, 2025 to 2035
      • Garage
      • Auto Manufacturers
      • Tire Manufacturers
    • Y-o-Y Growth Trend Analysis By End-Use Application, 2020 to 2024
    • Absolute $ Opportunity Analysis By End-Use Application, 2025 to 2035
  9. Global Market Analysis 2020 to 2024 and Forecast 2025 to 2035, By Region
    • Introduction
    • Historical Market Size Value (USD Bn) & Volume (Units) Analysis By Region, 2020 to 2024
    • Current Market Size Value (USD Bn) & Volume (Units) Analysis and Forecast By Region, 2025 to 2035
      • North America
      • Latin America
      • Western Europe
      • East Asia
      • South Asia Pacific
      • Eastern Europe
      • Middle East & Africa
    • Market Attractiveness Analysis By Region
  10. North America Market Analysis 2020 to 2024 and Forecast 2025 to 2035, By Country
    • Historical Market Size Value (USD Bn) & Volume (Units) Trend Analysis By Market Taxonomy, 2020 to 2024
    • Market Size Value (USD Bn) & Volume (Units) Forecast By Market Taxonomy, 2025 to 2035
      • By Country
        • U.S.
        • Canada
        • Mexico
      • By Product
      • By Lifting Capacities
      • By End-Use Application
    • Market Attractiveness Analysis
      • By Country
      • By Product
      • By Lifting Capacities
      • By End-Use Application
    • Key Takeaways
  11. Latin America Market Analysis 2020 to 2024 and Forecast 2025 to 2035, By Country
    • Historical Market Size Value (USD Bn) & Volume (Units) Trend Analysis By Market Taxonomy, 2020 to 2024
    • Market Size Value (USD Bn) & Volume (Units) Forecast By Market Taxonomy, 2025 to 2035
      • By Country
        • Brazil
        • Chile
        • Rest of Latin America
      • By Product
      • By Lifting Capacities
      • By End-Use Application
    • Market Attractiveness Analysis
      • By Country
      • By Product
      • By Lifting Capacities
      • By End-Use Application
    • Key Takeaways
  12. Western Europe Market Analysis 2020 to 2024 and Forecast 2025 to 2035, By Country
    • Historical Market Size Value (USD Bn) & Volume (Units) Trend Analysis By Market Taxonomy, 2020 to 2024
    • Market Size Value (USD Bn) & Volume (Units) Forecast By Market Taxonomy, 2025 to 2035
      • By Country
        • Germany
        • Italy
        • France
        • U.K.
        • Spain
        • Russia
        • BENELUX
        • Rest of Europe
      • By Product
      • By Lifting Capacities
      • By End-Use Application
    • Market Attractiveness Analysis
      • By Country
      • By Product
      • By Lifting Capacities
      • By End-Use Application
    • Key Takeaways
  13. East Asia Market Analysis 2020 to 2024 and Forecast 2025 to 2035, By Country
    • Historical Market Size Value (USD Bn) & Volume (Units) Trend Analysis By Market Taxonomy, 2020 to 2024
    • Market Size Value (USD Bn) & Volume (Units) Forecast By Market Taxonomy, 2025 to 2035
      • By Country
        • China
        • Japan
        • South Korea
      • By Product
      • By Lifting Capacities
      • By End-Use Application
    • Market Attractiveness Analysis
      • By Country
      • By Product
      • By Lifting Capacities
      • By End-Use Application
    • Key Takeaways
  14. South Asia Pacific Market Analysis 2020 to 2024 and Forecast 2025 to 2035, By Country
    • Historical Market Size Value (USD Bn) & Volume (Units) Trend Analysis By Market Taxonomy, 2020 to 2024
    • Market Size Value (USD Bn) & Volume (Units) Forecast By Market Taxonomy, 2025 to 2035
      • By Country
        • India
        • ASEAN Countries
        • Australia & New Zealand
        • Rest of South Asia Pacific
      • By Product
      • By Lifting Capacities
      • By End-Use Application
    • Market Attractiveness Analysis
      • By Country
      • By Product
      • By Lifting Capacities
      • By End-Use Application
    • Key Takeaways
  15. Eastern Europe Market Analysis 2020 to 2024 and Forecast 2025 to 2035, By Country
    • Historical Market Size Value (USD Bn) & Volume (Units) Trend Analysis By Market Taxonomy, 2020 to 2024
    • Market Size Value (USD Bn) & Volume (Units) Forecast By Market Taxonomy, 2025 to 2035
      • By Country
        • Russia
        • Poland
        • Hungary
        • Balkan & Baltics
        • Rest of Eastern Europe
      • By Product
      • By Lifting Capacities
      • By End-Use Application
    • Market Attractiveness Analysis
      • By Country
      • By Product
      • By Lifting Capacities
      • By End-Use Application
    • Key Takeaways
  16. Middle East & Africa Market Analysis 2020 to 2024 and Forecast 2025 to 2035, By Country
    • Historical Market Size Value (USD Bn) & Volume (Units) Trend Analysis By Market Taxonomy, 2020 to 2024
    • Market Size Value (USD Bn) & Volume (Units) Forecast By Market Taxonomy, 2025 to 2035
      • By Country
        • KSA
        • Other GCC Countries
        • Turkiye
        • South Africa
        • Rest of MEA
      • By Product
      • By Lifting Capacities
      • By End-Use Application
    • Market Attractiveness Analysis
      • By Country
      • By Product
      • By Lifting Capacities
      • By End-Use Application
    • Key Takeaways
  17. Key Countries Market Analysis
    • Value (USD Bn) & Volume (Units)ed States
      • Pricing Analysis
      • Market Share Analysis, 2024
        • By Product
        • By Lifting Capacities
        • By End-Use Application
    • Germany
      • Pricing Analysis
      • Market Share Analysis, 2024
        • By Product
        • By Lifting Capacities
        • By End-Use Application
    • China
      • Pricing Analysis
      • Market Share Analysis, 2024
        • By Product
        • By Lifting Capacities
        • By End-Use Application
    • Japan
      • Pricing Analysis
      • Market Share Analysis, 2024
        • By Product
        • By Lifting Capacities
        • By End-Use Application
    • Italy
      • Pricing Analysis
      • Market Share Analysis, 2024
        • By Product
        • By Lifting Capacities
        • By End-Use Application
  18. Market Structure Analysis
    • Competition Dashboard
    • Competition Benchmarking
    • Market Share Analysis of Top Players
      • By Regional
      • By Product
      • By Lifting Capacities
      • By End-Use Application
  19. Competition Analysis
    • Competition Deep Dive
      • BendPak Inc.
        • Overview
        • Product Portfolio
        • Profitability by Market Segments (Product/Age /Sales Channel/Region)
        • Sales Footprint
        • Strategy Overview
          • Marketing Strategy
          • Product Strategy
          • Channel Strategy
      • Challenger Lift, Inc.
        • Overview
        • Product Portfolio
        • Profitability by Market Segments (Product/Age /Sales Channel/Region)
        • Sales Footprint
        • Strategy Overview
          • Marketing Strategy
          • Product Strategy
          • Channel Strategy
      • Nussbaum Automotive Solutions LP
        • Overview
        • Product Portfolio
        • Profitability by Market Segments (Product/Age /Sales Channel/Region)
        • Sales Footprint
        • Strategy Overview
          • Marketing Strategy
          • Product Strategy
          • Channel Strategy
      • Dover Corp-Rotary Lift
        • Overview
        • Product Portfolio
        • Profitability by Market Segments (Product/Age /Sales Channel/Region)
        • Sales Footprint
        • Strategy Overview
          • Marketing Strategy
          • Product Strategy
          • Channel Strategy
      • Stertil-Koni USA, Inc.
        • Overview
        • Product Portfolio
        • Profitability by Market Segments (Product/Age /Sales Channel/Region)
        • Sales Footprint
        • Strategy Overview
          • Marketing Strategy
          • Product Strategy
          • Channel Strategy
      • SUGIYASU Co. Ltd
        • Overview
        • Product Portfolio
        • Profitability by Market Segments (Product/Age /Sales Channel/Region)
        • Sales Footprint
        • Strategy Overview
          • Marketing Strategy
          • Product Strategy
          • Channel Strategy
      • ARI-HETRA
        • Overview
        • Product Portfolio
        • Profitability by Market Segments (Product/Age /Sales Channel/Region)
        • Sales Footprint
        • Strategy Overview
          • Marketing Strategy
          • Product Strategy
          • Channel Strategy
      • Ravaglioli S.p.A
        • Overview
        • Product Portfolio
        • Profitability by Market Segments (Product/Age /Sales Channel/Region)
        • Sales Footprint
        • Strategy Overview
          • Marketing Strategy
          • Product Strategy
          • Channel Strategy
      • PEAK Corp
        • Overview
        • Product Portfolio
        • Profitability by Market Segments (Product/Age /Sales Channel/Region)
        • Sales Footprint
        • Strategy Overview
          • Marketing Strategy
          • Product Strategy
          • Channel Strategy
      • EAE Automotive Equipment Co. Ltd.
        • Overview
        • Product Portfolio
        • Profitability by Market Segments (Product/Age /Sales Channel/Region)
        • Sales Footprint
        • Strategy Overview
          • Marketing Strategy
          • Product Strategy
          • Channel Strategy
      • Guangzhou Gaochang Hydraulic Electromechanical Technic CO., LTD
        • Overview
        • Product Portfolio
        • Profitability by Market Segments (Product/Age /Sales Channel/Region)
        • Sales Footprint
        • Strategy Overview
          • Marketing Strategy
          • Product Strategy
          • Channel Strategy
      • Dannmar Equipment
        • Overview
        • Product Portfolio
        • Profitability by Market Segments (Product/Age /Sales Channel/Region)
        • Sales Footprint
        • Strategy Overview
          • Marketing Strategy
          • Product Strategy
          • Channel Strategy
      • Titan Lift, LLC
        • Overview
        • Product Portfolio
        • Profitability by Market Segments (Product/Age /Sales Channel/Region)
        • Sales Footprint
        • Strategy Overview
          • Marketing Strategy
          • Product Strategy
          • Channel Strategy
      • Hunter Engineering Company
        • Overview
        • Product Portfolio
        • Profitability by Market Segments (Product/Age /Sales Channel/Region)
        • Sales Footprint
        • Strategy Overview
          • Marketing Strategy
          • Product Strategy
          • Channel Strategy
      • Cascos Maquinaria
        • Overview
        • Product Portfolio
        • Profitability by Market Segments (Product/Age /Sales Channel/Region)
        • Sales Footprint
        • Strategy Overview
          • Marketing Strategy
          • Product Strategy
          • Channel Strategy
  20. Assumptions & Acronyms Used
  21. Research Methodology

List Of Table

  • Table 1: Global Market Value (USD Bn) Forecast by Region, 2020 to 2035
  • Table 2: Global Market Volume (Units) Forecast by Region, 2020 to 2035
  • Table 3: Global Market Value (USD Bn) Forecast by Product, 2020 to 2035
  • Table 4: Global Market Volume (Units) Forecast by Product, 2020 to 2035
  • Table 5: Global Market Value (USD Bn) Forecast by Lifting Capacities, 2020 to 2035
  • Table 6: Global Market Volume (Units) Forecast by Lifting Capacities, 2020 to 2035
  • Table 7: Global Market Value (USD Bn) Forecast by End-Use Application, 2020 to 2035
  • Table 8: Global Market Volume (Units) Forecast by End-Use Application, 2020 to 2035
  • Table 9: North America Market Value (USD Bn) Forecast by Country, 2020 to 2035
  • Table 10: North America Market Volume (Units) Forecast by Country, 2020 to 2035
  • Table 11: North America Market Value (USD Bn) Forecast by Product, 2020 to 2035
  • Table 12: North America Market Volume (Units) Forecast by Product, 2020 to 2035
  • Table 13: North America Market Value (USD Bn) Forecast by Lifting Capacities, 2020 to 2035
  • Table 14: North America Market Volume (Units) Forecast by Lifting Capacities, 2020 to 2035
  • Table 15: North America Market Value (USD Bn) Forecast by End-Use Application, 2020 to 2035
  • Table 16: North America Market Volume (Units) Forecast by End-Use Application, 2020 to 2035
  • Table 17: Latin America Market Value (USD Bn) Forecast by Country, 2020 to 2035
  • Table 18: Latin America Market Volume (Units) Forecast by Country, 2020 to 2035
  • Table 19: Latin America Market Value (USD Bn) Forecast by Product, 2020 to 2035
  • Table 20: Latin America Market Volume (Units) Forecast by Product, 2020 to 2035
  • Table 21: Latin America Market Value (USD Bn) Forecast by Lifting Capacities, 2020 to 2035
  • Table 22: Latin America Market Volume (Units) Forecast by Lifting Capacities, 2020 to 2035
  • Table 23: Latin America Market Value (USD Bn) Forecast by End-Use Application, 2020 to 2035
  • Table 24: Latin America Market Volume (Units) Forecast by End-Use Application, 2020 to 2035
  • Table 25: Western Europe Market Value (USD Bn) Forecast by Country, 2020 to 2035
  • Table 26: Western Europe Market Volume (Units) Forecast by Country, 2020 to 2035
  • Table 27: Western Europe Market Value (USD Bn) Forecast by Product, 2020 to 2035
  • Table 28: Western Europe Market Volume (Units) Forecast by Product, 2020 to 2035
  • Table 29: Western Europe Market Value (USD Bn) Forecast by Lifting Capacities, 2020 to 2035
  • Table 30: Western Europe Market Volume (Units) Forecast by Lifting Capacities, 2020 to 2035
  • Table 31: Western Europe Market Value (USD Bn) Forecast by End-Use Application, 2020 to 2035
  • Table 32: Western Europe Market Volume (Units) Forecast by End-Use Application, 2020 to 2035
  • Table 33: East Asia Market Value (USD Bn) Forecast by Country, 2020 to 2035
  • Table 34: East Asia Market Volume (Units) Forecast by Country, 2020 to 2035
  • Table 35: East Asia Market Value (USD Bn) Forecast by Product, 2020 to 2035
  • Table 36: East Asia Market Volume (Units) Forecast by Product, 2020 to 2035
  • Table 37: East Asia Market Value (USD Bn) Forecast by Lifting Capacities, 2020 to 2035
  • Table 38: East Asia Market Volume (Units) Forecast by Lifting Capacities, 2020 to 2035
  • Table 39: East Asia Market Value (USD Bn) Forecast by End-Use Application, 2020 to 2035
  • Table 40: East Asia Market Volume (Units) Forecast by End-Use Application, 2020 to 2035
  • Table 41: South Asia Pacific Market Value (USD Bn) Forecast by Country, 2020 to 2035
  • Table 42: South Asia Pacific Market Volume (Units) Forecast by Country, 2020 to 2035
  • Table 43: South Asia Pacific Market Value (USD Bn) Forecast by Product, 2020 to 2035
  • Table 44: South Asia Pacific Market Volume (Units) Forecast by Product, 2020 to 2035
  • Table 45: South Asia Pacific Market Value (USD Bn) Forecast by Lifting Capacities, 2020 to 2035
  • Table 46: South Asia Pacific Market Volume (Units) Forecast by Lifting Capacities, 2020 to 2035
  • Table 47: South Asia Pacific Market Value (USD Bn) Forecast by End-Use Application, 2020 to 2035
  • Table 48: South Asia Pacific Market Volume (Units) Forecast by End-Use Application, 2020 to 2035
  • Table 49: Eastern Europe Market Value (USD Bn) Forecast by Country, 2020 to 2035
  • Table 50: Eastern Europe Market Volume (Units) Forecast by Country, 2020 to 2035
  • Table 51: Eastern Europe Market Value (USD Bn) Forecast by Product, 2020 to 2035
  • Table 52: Eastern Europe Market Volume (Units) Forecast by Product, 2020 to 2035
  • Table 53: Eastern Europe Market Value (USD Bn) Forecast by Lifting Capacities, 2020 to 2035
  • Table 54: Eastern Europe Market Volume (Units) Forecast by Lifting Capacities, 2020 to 2035
  • Table 55: Eastern Europe Market Value (USD Bn) Forecast by End-Use Application, 2020 to 2035
  • Table 56: Eastern Europe Market Volume (Units) Forecast by End-Use Application, 2020 to 2035
  • Table 57: Middle East & Africa Market Value (USD Bn) Forecast by Country, 2020 to 2035
  • Table 58: Middle East & Africa Market Volume (Units) Forecast by Country, 2020 to 2035
  • Table 59: Middle East & Africa Market Value (USD Bn) Forecast by Product, 2020 to 2035
  • Table 60: Middle East & Africa Market Volume (Units) Forecast by Product, 2020 to 2035
  • Table 61: Middle East & Africa Market Value (USD Bn) Forecast by Lifting Capacities, 2020 to 2035
  • Table 62: Middle East & Africa Market Volume (Units) Forecast by Lifting Capacities, 2020 to 2035
  • Table 63: Middle East & Africa Market Value (USD Bn) Forecast by End-Use Application, 2020 to 2035
  • Table 64: Middle East & Africa Market Volume (Units) Forecast by End-Use Application, 2020 to 2035

List Of Figures

  • Figure 1: Global Market Volume (Units) Forecast 2020 to 2035
  • Figure 2: Global Market Pricing Analysis
  • Figure 3: Global Market Value (USD Bn) Forecast 2020 to 2035
  • Figure 4: Global Market Value Share and BPS Analysis by Product, 2025 and 2035
  • Figure 5: Global Market Y-o-Y Growth Comparison by Product, 2025 to 2035
  • Figure 6: Global Market Attractiveness Analysis by Product
  • Figure 7: Global Market Value Share and BPS Analysis by Lifting Capacities, 2025 and 2035
  • Figure 8: Global Market Y-o-Y Growth Comparison by Lifting Capacities, 2025 to 2035
  • Figure 9: Global Market Attractiveness Analysis by Lifting Capacities
  • Figure 10: Global Market Value Share and BPS Analysis by End-Use Application, 2025 and 2035
  • Figure 11: Global Market Y-o-Y Growth Comparison by End-Use Application, 2025 to 2035
  • Figure 12: Global Market Attractiveness Analysis by End-Use Application
  • Figure 13: Global Market Value (USD Bn) Share and BPS Analysis by Region, 2025 and 2035
  • Figure 14: Global Market Y-o-Y Growth Comparison by Region, 2025 to 2035
  • Figure 15: Global Market Attractiveness Analysis by Region
  • Figure 16: North America Market Incremental $ Opportunity, 2025 to 2035
  • Figure 17: Latin America Market Incremental $ Opportunity, 2025 to 2035
  • Figure 18: Western Europe Market Incremental $ Opportunity, 2025 to 2035
  • Figure 19: East Asia Market Incremental $ Opportunity, 2025 to 2035
  • Figure 20: South Asia Pacific Market Incremental $ Opportunity, 2025 to 2035
  • Figure 21: Eastern Europe Market Incremental $ Opportunity, 2025 to 2035
  • Figure 22: Middle East & Africa Market Incremental $ Opportunity, 2025 to 2035
  • Figure 23: North America Market Value Share and BPS Analysis by Country, 2025 and 2035
  • Figure 24: North America Market Value Share and BPS Analysis by Product, 2025 and 2035
  • Figure 25: North America Market Y-o-Y Growth Comparison by Product, 2025 to 2035
  • Figure 26: North America Market Attractiveness Analysis by Product
  • Figure 27: North America Market Value Share and BPS Analysis by Lifting Capacities, 2025 and 2035
  • Figure 28: North America Market Y-o-Y Growth Comparison by Lifting Capacities, 2025 to 2035
  • Figure 29: North America Market Attractiveness Analysis by Lifting Capacities
  • Figure 30: North America Market Value Share and BPS Analysis by End-Use Application, 2025 and 2035
  • Figure 31: North America Market Y-o-Y Growth Comparison by End-Use Application, 2025 to 2035
  • Figure 32: North America Market Attractiveness Analysis by End-Use Application
  • Figure 33: Latin America Market Value Share and BPS Analysis by Country, 2025 and 2035
  • Figure 34: Latin America Market Value Share and BPS Analysis by Product, 2025 and 2035
  • Figure 35: Latin America Market Y-o-Y Growth Comparison by Product, 2025 to 2035
  • Figure 36: Latin America Market Attractiveness Analysis by Product
  • Figure 37: Latin America Market Value Share and BPS Analysis by Lifting Capacities, 2025 and 2035
  • Figure 38: Latin America Market Y-o-Y Growth Comparison by Lifting Capacities, 2025 to 2035
  • Figure 39: Latin America Market Attractiveness Analysis by Lifting Capacities
  • Figure 40: Latin America Market Value Share and BPS Analysis by End-Use Application, 2025 and 2035
  • Figure 41: Latin America Market Y-o-Y Growth Comparison by End-Use Application, 2025 to 2035
  • Figure 42: Latin America Market Attractiveness Analysis by End-Use Application
  • Figure 43: Western Europe Market Value Share and BPS Analysis by Country, 2025 and 2035
  • Figure 44: Western Europe Market Value Share and BPS Analysis by Product, 2025 and 2035
  • Figure 45: Western Europe Market Y-o-Y Growth Comparison by Product, 2025 to 2035
  • Figure 46: Western Europe Market Attractiveness Analysis by Product
  • Figure 47: Western Europe Market Value Share and BPS Analysis by Lifting Capacities, 2025 and 2035
  • Figure 48: Western Europe Market Y-o-Y Growth Comparison by Lifting Capacities, 2025 to 2035
  • Figure 49: Western Europe Market Attractiveness Analysis by Lifting Capacities
  • Figure 50: Western Europe Market Value Share and BPS Analysis by End-Use Application, 2025 and 2035
  • Figure 51: Western Europe Market Y-o-Y Growth Comparison by End-Use Application, 2025 to 2035
  • Figure 52: Western Europe Market Attractiveness Analysis by End-Use Application
  • Figure 53: East Asia Market Value Share and BPS Analysis by Country, 2025 and 2035
  • Figure 54: East Asia Market Value Share and BPS Analysis by Product, 2025 and 2035
  • Figure 55: East Asia Market Y-o-Y Growth Comparison by Product, 2025 to 2035
  • Figure 56: East Asia Market Attractiveness Analysis by Product
  • Figure 57: East Asia Market Value Share and BPS Analysis by Lifting Capacities, 2025 and 2035
  • Figure 58: East Asia Market Y-o-Y Growth Comparison by Lifting Capacities, 2025 to 2035
  • Figure 59: East Asia Market Attractiveness Analysis by Lifting Capacities
  • Figure 60: East Asia Market Value Share and BPS Analysis by End-Use Application, 2025 and 2035
  • Figure 61: East Asia Market Y-o-Y Growth Comparison by End-Use Application, 2025 to 2035
  • Figure 62: East Asia Market Attractiveness Analysis by End-Use Application
  • Figure 63: South Asia Pacific Market Value Share and BPS Analysis by Country, 2025 and 2035
  • Figure 64: South Asia Pacific Market Value Share and BPS Analysis by Product, 2025 and 2035
  • Figure 65: South Asia Pacific Market Y-o-Y Growth Comparison by Product, 2025 to 2035
  • Figure 66: South Asia Pacific Market Attractiveness Analysis by Product
  • Figure 67: South Asia Pacific Market Value Share and BPS Analysis by Lifting Capacities, 2025 and 2035
  • Figure 68: South Asia Pacific Market Y-o-Y Growth Comparison by Lifting Capacities, 2025 to 2035
  • Figure 69: South Asia Pacific Market Attractiveness Analysis by Lifting Capacities
  • Figure 70: South Asia Pacific Market Value Share and BPS Analysis by End-Use Application, 2025 and 2035
  • Figure 71: South Asia Pacific Market Y-o-Y Growth Comparison by End-Use Application, 2025 to 2035
  • Figure 72: South Asia Pacific Market Attractiveness Analysis by End-Use Application
  • Figure 73: Eastern Europe Market Value Share and BPS Analysis by Country, 2025 and 2035
  • Figure 74: Eastern Europe Market Value Share and BPS Analysis by Product, 2025 and 2035
  • Figure 75: Eastern Europe Market Y-o-Y Growth Comparison by Product, 2025 to 2035
  • Figure 76: Eastern Europe Market Attractiveness Analysis by Product
  • Figure 77: Eastern Europe Market Value Share and BPS Analysis by Lifting Capacities, 2025 and 2035
  • Figure 78: Eastern Europe Market Y-o-Y Growth Comparison by Lifting Capacities, 2025 to 2035
  • Figure 79: Eastern Europe Market Attractiveness Analysis by Lifting Capacities
  • Figure 80: Eastern Europe Market Value Share and BPS Analysis by End-Use Application, 2025 and 2035
  • Figure 81: Eastern Europe Market Y-o-Y Growth Comparison by End-Use Application, 2025 to 2035
  • Figure 82: Eastern Europe Market Attractiveness Analysis by End-Use Application
  • Figure 83: Middle East & Africa Market Value Share and BPS Analysis by Country, 2025 and 2035
  • Figure 84: Middle East & Africa Market Value Share and BPS Analysis by Product, 2025 and 2035
  • Figure 85: Middle East & Africa Market Y-o-Y Growth Comparison by Product, 2025 to 2035
  • Figure 86: Middle East & Africa Market Attractiveness Analysis by Product
  • Figure 87: Middle East & Africa Market Value Share and BPS Analysis by Lifting Capacities, 2025 and 2035
  • Figure 88: Middle East & Africa Market Y-o-Y Growth Comparison by Lifting Capacities, 2025 to 2035
  • Figure 89: Middle East & Africa Market Attractiveness Analysis by Lifting Capacities
  • Figure 90: Middle East & Africa Market Value Share and BPS Analysis by End-Use Application, 2025 and 2035
  • Figure 91: Middle East & Africa Market Y-o-Y Growth Comparison by End-Use Application, 2025 to 2035
  • Figure 92: Middle East & Africa Market Attractiveness Analysis by End-Use Application
  • Figure 93: Global Market – Tier Structure Analysis
  • Figure 94: Global Market – Company Share Analysis

- FAQs -

What is the global automotive lift market size in 2025?

The automotive lift market Is valued at USD 3.2 billion in 2025.

Who are the major players operating in the automotive lift market?

Prominent players in the market include Stertil-Koni USA, Inc., SUGIYASU Co., Ltd., ARI-HETRA, Ravaglioli S.p.A, PEAK Corp., and EAE Automotive Equipment Co., Ltd.

What is the estimated valuation of the automotive lift market by 2035?

The market is expected to reach a valuation of USD 4.9 billion by 2035.

What value CAGR is the automotive lift market exhibit over the last five years?

The historic growth rate of the automotive lift market was 11.5% from 2020 to 2024.

- Also of Interest -

Automotive HVAC Market

Automotive HVAC Market Analysis, By Type, By Technology, By Component, and Region - Market Insights 2025 to 2035

Automotive Smart Display Market

Automotive Smart Display Market Analysis, By Display Size, By Display Technology (LCD, TFT-LCD, and other Display Technology), By Application, By Vehicle Type, and Region - Market Insights 2025 to 2035

Automotive Tail Light Market

Automotive Tail Light Market Analysis, By Source, By Vehicle Type, By Material Type, By Sales Channel and Region - Market Insights 2025 to 2035

Automotive Relay Market

Automotive Relay Market Analysis, By Product, By Vehicle Type (Passenger, Commercial, Electric), By Application and Region - Market Insights 2025 to 2035

Automotive Lift Market

Schedule a Call