Automatic Barriers and Bollards Market

Automatic Barriers and Bollards Market Analysis, By Device (Automatic Boom Barriers, Automatic Bollards, and Others), By Material, By Application, By End User and Region - Market Insights 2025 to 2035

Automatic Boom Barriers is projected to grow at a CAGR of 5.2%, whereas another segment Automatic Bollards is likely to grow at 4%. In terms of countries Germany is projected to grow at 5.8%, followed by Italy at 7.1% and U.K. to grow at 6.2%

Automatic Barriers and Bollards Market Outlook (2025 to 2035)

The global automatic barriers and bollards market is expected to reach USD 2,547 million by 2035, up from USD 1,569 million in 2024. During the forecast period 2025 to 2035, the industry is projected to expand at a CAGR of 4.5%.

The automatic barriers and bollards market is gaining traction owing to the growth of security demands in urban areas, smart city infrastructure solutions and increasing levels of access control requirements.

The systems are used in essential commercial, government and transport systems, providing speedy, long-lasting, automated solutions that minimize manual intervention and increase the control of the perimeter. Investment in HVM (hostile vehicle mitigation) continues to strengthen its relevance globally.

Automatic Barriers And Bollards Market Value (USD Million) 2025 To 2035

Quick Stats for Automatic Barriers and Bollards Market

  • Industry Value (2025): USD 1,640 Million
  • Projected Value (2035): USD 2,547 Million
  • Forecast CAGR (2025 to 2035): 4.5%
  • Leading Segment (2025): Automatic Boom Barriers (36% Market Share)
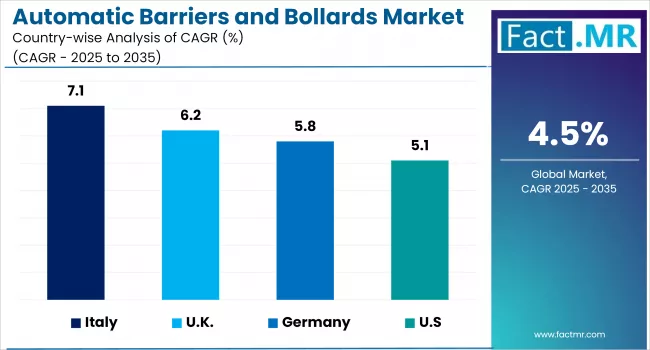
  • Growing Country (2025-2035): Italy (7.1% CAGR)
  • Key Players: Valmont Industries, Avon Barriers, Hill & Smith Holdings, and Nice S.p.A.

What are the drivers of the automatic barriers and bollards market?

The utilization of automated barrier systems in transportation, commercial, and defence sectors is increasing due to their acceptance as a mechanism of securing and controlling the movement of vehicles. Governments, thus leading to steady global demand, are pursuing perimeter security installations at strategic structures and infrastructural locations. The requirements of traffic-intensive areas for real-time access control are aiding the market growth.

The automation field is currently evolving with the incorporation of RFID, biometrics gateway, and remote control through the use of the Internet of Things, which transforms the way bollards and barriers work.

Value is added to the lifecycle by self-diagnostics and weather-proof materials found in high-end models to operate in extreme conditions. The improvements are important in sensitive facilities such as airports and government installations because uptime and reliability are essential.

This is also supported by the increasing demand caused by the rapid commercialization of urban areas and high-rise buildings that provide residential projects, creating the need for smart solutions for accessing them.

There is an awareness of hostile vehicle mitigation and counter-terrorism industries, which has elicited the formulation of regulations that enforce the deployment of retractable or hydraulic barriers. All these drivers portray a transition to a secure, intelligent, and compliant infrastructure ecosystem.

What are the regional trends of the automatic barriers and bollards market?

In Europe, regulatory enforcement and terrorism-related concerns are driving deployment of HVM-rated bollards and automatic barriers, especially in high-footfall areas. Countries like the UK, France, and Germany have introduced stringent urban protection policies promoting such technologies.

Asia Pacific showcases dynamic investment in smart city programs, with India and China leading in urban mobility and access control system deployments. The demand here is driven by large-scale infrastructural expansion and a strong push for localized manufacturing under national security frameworks.

The Middle East is increasingly focused on securing public infrastructure and oil & gas assets. Countries like the UAE and Saudi Arabia are investing in high-end automatic bollards with advanced threat response capabilities. Private-sector partnerships and premium real estate growth are further reinforcing the market’s maturity.

What are the challenges and restraining factors of the automatic barriers and bollards market?

The entry barriers are created by the high costs of installation, maintenance, and integration of automatic barriers, and bollards, which is particularly high to municipalities and small enterprises. Due to custom civil engineering, power infrastructure and software, such systems often have increased total cost of ownership.

A scalability challenge is also presented by technical complexity. The fault of compatibility with third-party security systems, poor performance of the objects in adverse weather conditions, and downtime caused by mechanical failure may rein in operations. To allow proper integration with biometric readers, license plate readers, and artificial intelligence surveillance, this process requires significant calibration and vendor support. 

Legal frameworks concerning crash certifications (e.g., ASTM, PAS68) and on safety conformance provide additional limitations. Delays in certification or unclear regulations in new markets discourage widespread use. Insufficient awareness regarding certified anti-ramming products leads to poor implementations that undermine the performance of the security, ultimately.

Country-Wise Insights

Italy is The Design-Driven Manufacturing Leader in Automatic Barrier Systems

Automatic Barriers And Bollards Market By Country

Italy is ranked as a leading contributor in the global access control system due to its vertically integrated ecosystem. The country leads in exports of full automated barrier gates, hydraulic bollards, and anti-ram systems as it holds key manufacturers including: FAAC Group, Nice S.p.A, CAME and BFT. Domestic R&D is heavily invested in small-scale motorization, electromechanical automation, and integrated smart home technologies.

The internal market indicates the high demand for transport hubs, gated communities and public infrastructure. Hostile vehicle mitigation requirements and compliance with sustainability regulations have expanded the adoption of EN-certified bollards using modular installation footprint. The intense rate of urbanization in Italy contributes to the local market demand for smart city infrastructure with automated access systems.

Italian manufacturers are expanding their distribution channels and OEM partnerships all across the Middle East and Asia Pacific. Competitive advantages of Italy include precision engineering, product aesthetics, and proprietary control systems. Its strategic manufacturing advantage is solidified by investing in cloud-based perimeter surveillance and sensor-fused hardware.

Germany is The Engineering Epicentre for Safety-Certified Barrier Solutions

Germany’s reputation for producing industrial-level protective systems extends to the automatic barrier and bollards segments, with companies such as Hoermann and Magnetic Automatic Control. These firms are recognised for high-impact resistance ratings, sophisticated control units based on microcontroller, and the green product design which emphasizes on easy recyclability of products.

The local market is driven by demand for logistics centres, business parks, and important infrastructure. Stringent public safety regulations and EU crash test requirements (PAS68, IWA-14, etc.) promote the widespread use of certified bollards and vehicle restraint systems. The German municipalities are investing in traffic-control measures and safe pedestrian zones.

Germany maintains a strong export orientation, supplying heavy-duty access control solutions to airports and industrial regions in North America and the Middle East. Product strategies focus on durability, smart diagnostics and compatibility with networked control panels. Collaborations with urban planners and transportation agencies help to increase Germany's influence as a global manufacturer.

The United Kingdom is The Strategic Exporter of HVM-Certified Bollards and Barriers

UK plays a key role in supplying anti-terrorist grade bollards and crash-tested automatic barriers by firms such as Heald, ATG Access, and Frontier Pitts. These companies specialize in electro-mechanical and hydraulic products that meet international security requirements such as ASTM F2656 and PAS68.

Government contract related to transportation and border security projects is an aspect that shapes the domestic market. Stadium, embassy and financial district high-profile deployments further support demand. The Defence and Security Accelerator (DASA) is another fund provided by the UK to implement the innovation of products to combat hostile vehicles and rapid deployment groups.

The UK manufacturers export HVM systems across the globe and are mainly dominant in Australia, countries in the GCC and Southeast Asia. With a focus on both perimeter and maintaining unrestricted movement, UK companies integrate the expertise in the field of mechatronics and rapid response engineering. The core of competitive advantage is increased simulation tests and modularity.

Category-Wise Analysis

Automatic Boom Barriers Dominate Vehicle Access Control with Smart Integration and Future-Ready Advancements

Automatic Barriers And Bollards Market By Device

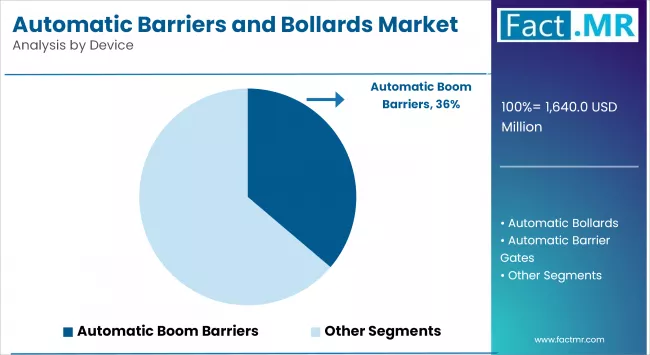
Among the available systems, automatic boom barriers lead because of their application in vehicle access control for complexes, toll gates, car parks, and industrial gates is unwavering. They are constructed in a simple manner and are easy to set up with moderate costs of maintenance, making them the choice in medium security applications. It has become common to integrate them with RFID and license plate recognition, as well as centralized command centres.

Future demand is expected to involve high-speed barriers with anti-crash technologies and the involvement of AI to help in controlling congestion. The main opportunities are based on parking automation, contactless tolling gain, and a combination with a building management system. The drivers of unit sales are countries that are witnessing escalating highway systems and vehicle traffic. The manufacturers are differentiating using arm durability, opening speed and fault diagnostics in real-time.

Automatic Bollards Rise as Discreet, High-Security Solutions with Smart Features for Urban and Sensitive Zones

Automatic bollards are increasingly being deployed at sensitive sites in urban areas and government settings where retractable barriers in the form of crash-resistant and discreet access controls are required. They have the capability to offer concealed active defence, which makes them fundamental in embassy areas, pedestrian-oriented urban areas, and business campuses.

The outlook centres on smart control features of hydraulic auto-reset, programmable operations, scheduling features, and threat recognition. As cities get more urbanized, their popularity is expanding to gated residential and financial hubs. The single-point, automatic bollards are infiltrating anti-terrorist measures and vehicle intrusion prevention systems with certified performance along with low-visibility street-level designs.

Competitive Analysis

Key players in the automatic barriers and bollards industry include Valmont Industries, Avon Barriers, Hill & Smith Holdings, Nice S.p.A., CAME S.p.A., FAAC Group, Newgate, Tiso Turnstiles, Heald, ATG Access, Hormann, and Magnetic Autocontrol.

High engineering capabilities in value, portfolio breadth, and international standards of certification are the determinants of the competitive environment. Proprietary automation protocols, smart diagnostics and crash-rated products are employed to differentiate leading market participants. The ability to deliver design solutions with maintenance-free denial features is critical in securing contracts in urban and infrastructure markets.

The smart cities and transport hubs represent areas of heightened competition with product default priorities being integration flexibility and threat resilience by buyers. Companies are implementing advancements in Internet of Things functionality, electromechanical hybridizations and product miniaturization. The regional actors are oriented to price competitiveness, while global manufacturers strengthen their positions through collaborations with government bodies and airport authorities.

Recent Development

  • In May 2025, Magnetic Autocontrol Ltda., the Brazilian arm of FAAC S.p.A., announced its acquisition of Wolpac Sistemas de Controle Ltda., Brazil’s leading manufacturer of pedestrian-entrance and access-control solutions. The deal strengthened FAAC’s presence in Latin America, adding a 200-employee production base and extensive sales channels.
  • In January 2025, Belgium-based Automatic Systems debuted ASLYNK™, a SaaS remote-management platform that allowed operators to supervise up to 500 access-control lanes across multiple sites. Running on encrypted LAN links, ASLYNK offered live status dashboards, automated mode switching, rule-based alarms, and detailed usage analytics. The solution extended equipment life through proactive diagnostics, enabling facility managers to have real-time control from any global location.

Fact.MR has provided detailed information about the price points of key manufacturers of the Automatic Barriers and Bollards Market positioned across regions, sales growth, production capacity, and speculative technological expansion, in the recently published report.

Methodology and Industry Tracking Approach

The 2025 automatic barriers and bollards market report by Fact.MR is based on insights collected from 1,200 stakeholders across 12 countries, with a minimum of 75 respondents per country. Among the participants, 65% were end users including transport infrastructure managers, facility heads, and construction consultants while the remaining 35% included procurement leads, civil planners, urban security consultants, and automation integrators.

Data collection was conducted between July 2024 and June 2025, with a focus on critical parameters such as deployment reliability, crash certification compliance, integration capabilities, durability in extreme environments, and automation upgrade potential. A regionally balanced calibration model ensured accurate representation across key markets in North America, Europe, and Asia Pacific.

The study draws from over 95 validated sources, including regulatory filings, urban security frameworks, tender documents, equipment specification sheets, and trade association reports. All sources were rigorously triangulated to produce reliable estimates and robust, actionable insights for stakeholders across the value chain.

Fact.MR applied rigorous analytical tools such as multi-variable regression and scenario modeling to ensure data robustness. With continuous monitoring of the glass adhesives space since 2018, this report offers a comprehensive roadmap for firms seeking competitive advantage, innovation, and sustainable growth within the sector.

Segmentation of Automatic Barriers and Bollards Market

  • By Device :

    • Automatic Boom Barriers
    • Automatic Bollards
    • Automatic Barrier Gates
    • Automatic Height Restrictor Barriers
  • By Material :

    • Automatic Aluminium Barriers
    • Automatic Steel Barriers
    • Automatic Iron Barriers
  • By Application :

    • Railway Crossings
    • Toll Plazas
    • Airports
    • Perimeter Security
    • Others
  • By End User :

    • Residential Automatic Barriers
    • Commercial Automatic Barriers
      • Retail Sector
      • Corporate & Commercial Buildings / Parks
      • Education & Research Institutes
      • Hospitality Sector
      • Healthcare Facilities
      • Sports Stadiums / Arenas
      • Industrial & Manufacturing
      • Warehouses & Distribution
      • Others
    • Automatic Barriers for Government
  • By Region :

    • North America
    • Latin America
    • Western Europe
    • Eastern Europe
    • East Asia
    • South Asia & Pacific
    • Middle East & Africa

Table of Content

  1. Executive Summary
    • Global Market Outlook
    • Demand-side Trends
    • Supply-side Trends
    • Technology Roadmap Analysis
    • Analysis and Recommendations
  2. Market Overview
    • Market Coverage / Taxonomy
    • Market Definition / Scope / Limitations
  3. Market Background
    • Market Dynamics
      • Drivers
      • Restraints
      • Opportunity
      • Trends
    • Scenario Forecast
      • Demand in Optimistic Scenario
      • Demand in Likely Scenario
      • Demand in Conservative Scenario
    • Opportunity Map Analysis
    • Product Life Cycle Analysis
    • Supply Chain Analysis
      • Supply Side Participants and their Roles
        • Producers
        • Mid-Level Participants (Traders/ Agents/ Brokers)
        • Wholesalers and Distributors
      • Value Added and Value Created at Node in the Supply Chain
      • List of Component Suppliers
      • List of Existing and Potential Buyers
    • Investment Feasibility Matrix
    • Value Chain Analysis
      • Profit Margin Analysis
      • Wholesalers and Distributors
    • PESTLE and Porter’s Analysis
    • Regulatory Landscape
      • By Key Regions
      • By Key Countries
    • Production and Consumption Statistics
    • Import and Export Statistics
  4. Global Market Analysis 2020-2024 and Forecast, 2025-2035
    • Historical Market Size Value (USD Mn) & Volume (Units) Analysis, 2020-2024
    • Current and Future Market Size Value (USD Mn) & Volume (Units) Projections, 2025-2035
      • Y-o-Y Growth Trend Analysis
      • Absolute $ Opportunity Analysis
  5. Global Market Pricing Analysis 2020-2024 and Forecast 2025-2035
  6. Global Market Analysis 2020-2024 and Forecast 2025-2035, By Device
    • Introduction / Key Findings
    • Historical Market Size Value (USD Mn) & Volume (Units) Analysis By Device, 2020-2024
    • Current and Future Market Size Value (USD Mn) & Volume (Units) Analysis and Forecast By Device, 2025-2035
      • Automatic Boom Barriers
      • Automatic Bollards
      • Automatic Barrier Gates
      • Automatic Height Restrictor Barriers
    • Y-o-Y Growth Trend Analysis By Device, 2020-2024
    • Absolute $ Opportunity Analysis By Device, 2025-2035
  7. Global Market Analysis 2020-2024 and Forecast 2025-2035, By Material
    • Introduction / Key Findings
    • Historical Market Size Value (USD Mn) & Volume (Units) Analysis By Material, 2020-2024
    • Current and Future Market Size Value (USD Mn) & Volume (Units) Analysis and Forecast By Material, 2025-2035
      • Automatic Aluminium Barriers
      • Automatic Steel Barriers
      • Automatic Iron Barriers
    • Y-o-Y Growth Trend Analysis By Material, 2020-2024
    • Absolute $ Opportunity Analysis By Material, 2025-2035
  8. Global Market Analysis 2020-2024 and Forecast 2025-2035, By Application
    • Introduction / Key Findings
    • Historical Market Size Value (USD Mn) & Volume (Units) Analysis By Application, 2020-2024
    • Current and Future Market Size Value (USD Mn) & Volume (Units) Analysis and Forecast By Application, 2025-2035
      • Railway Crossings
      • Toll Plazas
      • Airports
      • Perimeter Security
      • Others
    • Y-o-Y Growth Trend Analysis By Application, 2020-2024
    • Absolute $ Opportunity Analysis By Application, 2025-2035
  9. Global Market Analysis 2020-2024 and Forecast 2025-2035, By End User
    • Introduction / Key Findings
    • Historical Market Size Value (USD Mn) & Volume (Units) Analysis By End User, 2020-2024
    • Current and Future Market Size Value (USD Mn) & Volume (Units) Analysis and Forecast By End User, 2025-2035
      • Residential Automatic Barriers
      • Commercial Automatic Barriers
      • Automatic Barriers for Government
    • Y-o-Y Growth Trend Analysis By End User, 2020-2024
    • Absolute $ Opportunity Analysis By End User, 2025-2035
  10. Global Market Analysis 2020-2024 and Forecast 2025-2035, By Region
    • Introduction
    • Historical Market Size Value (USD Mn) & Volume (Units) Analysis By Region, 2020-2024
    • Current Market Size Value (USD Mn) & Volume (Units) Analysis and Forecast By Region, 2025-2035
      • North America
      • Latin America
      • Western Europe
      • East Asia
      • South Asia Pacific
      • Eastern Europe
      • Middle East & Africa
    • Market Attractiveness Analysis By Region
  11. North America Market Analysis 2020-2024 and Forecast 2025-2035, By Country
    • Historical Market Size Value (USD Mn) & Volume (Units) Trend Analysis By Market Taxonomy, 2020-2024
    • Market Size Value (USD Mn) & Volume (Units) Forecast By Market Taxonomy, 2025-2035
      • By Country
        • U.S.
        • Canada
        • Mexico
      • By Device
      • By Material
      • By Application
      • By End User
    • Market Attractiveness Analysis
      • By Country
      • By Device
      • By Material
      • By Application
      • By End User
    • Key Takeaways
  12. Latin America Market Analysis 2020-2024 and Forecast 2025-2035, By Country
    • Historical Market Size Value (USD Mn) & Volume (Units) Trend Analysis By Market Taxonomy, 2020-2024
    • Market Size Value (USD Mn) & Volume (Units) Forecast By Market Taxonomy, 2025-2035
      • By Country
        • Brazil
        • Chile
        • Rest of Latin America
      • By Device
      • By Material
      • By Application
      • By End User
    • Market Attractiveness Analysis
      • By Country
      • By Device
      • By Material
      • By Application
      • By End User
    • Key Takeaways
  13. Western Europe Market Analysis 2020-2024 and Forecast 2025-2035, By Country
    • Historical Market Size Value (USD Mn) & Volume (Units) Trend Analysis By Market Taxonomy, 2020-2024
    • Market Size Value (USD Mn) & Volume (Units) Forecast By Market Taxonomy, 2025-2035
      • By Country
        • Germany
        • Italy
        • France
        • U.K.
        • Spain
        • Russia
        • BENELUX
        • Rest of Europe
      • By Device
      • By Material
      • By Application
      • By End User
    • Market Attractiveness Analysis
      • By Country
      • By Device
      • By Material
      • By Application
      • By End User
    • Key Takeaways
  14. East Asia Market Analysis 2020-2024 and Forecast 2025-2035, By Country
    • Historical Market Size Value (USD Mn) & Volume (Units) Trend Analysis By Market Taxonomy, 2020-2024
    • Market Size Value (USD Mn) & Volume (Units) Forecast By Market Taxonomy, 2025-2035
      • By Country
        • China
        • Japan
        • South Korea
      • By Device
      • By Material
      • By Application
      • By End User
    • Market Attractiveness Analysis
      • By Country
      • By Device
      • By Material
      • By Application
      • By End User
    • Key Takeaways
  15. South Asia Pacific Market Analysis 2020-2024 and Forecast 2025-2035, By Country
    • Historical Market Size Value (USD Mn) & Volume (Units) Trend Analysis By Market Taxonomy, 2020-2024
    • Market Size Value (USD Mn) & Volume (Units) Forecast By Market Taxonomy, 2025-2035
      • By Country
        • India
        • ASEAN Countries
        • Australia & New Zealand
        • Rest of South Asia Pacific
      • By Device
      • By Material
      • By Application
      • By End User
    • Market Attractiveness Analysis
      • By Country
      • By Device
      • By Material
      • By Application
      • By End User
    • Key Takeaways
  16. Eastern Europe Market Analysis 2020-2024 and Forecast 2025-2035, By Country
    • Historical Market Size Value (USD Mn) & Volume (Units) Trend Analysis By Market Taxonomy, 2020-2024
    • Market Size Value (USD Mn) & Volume (Units) Forecast By Market Taxonomy, 2025-2035
      • By Country
        • Russia
        • Poland
        • Hungary
        • Balkan & Baltics
        • Rest of Eastern Europe
      • By Device
      • By Material
      • By Application
      • By End User
    • Market Attractiveness Analysis
      • By Country
      • By Device
      • By Material
      • By Application
      • By End User
    • Key Takeaways
  17. Middle East & Africa Market Analysis 2020-2024 and Forecast 2025-2035, By Country
    • Historical Market Size Value (USD Mn) & Volume (Units) Trend Analysis By Market Taxonomy, 2020-2024
    • Market Size Value (USD Mn) & Volume (Units) Forecast By Market Taxonomy, 2025-2035
      • By Country
        • KSA
        • Other GCC Countries
        • Turkiye
        • South Africa
        • Rest of MEA
      • By Device
      • By Material
      • By Application
      • By End User
    • Market Attractiveness Analysis
      • By Country
      • By Device
      • By Material
      • By Application
      • By End User
    • Key Takeaways
  18. Key Countries Market Analysis
    • Italy
      • Pricing Analysis
      • Market Share Analysis, 2024
        • By Device
        • By Material
        • By Application
        • By End User
    • Germany
      • Pricing Analysis
      • Market Share Analysis, 2024
        • By Device
        • By Material
        • By Application
        • By End User
    • U.K.
      • Pricing Analysis
      • Market Share Analysis, 2024
        • By Device
        • By Material
        • By Application
        • By End User
    • U.S.
      • Pricing Analysis
      • Market Share Analysis, 2024
        • By Device
        • By Material
        • By Application
        • By End User
  19. Market Structure Analysis
    • Competition Dashboard
    • Competition Benchmarking
    • Market Share Analysis of Top Players
      • By Regional
      • By Device
      • By Material
      • By Application
      • By End User
  20. Competition Analysis
    • Competition Deep Dive
      • Valmont Industries
        • Overview
        • Product Portfolio
        • Profitability by Market Segments (Product/Age /Sales Channel/Region)
        • Sales Footprint
        • Strategy Overview
          • Marketing Strategy
          • Product Strategy
          • Channel Strategy
      • Avon Barriers
        • Overview
        • Product Portfolio
        • Profitability by Market Segments (Product/Age /Sales Channel/Region)
        • Sales Footprint
        • Strategy Overview
          • Marketing Strategy
          • Product Strategy
          • Channel Strategy
      • Hill & Smith Holdings
        • Overview
        • Product Portfolio
        • Profitability by Market Segments (Product/Age /Sales Channel/Region)
        • Sales Footprint
        • Strategy Overview
          • Marketing Strategy
          • Product Strategy
          • Channel Strategy
      • Nice S.p.A.
        • Overview
        • Product Portfolio
        • Profitability by Market Segments (Product/Age /Sales Channel/Region)
        • Sales Footprint
        • Strategy Overview
          • Marketing Strategy
          • Product Strategy
          • Channel Strategy
      • CAME S.p.A.
        • Overview
        • Product Portfolio
        • Profitability by Market Segments (Product/Age /Sales Channel/Region)
        • Sales Footprint
        • Strategy Overview
          • Marketing Strategy
          • Product Strategy
          • Channel Strategy
      • FAAC Group
        • Overview
        • Product Portfolio
        • Profitability by Market Segments (Product/Age /Sales Channel/Region)
        • Sales Footprint
        • Strategy Overview
          • Marketing Strategy
          • Product Strategy
          • Channel Strategy
      • Newgate
        • Overview
        • Product Portfolio
        • Profitability by Market Segments (Product/Age /Sales Channel/Region)
        • Sales Footprint
        • Strategy Overview
          • Marketing Strategy
          • Product Strategy
          • Channel Strategy
      • Tiso Turnstiles
        • Overview
        • Product Portfolio
        • Profitability by Market Segments (Product/Age /Sales Channel/Region)
        • Sales Footprint
        • Strategy Overview
          • Marketing Strategy
          • Product Strategy
          • Channel Strategy
      • Heald
        • Overview
        • Product Portfolio
        • Profitability by Market Segments (Product/Age /Sales Channel/Region)
        • Sales Footprint
        • Strategy Overview
          • Marketing Strategy
          • Product Strategy
          • Channel Strategy
      • ATG Access
        • Overview
        • Product Portfolio
        • Profitability by Market Segments (Product/Age /Sales Channel/Region)
        • Sales Footprint
        • Strategy Overview
          • Marketing Strategy
          • Product Strategy
          • Channel Strategy
      • Hormann
        • Overview
        • Product Portfolio
        • Profitability by Market Segments (Product/Age /Sales Channel/Region)
        • Sales Footprint
        • Strategy Overview
          • Marketing Strategy
          • Product Strategy
          • Channel Strategy
      • Magnetic Autocontrol
        • Overview
        • Product Portfolio
        • Profitability by Market Segments (Product/Age /Sales Channel/Region)
        • Sales Footprint
        • Strategy Overview
          • Marketing Strategy
          • Product Strategy
          • Channel Strategy
      • ELKA-Torantriebe
        • Overview
        • Product Portfolio
        • Profitability by Market Segments (Product/Age /Sales Channel/Region)
        • Sales Footprint
        • Strategy Overview
          • Marketing Strategy
          • Product Strategy
          • Channel Strategy
      • Other Market Players
        • Overview
        • Product Portfolio
        • Profitability by Market Segments (Product/Age /Sales Channel/Region)
        • Sales Footprint
        • Strategy Overview
          • Marketing Strategy
          • Product Strategy
          • Channel Strategy
  21. Assumptions & Acronyms Used
  22. Research Methodology

List Of Table

  • Table 1: Global Market Value (USD Mn) Forecast by Region, 2020 to 2035
  • Table 2: Global Market Volume (Units) Forecast by Region, 2020 to 2035
  • Table 3: Global Market Value (USD Mn) Forecast by Device, 2020 to 2035
  • Table 4: Global Market Volume (Units) Forecast by Device, 2020 to 2035
  • Table 5: Global Market Value (USD Mn) Forecast by Material, 2020 to 2035
  • Table 6: Global Market Volume (Units) Forecast by Material, 2020 to 2035
  • Table 7: Global Market Value (USD Mn) Forecast by Application, 2020 to 2035
  • Table 8: Global Market Volume (Units) Forecast by Application, 2020 to 2035
  • Table 9: Global Market Value (USD Mn) Forecast by End User, 2020 to 2035
  • Table 10: Global Market Volume (Units) Forecast by End User, 2020 to 2035
  • Table 11: North America Market Value (USD Mn) Forecast by Country, 2020 to 2035
  • Table 12: North America Market Volume (Units) Forecast by Country, 2020 to 2035
  • Table 13: North America Market Value (USD Mn) Forecast by Device, 2020 to 2035
  • Table 14: North America Market Volume (Units) Forecast by Device, 2020 to 2035
  • Table 15: North America Market Value (USD Mn) Forecast by Material, 2020 to 2035
  • Table 16: North America Market Volume (Units) Forecast by Material, 2020 to 2035
  • Table 17: North America Market Value (USD Mn) Forecast by Application, 2020 to 2035
  • Table 18: North America Market Volume (Units) Forecast by Application, 2020 to 2035
  • Table 19: North America Market Value (USD Mn) Forecast by End User, 2020 to 2035
  • Table 20: North America Market Volume (Units) Forecast by End User, 2020 to 2035
  • Table 21: Latin America Market Value (USD Mn) Forecast by Country, 2020 to 2035
  • Table 22: Latin America Market Volume (Units) Forecast by Country, 2020 to 2035
  • Table 23: Latin America Market Value (USD Mn) Forecast by Device, 2020 to 2035
  • Table 24: Latin America Market Volume (Units) Forecast by Device, 2020 to 2035
  • Table 25: Latin America Market Value (USD Mn) Forecast by Material, 2020 to 2035
  • Table 26: Latin America Market Volume (Units) Forecast by Material, 2020 to 2035
  • Table 27: Latin America Market Value (USD Mn) Forecast by Application, 2020 to 2035
  • Table 28: Latin America Market Volume (Units) Forecast by Application, 2020 to 2035
  • Table 29: Latin America Market Value (USD Mn) Forecast by End User, 2020 to 2035
  • Table 30: Latin America Market Volume (Units) Forecast by End User, 2020 to 2035
  • Table 31: Western Europe Market Value (USD Mn) Forecast by Country, 2020 to 2035
  • Table 32: Western Europe Market Volume (Units) Forecast by Country, 2020 to 2035
  • Table 33: Western Europe Market Value (USD Mn) Forecast by Device, 2020 to 2035
  • Table 34: Western Europe Market Volume (Units) Forecast by Device, 2020 to 2035
  • Table 35: Western Europe Market Value (USD Mn) Forecast by Material, 2020 to 2035
  • Table 36: Western Europe Market Volume (Units) Forecast by Material, 2020 to 2035
  • Table 37: Western Europe Market Value (USD Mn) Forecast by Application, 2020 to 2035
  • Table 38: Western Europe Market Volume (Units) Forecast by Application, 2020 to 2035
  • Table 39: Western Europe Market Value (USD Mn) Forecast by End User, 2020 to 2035
  • Table 40: Western Europe Market Volume (Units) Forecast by End User, 2020 to 2035
  • Table 41: East Asia Market Value (USD Mn) Forecast by Country, 2020 to 2035
  • Table 42: East Asia Market Volume (Units) Forecast by Country, 2020 to 2035
  • Table 43: East Asia Market Value (USD Mn) Forecast by Device, 2020 to 2035
  • Table 44: East Asia Market Volume (Units) Forecast by Device, 2020 to 2035
  • Table 45: East Asia Market Value (USD Mn) Forecast by Material, 2020 to 2035
  • Table 46: East Asia Market Volume (Units) Forecast by Material, 2020 to 2035
  • Table 47: East Asia Market Value (USD Mn) Forecast by Application, 2020 to 2035
  • Table 48: East Asia Market Volume (Units) Forecast by Application, 2020 to 2035
  • Table 49: East Asia Market Value (USD Mn) Forecast by End User, 2020 to 2035
  • Table 50: East Asia Market Volume (Units) Forecast by End User, 2020 to 2035
  • Table 51: South Asia Pacific Market Value (USD Mn) Forecast by Country, 2020 to 2035
  • Table 52: South Asia Pacific Market Volume (Units) Forecast by Country, 2020 to 2035
  • Table 53: South Asia Pacific Market Value (USD Mn) Forecast by Device, 2020 to 2035
  • Table 54: South Asia Pacific Market Volume (Units) Forecast by Device, 2020 to 2035
  • Table 55: South Asia Pacific Market Value (USD Mn) Forecast by Material, 2020 to 2035
  • Table 56: South Asia Pacific Market Volume (Units) Forecast by Material, 2020 to 2035
  • Table 57: South Asia Pacific Market Value (USD Mn) Forecast by Application, 2020 to 2035
  • Table 58: South Asia Pacific Market Volume (Units) Forecast by Application, 2020 to 2035
  • Table 59: South Asia Pacific Market Value (USD Mn) Forecast by End User, 2020 to 2035
  • Table 60: South Asia Pacific Market Volume (Units) Forecast by End User, 2020 to 2035
  • Table 61: Eastern Europe Market Value (USD Mn) Forecast by Country, 2020 to 2035
  • Table 62: Eastern Europe Market Volume (Units) Forecast by Country, 2020 to 2035
  • Table 63: Eastern Europe Market Value (USD Mn) Forecast by Device, 2020 to 2035
  • Table 64: Eastern Europe Market Volume (Units) Forecast by Device, 2020 to 2035
  • Table 65: Eastern Europe Market Value (USD Mn) Forecast by Material, 2020 to 2035
  • Table 66: Eastern Europe Market Volume (Units) Forecast by Material, 2020 to 2035
  • Table 67: Eastern Europe Market Value (USD Mn) Forecast by Application, 2020 to 2035
  • Table 68: Eastern Europe Market Volume (Units) Forecast by Application, 2020 to 2035
  • Table 69: Eastern Europe Market Value (USD Mn) Forecast by End User, 2020 to 2035
  • Table 70: Eastern Europe Market Volume (Units) Forecast by End User, 2020 to 2035
  • Table 71: Middle East & Africa Market Value (USD Mn) Forecast by Country, 2020 to 2035
  • Table 72: Middle East & Africa Market Volume (Units) Forecast by Country, 2020 to 2035
  • Table 73: Middle East & Africa Market Value (USD Mn) Forecast by Device, 2020 to 2035
  • Table 74: Middle East & Africa Market Volume (Units) Forecast by Device, 2020 to 2035
  • Table 75: Middle East & Africa Market Value (USD Mn) Forecast by Material, 2020 to 2035
  • Table 76: Middle East & Africa Market Volume (Units) Forecast by Material, 2020 to 2035
  • Table 77: Middle East & Africa Market Value (USD Mn) Forecast by Application, 2020 to 2035
  • Table 78: Middle East & Africa Market Volume (Units) Forecast by Application, 2020 to 2035
  • Table 79: Middle East & Africa Market Value (USD Mn) Forecast by End User, 2020 to 2035
  • Table 80: Middle East & Africa Market Volume (Units) Forecast by End User, 2020 to 2035

List Of Figures

  • Figure 1: Global Market Volume (Units) Forecast 2020 to 2035
  • Figure 2: Global Market Pricing Analysis
  • Figure 3: Global Market Value (USD Mn) Forecast 2020 to 2035
  • Figure 4: Global Market Value Share and BPS Analysis by Device, 2025 and 2035
  • Figure 5: Global Market Y-o-Y Growth Comparison by Device, 2025 to 2035
  • Figure 6: Global Market Attractiveness Analysis by Device
  • Figure 7: Global Market Value Share and BPS Analysis by Material, 2025 and 2035
  • Figure 8: Global Market Y-o-Y Growth Comparison by Material, 2025 to 2035
  • Figure 9: Global Market Attractiveness Analysis by Material
  • Figure 10: Global Market Value Share and BPS Analysis by Application, 2025 and 2035
  • Figure 11: Global Market Y-o-Y Growth Comparison by Application, 2025 to 2035
  • Figure 12: Global Market Attractiveness Analysis by Application
  • Figure 13: Global Market Value Share and BPS Analysis by End User, 2025 and 2035
  • Figure 14: Global Market Y-o-Y Growth Comparison by End User, 2025 to 2035
  • Figure 15: Global Market Attractiveness Analysis by End User
  • Figure 16: Global Market Value (USD Mn) Share and BPS Analysis by Region, 2025 and 2035
  • Figure 17: Global Market Y-o-Y Growth Comparison by Region, 2025 to 2035
  • Figure 18: Global Market Attractiveness Analysis by Region
  • Figure 19: North America Market Incremental $ Opportunity, 2025 to 2035
  • Figure 20: Latin America Market Incremental $ Opportunity, 2025 to 2035
  • Figure 21: Western Europe Market Incremental $ Opportunity, 2025 to 2035
  • Figure 22: East Asia Market Incremental $ Opportunity, 2025 to 2035
  • Figure 23: South Asia Pacific Market Incremental $ Opportunity, 2025 to 2035
  • Figure 24: Eastern Europe Market Incremental $ Opportunity, 2025 to 2035
  • Figure 25: Middle East & Africa Market Incremental $ Opportunity, 2025 to 2035
  • Figure 26: North America Market Value Share and BPS Analysis by Country, 2025 and 2035
  • Figure 27: North America Market Value Share and BPS Analysis by Device, 2025 and 2035
  • Figure 28: North America Market Y-o-Y Growth Comparison by Device, 2025 to 2035
  • Figure 29: North America Market Attractiveness Analysis by Device
  • Figure 30: North America Market Value Share and BPS Analysis by Material, 2025 and 2035
  • Figure 31: North America Market Y-o-Y Growth Comparison by Material, 2025 to 2035
  • Figure 32: North America Market Attractiveness Analysis by Material
  • Figure 33: North America Market Value Share and BPS Analysis by Application, 2025 and 2035
  • Figure 34: North America Market Y-o-Y Growth Comparison by Application, 2025 to 2035
  • Figure 35: North America Market Attractiveness Analysis by Application
  • Figure 36: North America Market Value Share and BPS Analysis by End User, 2025 and 2035
  • Figure 37: North America Market Y-o-Y Growth Comparison by End User, 2025 to 2035
  • Figure 38: North America Market Attractiveness Analysis by End User
  • Figure 39: Latin America Market Value Share and BPS Analysis by Country, 2025 and 2035
  • Figure 40: Latin America Market Value Share and BPS Analysis by Device, 2025 and 2035
  • Figure 41: Latin America Market Y-o-Y Growth Comparison by Device, 2025 to 2035
  • Figure 42: Latin America Market Attractiveness Analysis by Device
  • Figure 43: Latin America Market Value Share and BPS Analysis by Material, 2025 and 2035
  • Figure 44: Latin America Market Y-o-Y Growth Comparison by Material, 2025 to 2035
  • Figure 45: Latin America Market Attractiveness Analysis by Material
  • Figure 46: Latin America Market Value Share and BPS Analysis by Application, 2025 and 2035
  • Figure 47: Latin America Market Y-o-Y Growth Comparison by Application, 2025 to 2035
  • Figure 48: Latin America Market Attractiveness Analysis by Application
  • Figure 49: Latin America Market Value Share and BPS Analysis by End User, 2025 and 2035
  • Figure 50: Latin America Market Y-o-Y Growth Comparison by End User, 2025 to 2035
  • Figure 51: Latin America Market Attractiveness Analysis by End User
  • Figure 52: Western Europe Market Value Share and BPS Analysis by Country, 2025 and 2035
  • Figure 53: Western Europe Market Value Share and BPS Analysis by Device, 2025 and 2035
  • Figure 54: Western Europe Market Y-o-Y Growth Comparison by Device, 2025 to 2035
  • Figure 55: Western Europe Market Attractiveness Analysis by Device
  • Figure 56: Western Europe Market Value Share and BPS Analysis by Material, 2025 and 2035
  • Figure 57: Western Europe Market Y-o-Y Growth Comparison by Material, 2025 to 2035
  • Figure 58: Western Europe Market Attractiveness Analysis by Material
  • Figure 59: Western Europe Market Value Share and BPS Analysis by Application, 2025 and 2035
  • Figure 60: Western Europe Market Y-o-Y Growth Comparison by Application, 2025 to 2035
  • Figure 61: Western Europe Market Attractiveness Analysis by Application
  • Figure 62: Western Europe Market Value Share and BPS Analysis by End User, 2025 and 2035
  • Figure 63: Western Europe Market Y-o-Y Growth Comparison by End User, 2025 to 2035
  • Figure 64: Western Europe Market Attractiveness Analysis by End User
  • Figure 65: East Asia Market Value Share and BPS Analysis by Country, 2025 and 2035
  • Figure 66: East Asia Market Value Share and BPS Analysis by Device, 2025 and 2035
  • Figure 67: East Asia Market Y-o-Y Growth Comparison by Device, 2025 to 2035
  • Figure 68: East Asia Market Attractiveness Analysis by Device
  • Figure 69: East Asia Market Value Share and BPS Analysis by Material, 2025 and 2035
  • Figure 70: East Asia Market Y-o-Y Growth Comparison by Material, 2025 to 2035
  • Figure 71: East Asia Market Attractiveness Analysis by Material
  • Figure 72: East Asia Market Value Share and BPS Analysis by Application, 2025 and 2035
  • Figure 73: East Asia Market Y-o-Y Growth Comparison by Application, 2025 to 2035
  • Figure 74: East Asia Market Attractiveness Analysis by Application
  • Figure 75: East Asia Market Value Share and BPS Analysis by End User, 2025 and 2035
  • Figure 76: East Asia Market Y-o-Y Growth Comparison by End User, 2025 to 2035
  • Figure 77: East Asia Market Attractiveness Analysis by End User
  • Figure 78: South Asia Pacific Market Value Share and BPS Analysis by Country, 2025 and 2035
  • Figure 79: South Asia Pacific Market Value Share and BPS Analysis by Device, 2025 and 2035
  • Figure 80: South Asia Pacific Market Y-o-Y Growth Comparison by Device, 2025 to 2035
  • Figure 81: South Asia Pacific Market Attractiveness Analysis by Device
  • Figure 82: South Asia Pacific Market Value Share and BPS Analysis by Material, 2025 and 2035
  • Figure 83: South Asia Pacific Market Y-o-Y Growth Comparison by Material, 2025 to 2035
  • Figure 84: South Asia Pacific Market Attractiveness Analysis by Material
  • Figure 85: South Asia Pacific Market Value Share and BPS Analysis by Application, 2025 and 2035
  • Figure 86: South Asia Pacific Market Y-o-Y Growth Comparison by Application, 2025 to 2035
  • Figure 87: South Asia Pacific Market Attractiveness Analysis by Application
  • Figure 88: South Asia Pacific Market Value Share and BPS Analysis by End User, 2025 and 2035
  • Figure 89: South Asia Pacific Market Y-o-Y Growth Comparison by End User, 2025 to 2035
  • Figure 90: South Asia Pacific Market Attractiveness Analysis by End User
  • Figure 91: Eastern Europe Market Value Share and BPS Analysis by Country, 2025 and 2035
  • Figure 92: Eastern Europe Market Value Share and BPS Analysis by Device, 2025 and 2035
  • Figure 93: Eastern Europe Market Y-o-Y Growth Comparison by Device, 2025 to 2035
  • Figure 94: Eastern Europe Market Attractiveness Analysis by Device
  • Figure 95: Eastern Europe Market Value Share and BPS Analysis by Material, 2025 and 2035
  • Figure 96: Eastern Europe Market Y-o-Y Growth Comparison by Material, 2025 to 2035
  • Figure 97: Eastern Europe Market Attractiveness Analysis by Material
  • Figure 98: Eastern Europe Market Value Share and BPS Analysis by Application, 2025 and 2035
  • Figure 99: Eastern Europe Market Y-o-Y Growth Comparison by Application, 2025 to 2035
  • Figure 100: Eastern Europe Market Attractiveness Analysis by Application
  • Figure 101: Eastern Europe Market Value Share and BPS Analysis by End User, 2025 and 2035
  • Figure 102: Eastern Europe Market Y-o-Y Growth Comparison by End User, 2025 to 2035
  • Figure 103: Eastern Europe Market Attractiveness Analysis by End User
  • Figure 104: Middle East & Africa Market Value Share and BPS Analysis by Country, 2025 and 2035
  • Figure 105: Middle East & Africa Market Value Share and BPS Analysis by Device, 2025 and 2035
  • Figure 106: Middle East & Africa Market Y-o-Y Growth Comparison by Device, 2025 to 2035
  • Figure 107: Middle East & Africa Market Attractiveness Analysis by Device
  • Figure 108: Middle East & Africa Market Value Share and BPS Analysis by Material, 2025 and 2035
  • Figure 109: Middle East & Africa Market Y-o-Y Growth Comparison by Material, 2025 to 2035
  • Figure 110: Middle East & Africa Market Attractiveness Analysis by Material
  • Figure 111: Middle East & Africa Market Value Share and BPS Analysis by Application, 2025 and 2035
  • Figure 112: Middle East & Africa Market Y-o-Y Growth Comparison by Application, 2025 to 2035
  • Figure 113: Middle East & Africa Market Attractiveness Analysis by Application
  • Figure 114: Middle East & Africa Market Value Share and BPS Analysis by End User, 2025 and 2035
  • Figure 115: Middle East & Africa Market Y-o-Y Growth Comparison by End User, 2025 to 2035
  • Figure 116: Middle East & Africa Market Attractiveness Analysis by End User
  • Figure 117: Global Market - Tier Structure Analysis
  • Figure 118: Global Market - Company Share Analysis

- FAQs -

What was the Global Automatic Barriers and Bollards Market Size Reported by Fact.MR for 2025?

The global automatic barriers and bollards market was valued at USD 1,640 million in 2025.

Who are the Major Players Operating in the Automatic Barriers and Bollards Market?

Prominent players in the market are Valmont Industries, Avon Barriers, Hill & Smith Holdings, Nice S.p.A., among others.

What is the Estimated Valuation of the Automatic Barriers and Bollards Market in 2035?

The market is expected to reach a valuation of USD 2,547 million in 2035.

What Value CAGR did the Automatic Barriers and Bollards Market Exhibit Over the Last Five Years?

The historic growth rate of the automatic barriers and bollards market was 3.8% from 2020-2024.

Automatic Barriers and Bollards Market

Schedule a Call