Tie Layer Resins Market (2023 - 2033)

Tie Layer Resins Market Analysis, By Type (Reactive, Non-reactive), By Base Resin (HDPE, LDPE, LLDPE, EVA, PP, Others (SEBS & Others)) and Region - Market Insights 2023 to 2033

Core Findings

    Tie Layer Resins Market Growth Outlook (2023 to 2033)

    The global tie layer resins market is set to estimate a valuation of US$ 2.3 billion in 2023 and it is estimated to grow at a CAGR of 5.2% to reach US$ 3.8 billion by the end of 2033.

    Tie layer resins are suitable for a wide range of processes, including extrusion blown, blow molding, coating, cast film, extrusion, sheet, lamination, thermoforming, and other specialized processes. The composition of tie layer resins is calculated using the resin matrix depending on the material demand. The need for high-performance materials for various end-use applications is driving the demand for tie layer resins in the plastics sector.

    Report Attributes Details
    Tie Layer Resins Market Size (2022A) US$ 2.2 Billion
    Estimated Market Value (2023E) US$ 2.3 Billion
    Forecasted Market Value (2033F) US$ 3.8 Billion
    Global Market Growth Rate (2023 to 2033) 5.2%
    North America Market Share (2023) 21.4%
    East Asia Market Share (2023) 31.6%
    Key Companies Profiled Arkema SA; Dow Inc.; Kraton Corporation; LyondellBasell; Mitsubishi Chemical Corporation; Mitsui Chemicals; SK Functional Polymers

    Sales Analysis: Historic to Futuristic

    Tie layer resins are a type of polyolefin that has undergone chemical modification and is used as an extrudable adhesive in coating processes or in co-extrusion to join two materials of different chemistry. Tie layer resins are perfect for creating multilayer constructions with special features that can integrate important characteristics of each kind of material.

    Several governments have been implementing various regulations and initiatives aimed at promoting sustainability and reducing the environmental impact of packaging materials. These regulations are likely to drive the adoption of tie layer resins as a more sustainable and environmentally friendly packaging material, which boosts the growth of the tie layer resins market in the coming years.

    • Short Term (2023 to 2026): Burgeoning demand for tie layer resins from the growing packaging and automotive industry will drive the market in the coming years.
    • Medium Term (2026 to 2029): Asia Pacific and North America are anticipated to witness high tie layer resins demand on the back of growing demand for food packaging due to the increasing population and changing dietary habits and favorable governmental regulations.
    • Long Term (2029 to 2033): Increasing adoption of tie layer resins in the medical industry along with growing demand for sustainable packaging will drive tie layer resins demand in the long term.

    Over the 2018 to 2022 historical period, the global tie layer resins market registered a CAGR of 4.4%, according to the Fact.MR, a market research and competitive intelligence provider, the market is projected to exhibit growth at 5.2% CAGR between 2023 and 2033.

    Tie Layer Resins Market Size, Share, Trends, Growth, Demand and Sales Forecast Report by Fact.MR

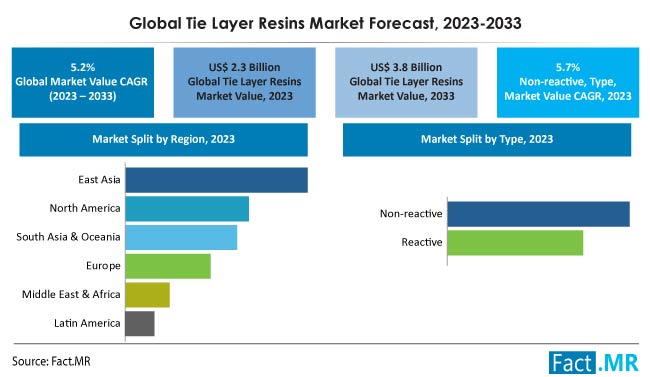
    Market share analysis of tie layer resins based on type and region is provided in a nutshell in the above image. Under the type segment, the non-reactive segment dominates with 58.4% market share in 2023.

    Market Dynamics Overview

    “Growing Demand for Tie Layer Resins from Packaging Industry to Drive Market”

    The growing demand from the packaging industry is expected to be a significant driver for the tie layer resins market in the coming years. Tie layer resins are extensively used in the packaging industry to improve the barrier properties of packaging materials. They are used as an adhesive layer between different packaging materials, such as plastic and metal, to improve the strength and durability of the packaging material.

    The growing demand for flexible packaging, coupled with the increasing demand for packaged food and beverages, is expected to drive the growth of the tie layer resins market. Flexible packaging offers several advantages over rigid packaging, such as lower weight, better space utilization, and improved product protection.

    Tie layer resins are also used in the production of high-performance packaging materials, such as multilayer films and laminates. These packaging materials are extensively used in the food and beverage industry to improve the shelf life of products and protect them from contamination. The increasing demand for high-performance packaging materials is expected to drive the growth of the tie layer resins market.

    “Volatility in Raw Material Prices Restrains the Tie Layer Resins Market Growth”

    The tie layer resins market is heavily dependent on raw materials such as polyethylene, polypropylene, and ethylene-vinyl acetate copolymer. The volatility in the prices of these raw materials is expected to restrain the growth of the tie layer resins market.

    Volatility in raw material prices can also affect the profitability of market players operating in the market. Fluctuations in raw material prices can make it difficult for market players to plan and forecast their production costs and revenue streams. This can lead to challenges in managing inventory, pricing strategies, and cash flow, which can affect the overall growth and sustainability of the market.

    Tie layer resin are non-biodegradable and can cause environmental pollution if not disposed of properly. The increasing environmental concerns are expected to restrain the growth of the tie layer resins market.

    Country-wise Insights

    What is the Market Scenario for Tie Layer Resins in Germany?

    One of the primary drivers of the increasing demand for tie layer resins in Germany is the growth of the packaging industry. The automotive industry in Germany is also a significant consumer of tie layer resins. Tie layer resin is used in the production of automotive interior trims, such as door panels, dashboard skins, and center console covers, among others. As the automotive industry in Germany continues to grow and evolve, the demand for tie layer resins is expected to increase.

    • Car manufacturing in Germany increased by 11% in 2022 compared to 2021 to reach 3.4 million units which are further expected to reach 4.7 million units by 2026.

    The German government has implemented various regulations and initiatives aimed at reducing the environmental impact of packaging materials, which is further driving the demand for tie layer resins.

    Why is the China Tie Layer Resins Market Expected to Be Highly Lucrative?

    The demand for tie layer resins in China has been increasing steadily due to the growing packaging industry in the country. Tie layer resins are widely used in the production of multilayer packaging materials, which are in high demand in China, particularly for food packaging.

    China is home to a large number of tie-layer resin manufacturers, and they have been expanding their production capacity in recent years. The increasing production capacity in China is likely to lead to a rise in the supply of tie-layer resins, which could have an impact on the pricing dynamics in the global market. As the demand for such products continues to grow, the demand for tie layer resins is also expected to increase.

    Category-wise Insights

    Why are Non-Reactive Tie Layer Resins Gaining Traction?

    Non-reactive tie layer resins are generally less expensive than reactive tie layer resins, making them an attractive option for cost-conscious manufacturers. They offer a good balance between cost and performance, making them suitable for a wide range of applications.

    Non-reactive tie layer resins can bond with a wide range of materials, including polymers, metals, and paper. This makes them a versatile choice for a variety of applications, such as flexible packaging, laminated tubes, and protective films. Non-reactive tie layer resins are considered to be more environmentally friendly than reactive tie layer resins because they do not require the use of chemical crosslinking agents or solvents, which can be harmful to the environment.

    Why is LLDPE the Preferred Base Resin by Tie Layer Resin Manufacturers?

    Linear Low-Density Polyethylene (LLDPE) is a popular base resin for tie layer resin manufacturers as it offers several advantages over other polymers. LLDPE has excellent mechanical properties, including high tensile strength, good tear resistance, and high puncture resistance. These properties make it an ideal choice for use in multilayer packaging materials, where it provides strength and durability to the final product.

    LLDPE has good barrier properties, which help to prevent the permeation of gases and moisture. This is important for packaging applications where the contents need to be protected from external factors such as oxygen, moisture, and light.

    Competitive Landscape

    Prominent tie layer resins manufacturers are Arkema SA, Dow Inc., Kraton Corporation, Lotte Chemicals, LyondellBasell, Mitsubishi Chemical Corporation, Mitsui Chemicals, SK Functional Polymers, Wetlake Chemical Corporation, and Yparex.

    The world’s leading manufacturers of tie-layer resins are focusing on increasing their production capacity. Key players in the market are focusing on partnering with various end-use industries to sell their products directly to them. Players are also focusing on offering products that are suitable for various packaging materials.

    • In July 2021, SK Functional Polymer launched a brand new tie resin OREVAC 18603, suitable for polyester-based flexible and rigid multilayer packaging. OREVAC 18603 is a maleic anhydride modified ethylene methyl-acrylate (EMA) copolymer resin.

    Fact.MR has provided detailed information about the price points of key manufacturers of tie layer resins positioned across regions, sales growth, production capacity, and speculative technological expansion, in the recently published report.

    Segmentation of Tie Layer Resins Industry Research

    • By Type :

      • Reactive
      • Non-reactive
    • By Base Resin :

      • HDPE
      • LDPE
      • LLDPE
      • EVA
      • PP
      • Others (SEBS & Others)
    • By Bonding Material :

      • Polymers
        • Ethylene Vinyl Alcohol (EVOH)
        • Polyamide
        • Polyethylene
        • Polypropylene
        • Polyester (PET)
        • Polystyrene
        • Polycarbonate
        • Others
      • Metals
        • Steel
        • Aluminum
        • Others
      • Others (Glass & Others)
    • By Application :

      • Films
        • Blown film
        • Cast film
      • Coextrusion coating
      • Metal Coating
      • Blow molding
        • Bottles
        • Containers
        • Others
      • Thermoforming
      • Others
    • By End Use :

      • Food & Specialty Packaging
        • Flexible
        • Rigid
      • Paperboard Coating
      • Multilayer Bottles
      • Barrier Sheets
      • Nylon Modification
      • Wood-plastic composites
      • Automotive (Gas Tanks & Others)
      • Others
    • By Region :

      • North America
      • Latin America
      • Europe
      • East Asia
      • South Asia & Oceania
      • MEA

    Table of Content

    • 1. Market - Executive Summary
    • 2. Market Overview
    • 3. Market Background and Foundation Data
    • 4. Global Demand (Tons) Analysis and Forecast
    • 5. Global Market - Pricing Analysis
    • 6. Global Market Value (US$ million) Analysis and Forecast
    • 7. Global Market Analysis and Forecast, By Type
      • 7.1. Reactive
      • 7.2. Non-reactive
    • 8. Global Market Analysis and Forecast, By Base Resin
      • 8.1. HDPE
      • 8.2. LDPE
      • 8.3. LLDPE
      • 8.4. EVA
      • 8.5. PP
      • 8.6. Others (SEBS etc.)
    • 9. Global Market Analysis and Forecast, By Bonding Material
      • 9.1. Polymers
        • 9.1.1. Ethylene Vinyl Alcohol (EVOH)
        • 9.1.2. Polyamide
        • 9.1.3. Polyethylene
        • 9.1.4. Polypropylene
        • 9.1.5. Polyester (PET)
        • 9.1.6. Polystyrene
        • 9.1.7. Polycarbonate
        • 9.1.8. Others
      • 9.2. Metals
        • 9.2.1. Steel
        • 9.2.2. Aluminum
        • 9.2.3. Others
      • 9.3. Others (Glass, etc.)
    • 10. Global Market Analysis and Forecast, By Application
      • 10.1. Films
        • 10.1.1. Blown film
        • 10.1.2. Cast film
      • 10.2. Coextrusion coating
      • 10.3. Metal Coating
      • 10.4. Blow molding
        • 10.4.1. Bottles
        • 10.4.2. Containers
        • 10.4.3. Others
      • 10.5. Thermoforming
      • 10.6. Others
    • 11. Global Market Analysis and Forecast, By End Use
      • 11.1. Food & Specialty Packaging
        • 11.1.1. Flexible
        • 11.1.2. Rigid
      • 11.2. Paperboard Coating
      • 11.3. Multilayer Bottles
      • 11.4. Barrier Sheets
      • 11.5. Nylon Modification
      • 11.6. Wood-plastic composites
      • 11.7. Automotive (Gas Tanks etc.)
      • 11.8. Others
    • 12. Global Market Analysis and Forecast, By Region
      • 12.1. North America
      • 12.2. Latin America
      • 12.3. Europe
      • 12.4. East Asia
      • 12.5. South Asia & Oceania
      • 12.6. Middle East & Africa
    • 13. North America Market Analysis and Forecast
    • 14. Latin America Market Analysis and Forecast
    • 15. Europe Market Analysis and Forecast
    • 16. East Asia Market Analysis and Forecast
    • 17. South Asia & Oceania Market Analysis and Forecast
    • 18. Middle East & Africa Market Analysis and Forecast
    • 19. Country-level Market Analysis and Forecast
    • 20. Market Structure Analysis
    • 21. Competition Analysis
      • 21.1. Allnex GmbH
      • 21.2. Arkema SA
      • 21.3. Dow Inc.
      • 21.4. KimiaJavid Sepahan
      • 21.5. Kraton Corporation
      • 21.6. Lotte Chemicals
      • 21.7. Lushan
      • 21.8. LyondellBasell
      • 21.9. Mitsubishi Chemical Corporation
      • 21.10. Mitsui Chemicals
      • 21.11. Pluss Advanced Technologies Pvt. Ltd.
      • 21.12. Polyram Group
      • 21.13. SK Functional Polymers
      • 21.14. Westlake Chemical Corporation
      • 21.15. Yparex
    • 22. Assumptions & Acronyms Used
    • 23. Research Methodology

    List Of Table

    Table 01. Global Market Value (US$ million), by Region, 2018 to 2022

    Table 02. Global Market Value (US$ million) and Forecast by Region, 2023 to 2033

    Table 03. Global Market Volume (Tons), by Region, 2018 to 2022

    Table 04. Global Market Volume (Tons) and Forecast by Region, 2023 to 2033

    Table 05. Global Market Value (US$ million), By Type, 2018 to 2022

    Table 06. Global Market Value (US$ million) and Forecast By Type, 2023 to 2033

    Table 07. Global Market Volume (Tons), By Type, 2018 to 2022

    Table 08. Global Market Volume (Tons) and Forecast By Type, 2023 to 2033

    Table 09. Global Market Value (US$ million), By Base Resin, 2018 to 2022

    Table 10. Global Market Value (US$ million) and Forecast By Base Resin, 2023 to 2033

    Table 11. Global Market Volume (Tons), By Base Resin, 2018 to 2022

    Table 12. Global Market Volume (Tons) and Forecast By Base Resin, 2023 to 2033

    Table 13. Global Market Value (US$ million), By Boding Material, 2018 to 2022

    Table 14. Global Market Value (US$ million) and Forecast By Boding Material, 2023 to 2033

    Table 15. Global Market Volume (Tons), By Boding Material, 2018 to 2022

    Table 16. Global Market Volume (Tons) and Forecast By Boding Material, 2023 to 2033

    Table 17. Global Market Value (US$ million), By Application, 2018 to 2022

    Table 18. Global Market Value (US$ million) and Forecast By Application, 2023 to 2033

    Table 19. Global Market Volume (Tons), By Application, 2018 to 2022

    Table 20. Global Market Volume (Tons) and Forecast By Application, 2023 to 2033

    Table 21. Global Market Value (US$ million), By End Use, 2018 to 2022

    Table 22. Global Market Value (US$ million) and Forecast By End Use, 2023 to 2033

    Table 23. Global Market Volume (Tons), By End Use, 2018 to 2022

    Table 24. Global Market Volume (Tons) and Forecast By End Use, 2023 to 2033

    Table 25. North America Market Value (US$ million) by Country, 2018 to 2022

    Table 26. North America Market Value (US$ million) and Forecast by Country, 2023 to 2033

    Table 27. North America Market Volume (Tons) by Country, 2018 to 2022

    Table 28. North America Market Volume (Tons) and Forecast by Country, 2023 to 2033

    Table 29. North America Market Value (US$ million), By Type, 2018 to 2022

    Table 30. North America Market Value (US$ million) and Forecast By Type, 2023 to 2033

    Table 31. North America Market Volume (Tons), By Type, 2018 to 2022

    Table 32. North America Market Volume (Tons) and Forecast By Type, 2023 to 2033

    Table 33. North America Market Value (US$ million), By Base Resin, 2018 to 2022

    Table 34. North America Market Value (US$ million) and Forecast By Base Resin, 2023 to 2033

    Table 35. North America Market Volume (Tons), By Base Resin, 2018 to 2022

    Table 36. North America Market Volume (Tons) and Forecast By Base Resin, 2023 to 2033

    Table 37. North America Market Value (US$ million), By Boding Material, 2018 to 2022

    Table 38. North America Market Value (US$ million) and Forecast By Boding Material, 2023 to 2033

    Table 39. North America Market Volume (Tons), By Boding Material, 2018 to 2022

    Table 40. North America Market Volume (Tons) and Forecast By Boding Material, 2023 to 2033

    Table 41. North America Market Value (US$ million), By Application, 2018 to 2022

    Table 42. North America Market Value (US$ million) and Forecast By Application, 2023 to 2033

    Table 43. North America Market Volume (Tons), By Application, 2018 to 2022

    Table 44. North America Market Volume (Tons) and Forecast By Application, 2023 to 2033

    Table 45. North America Market Value (US$ million), By End Use, 2018 to 2022

    Table 46. North America Market Value (US$ million) and Forecast By End Use, 2023 to 2033

    Table 47. North America Market Volume (Tons), By End Use, 2018 to 2022

    Table 48. North America Market Volume (Tons) and Forecast By End Use, 2023 to 2033

    Table 49. Latin America Market Value (US$ million) by Country, 2018 to 2022

    Table 50. Latin America Market Value (US$ million) and Forecast by Country, 2023 to 2033

    Table 51. Latin America Market Volume (Tons) by Country, 2018 to 2022

    Table 52. Latin America Market Volume (Tons) and Forecast by Country, 2023 to 2033

    Table 53. Latin America Market Value (US$ million), By Type, 2018 to 2022

    Table 54. Latin America Market Value (US$ million) and Forecast By Type, 2023 to 2033

    Table 55. Latin America Market Volume (Tons), By Type, 2018 to 2022

    Table 56. Latin America Market Volume (Tons) and Forecast By Type, 2023 to 2033

    Table 57. Latin America Market Value (US$ million), By Base Resin, 2018 to 2022

    Table 58. Latin America Market Value (US$ million) and Forecast By Base Resin, 2023 to 2033

    Table 59. Latin America Market Volume (Tons), By Base Resin, 2018 to 2022

    Table 60. Latin America Market Volume (Tons) and Forecast By Base Resin, 2023 to 2033

    Table 61. Latin America Market Value (US$ million), By Boding Material, 2018 to 2022

    Table 62. Latin America Market Value (US$ million) and Forecast By Boding Material, 2023 to 2033

    Table 63. Latin America Market Volume (Tons), By Boding Material, 2018 to 2022

    Table 64. Latin America Market Volume (Tons) and Forecast By Boding Material, 2023 to 2033

    Table 65. Latin America Market Value (US$ million), By Application, 2018 to 2022

    Table 66. Latin America Market Value (US$ million) and Forecast By Application, 2023 to 2033

    Table 67. Latin America Market Volume (Tons), By Application, 2018 to 2022

    Table 68. Latin America Market Volume (Tons) and Forecast By Application, 2023 to 2033

    Table 69. Latin America Market Value (US$ million), By End Use, 2018 to 2022

    Table 70. Latin America Market Value (US$ million) and Forecast By End Use, 2023 to 2033

    Table 71. Latin America Market Volume (Tons), By End Use, 2018 to 2022

    Table 72. Latin America Market Volume (Tons) and Forecast By End Use, 2023 to 2033

    Table 73. Europe Market Value (US$ million) by Country, 2018 to 2022

    Table 74. Europe Market Value (US$ million) and Forecast by Country, 2023 to 2033

    Table 75. Europe Market Volume (Tons) by Country, 2018 to 2022

    Table 76. Europe Market Volume (Tons) and Forecast by Country, 2023 to 2033

    Table 77. Europe Market Value (US$ million), By Type, 2018 to 2022

    Table 78. Europe Market Value (US$ million) and Forecast By Type, 2023 to 2033

    Table 79. Europe Market Volume (Tons), By Type, 2018 to 2022

    Table 80. Europe Market Volume (Tons) and Forecast By Type, 2023 to 2033

    Table 81. Europe Market Value (US$ million), By Base Resin, 2018 to 2022

    Table 82. Europe Market Value (US$ million) and Forecast By Base Resin, 2023 to 2033

    Table 83. Europe Market Volume (Tons), By Base Resin, 2018 to 2022

    Table 84. Europe Market Volume (Tons) and Forecast By Base Resin, 2023 to 2033

    Table 85. Europe Market Value (US$ million), By Boding Material, 2018 to 2022

    Table 86. Europe Market Value (US$ million) and Forecast By Boding Material, 2023 to 2033

    Table 87. Europe Market Volume (Tons), By Boding Material, 2018 to 2022

    Table 88. Europe Market Volume (Tons) and Forecast By Boding Material, 2023 to 2033

    Table 89. Europe Market Value (US$ million), By Application, 2018 to 2022

    Table 90. Europe Market Value (US$ million) and Forecast By Application, 2023 to 2033

    Table 91. Europe Market Volume (Tons), By Application, 2018 to 2022

    Table 92. Europe Market Volume (Tons) and Forecast By Application, 2023 to 2033

    Table 93. Europe Market Value (US$ million), By End Use, 2018 to 2022

    Table 94. Europe Market Value (US$ million) and Forecast By End Use, 2023 to 2033

    Table 95. Europe Market Volume (Tons), By End Use, 2018 to 2022

    Table 96. Europe Market Volume (Tons) and Forecast By End Use, 2023 to 2033

    Table 97. East Asia Market Value (US$ million) by Country, 2018 to 2022

    Table 98. East Asia Market Value (US$ million) and Forecast by Country, 2023 to 2033

    Table 99. East Asia Market Volume (Tons) by Country, 2018 to 2022

    Table 100. East Asia Market Volume (Tons) and Forecast by Country, 2023 to 2033

    Table 101. East Asia Market Value (US$ million), By Type, 2018 to 2022

    Table 102. East Asia Market Value (US$ million) and Forecast By Type, 2023 to 2033

    Table 103. East Asia Market Volume (Tons), By Type, 2018 to 2022

    Table 104. East Asia Market Volume (Tons) and Forecast By Type, 2023 to 2033

    Table 105. East Asia Market Value (US$ million), By Base Resin, 2018 to 2022

    Table 106. East Asia Market Value (US$ million) and Forecast By Base Resin, 2023 to 2033

    Table 107. East Asia Market Volume (Tons), By Base Resin, 2018 to 2022

    Table 108. East Asia Market Volume (Tons) and Forecast By Base Resin, 2023 to 2033

    Table 109. East Asia Market Value (US$ million), By Boding Material, 2018 to 2022

    Table 110. East Asia Market Value (US$ million) and Forecast By Boding Material, 2023 to 2033

    Table 111. East Asia Market Volume (Tons), By Boding Material, 2018 to 2022

    Table 112. East Asia Market Volume (Tons) and Forecast By Boding Material, 2023 to 2033

    Table 113. East Asia Market Value (US$ million), By Application, 2018 to 2022

    Table 114. East Asia Market Value (US$ million) and Forecast By Application, 2023 to 2033

    Table 115. East Asia Market Volume (Tons), By Application, 2018 to 2022

    Table 116. East Asia Market Volume (Tons) and Forecast By Application, 2023 to 2033

    Table 117. East Asia Market Value (US$ million), By End Use, 2018 to 2022

    Table 118. East Asia Market Value (US$ million) and Forecast By End Use, 2023 to 2033

    Table 119. East Asia Market Volume (Tons), By End Use, 2018 to 2022

    Table 120. East Asia Market Volume (Tons) and Forecast By End Use, 2023 to 2033

    Table 121. South Asia & Oceania Market Value (US$ million) by Country, 2018 to 2022

    Table 122. South Asia & Oceania Market Value (US$ million) and Forecast by Country, 2023 to 2033

    Table 123. South Asia & Oceania Market Volume (Tons) by Country, 2018 to 2022

    Table 124. South Asia & Oceania Market Volume (Tons) and Forecast by Country, 2023 to 2033

    Table 125. South Asia & Oceania Market Value (US$ million), By Type, 2018 to 2022

    Table 126. South Asia & Oceania Market Value (US$ million) and Forecast By Type, 2023 to 2033

    Table 127. South Asia & Oceania Market Volume (Tons), By Type, 2018 to 2022

    Table 128. South Asia & Oceania Market Volume (Tons) and Forecast By Type, 2023 to 2033

    Table 129. South Asia & Oceania Market Value (US$ million), By Base Resin, 2018 to 2022

    Table 130. South Asia & Oceania Market Value (US$ million) and Forecast By Base Resin, 2023 to 2033

    Table 131. South Asia & Oceania Market Volume (Tons), By Base Resin, 2018 to 2022

    Table 132. South Asia & Oceania Market Volume (Tons) and Forecast By Base Resin, 2023 to 2033

    Table 133. South Asia & Oceania Market Value (US$ million), By Boding Material, 2018 to 2022

    Table 134. South Asia & Oceania Market Value (US$ million) and Forecast By Boding Material, 2023 to 2033

    Table 135. South Asia & Oceania Market Volume (Tons), By Boding Material, 2018 to 2022

    Table 136. South Asia & Oceania Market Volume (Tons) and Forecast By Boding Material, 2023 to 2033

    Table 137. South Asia & Oceania Market Value (US$ million), By Application, 2018 to 2022

    Table 138. South Asia & Oceania Market Value (US$ million) and Forecast By Application, 2023 to 2033

    Table 139. South Asia & Oceania Market Volume (Tons), By Application, 2018 to 2022

    Table 140. South Asia & Oceania Market Volume (Tons) and Forecast By Application, 2023 to 2033

    Table 141. South Asia & Oceania Market Value (US$ million), By End Use, 2018 to 2022

    Table 142. South Asia & Oceania Market Value (US$ million) and Forecast By End Use, 2023 to 2033

    Table 143. South Asia & Oceania Market Volume (Tons), By End Use, 2018 to 2022

    Table 144. South Asia & Oceania Market Volume (Tons) and Forecast By End Use, 2023 to 2033

    Table 145. MEA Market Value (US$ million) by Country, 2018 to 2022

    Table 146. MEA Market Value (US$ million) and Forecast by Country, 2023 to 2033

    Table 147. MEA Market Volume (Tons) by Country, 2018 to 2022

    Table 148. MEA Market Volume (Tons) and Forecast by Country, 2023 to 2033

    Table 149. MEA Market Value (US$ million), By Type, 2018 to 2022

    Table 150. MEA Market Value (US$ million) and Forecast By Type, 2023 to 2033

    Table 151. MEA Market Volume (Tons), By Type, 2018 to 2022

    Table 152. MEA Market Volume (Tons) and Forecast By Type, 2023 to 2033

    Table 153. MEA Market Value (US$ million), By Base Resin, 2018 to 2022

    Table 154. MEA Market Value (US$ million) and Forecast By Base Resin, 2023 to 2033

    Table 155. MEA Market Volume (Tons), By Base Resin, 2018 to 2022

    Table 156. MEA Market Volume (Tons) and Forecast By Base Resin, 2023 to 2033

    Table 157. MEA Market Value (US$ million), By Boding Material, 2018 to 2022

    Table 158. MEA Market Value (US$ million) and Forecast By Boding Material, 2023 to 2033

    Table 159. MEA Market Volume (Tons), By Boding Material, 2018 to 2022

    Table 160. MEA Market Volume (Tons) and Forecast By Boding Material, 2023 to 2033

    Table 161. MEA Market Value (US$ million), By Application, 2018 to 2022

    Table 162. MEA Market Value (US$ million) and Forecast By Application, 2023 to 2033

    Table 163. MEA Market Volume (Tons), By Application, 2018 to 2022

    Table 164. MEA Market Volume (Tons) and Forecast By Application, 2023 to 2033

    Table 165. MEA Market Value (US$ million), By End Use, 2018 to 2022

    Table 166. MEA Market Value (US$ million) and Forecast By End Use, 2023 to 2033

    Table 167. MEA Market Volume (Tons), By End Use, 2018 to 2022

    Table 168. MEA Market Volume (Tons) and Forecast By End Use, 2023 to 2033

    List Of Figures

    Figure 01. Global Market Value (US$ million) and Volume (Tons) Forecast, 2023 to 2033

    Figure 02. Global Market Absolute $ Opportunity (US$ million), 2023 to 2033

    Figure 03. Global Market Value (US$ million) and Volume (Tons) by Region, 2023 & 20323

    Figure 04. Global Market Y-o-Y Growth Rate by Region, 2023 to 2033

    Figure 05. Global Market Value (US$ million) and Volume (Tons) By Type, 2023 & 20323

    Figure 06. Global Market Y-o-Y Growth Rate By Type, 2023 to 2033

    Figure 07. Global Market Value (US$ million) and Volume (Tons) By Base Resin, 2023 & 20323

    Figure 08. Global Market Y-o-Y Growth Rate By Base Resin, 2023 to 2033

    Figure 09. Global Market Value (US$ million) and Volume (Tons) By Boding Material, 2023 & 20323

    Figure 10. Global Market Y-o-Y Growth Rate By Boding Material, 2023 to 2033

    Figure 11. Global Market Value (US$ million) and Volume (Tons) By Application, 2023 & 20323

    Figure 12. Global Market Y-o-Y Growth Rate By Application, 2023 to 2033

    Figure 13. Global Market Value (US$ million) and Volume (Tons) By End Use, 2023 & 20323

    Figure 14. Global Market Y-o-Y Growth Rate By End Use, 2023 to 2033

    Figure 15. North America Market Value (US$ million) and Volume (Tons) Forecast, 2023 to 2033

    Figure 16. North America Market Absolute $ Opportunity (US$ million), 2023 to 2033

    Figure 17. North America Market Value (US$ million) and Volume (Tons) by Country, 2023 & 20323

    Figure 18. North America Market Y-o-Y Growth Rate by Country, 2023 to 2033

    Figure 19. North America Market Value (US$ million) and Volume (Tons) By Type, 2023 & 20323

    Figure 20. North America Market Y-o-Y Growth Rate By Type, 2023 to 2033

    Figure 21. North America Market Value (US$ million) and Volume (Tons) By Base Resin, 2023 & 20323

    Figure 22. North America Market Y-o-Y Growth Rate By Base Resin, 2023 to 2033

    Figure 23. North America Market Value (US$ million) and Volume (Tons) By Boding Material, 2023 & 20323

    Figure 24. North America Market Y-o-Y Growth Rate By Boding Material, 2023 to 2033

    Figure 25. North America Market Value (US$ million) and Volume (Tons) By Application, 2023 & 20323

    Figure 26. North America Market Y-o-Y Growth Rate By Application, 2023 to 2033

    Figure 27. North America Market Value (US$ million) and Volume (Tons) By End Use, 2023 & 20323

    Figure 28. North America Market Y-o-Y Growth Rate By End Use, 2023 to 2033

    Figure 29. North America Market Attractiveness Analysis by Country, 2023 to 2033

    Figure 30. North America Market Attractiveness Analysis By Type, 2023 to 2033

    Figure 31. North America Market Attractiveness Analysis By Base Resin, 2023 to 2033

    Figure 32. North America Market Attractiveness Analysis By Boding Material, 2023 to 2033

    Figure 33. North America Market Attractiveness Analysis By Application, 2023 to 2033

    Figure 34. North America Market Attractiveness Analysis By End Use, 2023 to 2033

    Figure 35. Latin America Market Value (US$ million) and Volume (Tons) Forecast, 2023 to 2033

    Figure 36. Latin America Market Absolute $ Opportunity (US$ million), 2023 to 2033

    Figure 37. Latin America Market Value (US$ million) and Volume (Tons) by Country, 2023 & 20323

    Figure 38. Latin America Market Y-o-Y Growth Rate by Country, 2023 to 2033

    Figure 39. Latin America Market Value (US$ million) and Volume (Tons) By Type, 2023 & 20323

    Figure 40. Latin America Market Y-o-Y Growth Rate By Type, 2023 to 2033

    Figure 41. Latin America Market Value (US$ million) and Volume (Tons) By Base Resin, 2023 & 20323

    Figure 42. Latin America Market Y-o-Y Growth Rate By Base Resin, 2023 to 2033

    Figure 43. Latin America Market Value (US$ million) and Volume (Tons) By Boding Material, 2023 & 20323

    Figure 44. Latin America Market Y-o-Y Growth Rate By Boding Material, 2023 to 2033

    Figure 45. Latin America Market Value (US$ million) and Volume (Tons) By Application, 2023 & 20323

    Figure 46. Latin America Market Y-o-Y Growth Rate By Application, 2023 to 2033

    Figure 47. Latin America Market Value (US$ million) and Volume (Tons) By End Use, 2023 & 20323

    Figure 48. Latin America Market Y-o-Y Growth Rate By End Use, 2023 to 2033

    Figure 49. Latin America Market Attractiveness Analysis by Country, 2023 to 2033

    Figure 50. Latin America Market Attractiveness Analysis By Type, 2023 to 2033

    Figure 51. Latin America Market Attractiveness Analysis By Base Resin, 2023 to 2033

    Figure 52. Latin America Market Attractiveness Analysis By Boding Material, 2023 to 2033

    Figure 53. Latin America Market Attractiveness Analysis By Application, 2023 to 2033

    Figure 54. Latin America Market Attractiveness Analysis By End Use, 2023 to 2033

    Figure 55. Europe Market Value (US$ million) and Volume (Tons) Forecast, 2023 to 2033

    Figure 56. Europe Market Absolute $ Opportunity (US$ million), 2023 to 2033

    Figure 57. Europe Market Value (US$ million) and Volume (Tons) by Country, 2023 & 20323

    Figure 58. Europe Market Y-o-Y Growth Rate by Country, 2023 to 2033

    Figure 59. Europe Market Value (US$ million) and Volume (Tons) By Type, 2023 & 20323

    Figure 60. Europe Market Y-o-Y Growth Rate By Type, 2023 to 2033

    Figure 61. Europe Market Value (US$ million) and Volume (Tons) By Base Resin, 2023 & 20323

    Figure 62. Europe Market Y-o-Y Growth Rate By Base Resin, 2023 to 2033

    Figure 63. Europe Market Value (US$ million) and Volume (Tons) By Boding Material, 2023 & 20323

    Figure 64. Europe Market Y-o-Y Growth Rate By Boding Material, 2023 to 2033

    Figure 65. Europe Market Value (US$ million) and Volume (Tons) By Application, 2023 & 20323

    Figure 66. Europe Market Y-o-Y Growth Rate By Application, 2023 to 2033

    Figure 67. Europe Market Value (US$ million) and Volume (Tons) By End Use, 2023 & 20323

    Figure 68. Europe Market Y-o-Y Growth Rate By End Use, 2023 to 2033

    Figure 69. Europe Market Attractiveness Analysis by Country, 2023 to 2033

    Figure 70. Europe Market Attractiveness Analysis By Type, 2023 to 2033

    Figure 71. Europe Market Attractiveness Analysis By Base Resin, 2023 to 2033

    Figure 72. Europe Market Attractiveness Analysis By Boding Material, 2023 to 2033

    Figure 73. Europe Market Attractiveness Analysis By Application, 2023 to 2033

    Figure 74. Europe Market Attractiveness Analysis By End Use, 2023 to 2033

    Figure 75. East Asia Market Value (US$ million) and Volume (Tons) Forecast, 2023 to 2033

    Figure 76. East Asia Market Absolute $ Opportunity (US$ million), 2023 to 2033

    Figure 77. East Asia Market Value (US$ million) and Volume (Tons) by Country, 2023 & 20323

    Figure 78. East Asia Market Y-o-Y Growth Rate by Country, 2023 to 2033

    Figure 79. East Asia Market Value (US$ million) and Volume (Tons) By Type, 2023 & 20323

    Figure 80. East Asia Market Y-o-Y Growth Rate By Type, 2023 to 2033

    Figure 81. East Asia Market Value (US$ million) and Volume (Tons) By Base Resin, 2023 & 20323

    Figure 82. East Asia Market Y-o-Y Growth Rate By Base Resin, 2023 to 2033

    Figure 83. East Asia Market Value (US$ million) and Volume (Tons) By Boding Material, 2023 & 20323

    Figure 84. East Asia Market Y-o-Y Growth Rate By Boding Material, 2023 to 2033

    Figure 85. East Asia Market Value (US$ million) and Volume (Tons) By Application, 2023 & 20323

    Figure 86. East Asia Market Y-o-Y Growth Rate By Application, 2023 to 2033

    Figure 87. East Asia Market Value (US$ million) and Volume (Tons) By End Use, 2023 & 20323

    Figure 88. East Asia Market Y-o-Y Growth Rate By End Use, 2023 to 2033

    Figure 89. East Asia Market Attractiveness Analysis by Country, 2023 to 2033

    Figure 90. East Asia Market Attractiveness Analysis By Type, 2023 to 2033

    Figure 91. East Asia Market Attractiveness Analysis By Base Resin, 2023 to 2033

    Figure 92. East Asia Market Attractiveness Analysis By Boding Material, 2023 to 2033

    Figure 93. East Asia Market Attractiveness Analysis By Application, 2023 to 2033

    Figure 94. East Asia Market Attractiveness Analysis By End Use, 2023 to 2033

    Figure 95. South Asia & Oceania Market Value (US$ million) and Volume (Tons) Forecast, 2023 to 2033

    Figure 96. South Asia & Oceania Market Absolute $ Opportunity (US$ million), 2023 to 2033

    Figure 97. South Asia & Oceania Market Value (US$ million) and Volume (Tons) by Country, 2023 & 20323

    Figure 98. South Asia & Oceania Market Y-o-Y Growth Rate by Country, 2023 to 2033

    Figure 99. South Asia & Oceania Market Value (US$ million) and Volume (Tons) By Type, 2023 & 20323

    Figure 100. South Asia & Oceania Market Y-o-Y Growth Rate By Type, 2023 to 2033

    Figure 101. South Asia & Oceania Market Value (US$ million) and Volume (Tons) By Base Resin, 2023 & 20323

    Figure 102. South Asia & Oceania Market Y-o-Y Growth Rate By Base Resin, 2023 to 2033

    Figure 103. South Asia & Oceania Market Value (US$ million) and Volume (Tons) By Boding Material, 2023 & 20323

    Figure 104. South Asia & Oceania Market Y-o-Y Growth Rate By Boding Material, 2023 to 2033

    Figure 105. South Asia & Oceania Market Value (US$ million) and Volume (Tons) By Application, 2023 & 20323

    Figure 106. South Asia & Oceania Market Y-o-Y Growth Rate By Application, 2023 to 2033

    Figure 107. South Asia & Oceania Market Value (US$ million) and Volume (Tons) By End Use, 2023 & 20323

    Figure 108. South Asia & Oceania Market Y-o-Y Growth Rate By End Use, 2023 to 2033

    Figure 109. South Asia & Oceania Market Attractiveness Analysis by Country, 2023 to 2033

    Figure 110. South Asia & Oceania Market Attractiveness Analysis By Type, 2023 to 2033

    Figure 111. South Asia & Oceania Market Attractiveness Analysis By Base Resin, 2023 to 2033

    Figure 112. South Asia & Oceania Market Attractiveness Analysis By Boding Material, 2023 to 2033

    Figure 113. South Asia & Oceania Market Attractiveness Analysis By Application, 2023 to 2033

    Figure 114. South Asia & Oceania Market Attractiveness Analysis By End Use, 2023 to 2033

    Figure 115. MEA Market Value (US$ million) and Volume (Tons) Forecast, 2023 to 2033

    Figure 116. MEA Market Absolute $ Opportunity (US$ million), 2023 to 2033

    Figure 117. MEA Market Value (US$ million) and Volume (Tons) by Country, 2023 & 20323

    Figure 118. MEA Market Y-o-Y Growth Rate by Country, 2023 to 2033

    Figure 119. MEA Market Value (US$ million) and Volume (Tons) By Type, 2023 & 20323

    Figure 120. MEA Market Y-o-Y Growth Rate By Type, 2023 to 2033

    Figure 121. MEA Market Value (US$ million) and Volume (Tons) By Base Resin, 2023 & 20323

    Figure 122. MEA Market Y-o-Y Growth Rate By Base Resin, 2023 to 2033

    Figure 123. MEA Market Value (US$ million) and Volume (Tons) By Boding Material, 2023 & 20323

    Figure 124. MEA Market Y-o-Y Growth Rate By Boding Material, 2023 to 2033

    Figure 125. MEA Market Value (US$ million) and Volume (Tons) By Application, 2023 & 20323

    Figure 126. MEA Market Y-o-Y Growth Rate By Application, 2023 to 2033

    Figure 127. MEA Market Value (US$ million) and Volume (Tons) By End Use, 2023 & 20323

    Figure 128. MEA Market Y-o-Y Growth Rate By End Use, 2023 to 2033

    Figure 129. MEA Market Attractiveness Analysis by Country, 2023 to 2033

    Figure 130. MEA Market Attractiveness Analysis By Type, 2023 to 2033

    Figure 131. MEA Market Attractiveness Analysis By Base Resin, 2023 to 2033

    Figure 132. MEA Market Attractiveness Analysis By Boding Material, 2023 to 2033

    Figure 133. MEA Market Attractiveness Analysis By Application, 2023 to 2033

    Figure 134. MEA Market Attractiveness Analysis By End Use, 2023 to 2033

    - FAQs -

    What Is the Global Tie Layer Resins Market Size?

    The global tie layer resins market is expected to be valued at US$ 2.3 billion in 2023.

    How Is the Market for Tie Layer Resins Expected to Fare Going Forward?

    Worldwide demand for tie layer resins is estimated to reach US$ 3.8 billion by 2033-end.

    How Did the Market Perform Over the Last Few Years?

    During 2018 to 2022, the demand for tie layer resins increased at 4.4% CAGR.

    Which Regional Tie Layer Resins Market Accounts for A Leading Market Share?

    East Asia is the crown of the global tie layer resins market accounting for 31.6% market share.

    Which Type of Tie Layer Resins Dominates the Market?

    Non-reactive tie layer resins account for 58.4% share of global sales.

    Tie Layer Resins Market