Robotic End of Arm Tool Market

Robotic End of Arm Tool Market Analysis, By Product Type, By End-Use, By Process Line, and Region - Market Insights 2025 to 2035

Analysis Of Robotic End Of Arm Tool Market Covering 30+ Countries Including Analysis Of US, Canada, UK, Germany, France, Nordics, GCC Countries, Japan, Korea And Many More

Robotic End of Arm Tool Market Outlook (2025 to 2035)

The global robotic end-of-arm tool market is projected to increase from USD 2.2 billion in 2025 to USD 5.8 billion by 2035, with a CAGR of 10.1%, driven by increasing automation across industries, which reduces labor costs and errors while enhancing scalability. Their use makes them ideal for high-precision, repetitive, and scalable tasks across manufacturing, packaging, and assembly operations, where efficiency, accuracy, and flexibility are critical.

Robotic End Of Arm Tool Market Value (USD Billion) 2025 To 2035

What are the Drivers of Robotic End of Arm Tool Market?

The end-of-arm tool (EOAT) market is experiencing growth driven by the increasing adoption of factory automation and robotics. To boost efficiency and quality, manufacturers are investing substantially in advanced robotic systems as production processes become more complicated. The increasing demand for customized and flexible automation solutions has driven up the need for EOATs, which are crucial for robotic applications.

The robotic EOAT market is also predicted to increase as robotics incorporates advanced technologies, such as artificial intelligence and machine learning. Demand for precision and efficiency in production is another major driver of the EOAT industry. Advanced EOATs can improve accuracy and consistency in automotive, electronics, food & beverage, and pharmaceutical industries.

Modern production systems need EOATs for their precision and repeatability in complex jobs. Mass customization and flexible manufacturing processes are also driving the use of EOAT in numerous industries. EOAT demand is also rising due to labor cost reduction and workplace safety improvements. Automation is becoming increasingly popular as labor costs rise, enabling companies to reduce expenses and enhance efficiency.

Automating repetitive and dangerous operations with EOATs reduces workplace accidents and improves worker safety. Growing awareness of automation's benefits, combined with government incentives for adopting modern manufacturing technologies, is also driving the robotic end-of-arm tool industry.

The Bernoulli-type end effector is a notable invention in advanced EOATs. Bernoulli's theorem enables this end effector to handle delicate goods without direct contact, making it ideal for such applications.

The Bernoulli-type end effector utilizes airflow to create a vacuum, enabling the safe and damage-free lift and movement of objects. This is particularly important in industries such as electronics and pharmaceuticals, where product integrity is crucial.

What are the Regional Trends of Robotic End of Arm Tool Market?

Many semiconductor plants in China, Taiwan, South Korea, and Japan have made the Asia-Pacific region the major player in the ultra-pure pipes market. Government initiatives promoting industrial cleanroom infrastructure, combined with the region’s robust electronics and pharmaceutical manufacturing sectors, are playing a pivotal role in advancing market growth.

Significant investments in semiconductor fabs and biotechnology are key factors positioning North America as a major growth region in the market. The CHIPS and Science Act, for example, aims to drive infrastructure changes that must involve standards for ultra-pure piping networks. Canada’s expanding pharmaceutical sector is further contributing to regional market growth.

Germany, Switzerland and Ireland in Europe are concentrating on reliable, high-purity applications in molecular medicine. Tough environmental standards from the EU are encouraging industries to achieve greater purity.

The Middle East and Southeast Asia are ramping up manufacturing, with many companies choosing to build cleanrooms and invest in advanced cleanroom solutions. The Middle East and Southeast Asia are accelerating manufacturing efforts, with many facilities opting to construct cleanrooms and adopt advanced cleanroom technologies.

This trend is creating new growth opportunities for ultra-pure piping solutions, particularly in industrial zones and designated pharmaceutical parks.

What are the Challenges and Restraining Factors of Robotic End of Arm Tool Market?

The primary barrier for both manufacturers and end-users, particularly small and medium-sized enterprises, is the high initial investment and ongoing maintenance costs associated with the development, scaling, and manufacturing of robotic EOATs.

These expenses encompass not only the acquisition of EOATs but also expenses associated with operator training, safety protocols, preventive maintenance, and the integration of complementary equipment.

These expenses can significantly increase the average cost per implementation and impede the widespread adoption of the technology.

Additionally, operational risks are posed by high switching costs, which include potential production line shutdowns for maintenance or replacement, as well as long-term vendor contracts. Consequently, some companies are hesitant to automate their processes.

EOAT retrofitting into existing manufacturing systems can be challenging and costly due to complex integration and customization requirements, which are additional restraining factors. Supply chain disruptions and geopolitical issues, such as trade disputes, have affected the market by disrupting the supply of critical components and slowing growth.

Country-Wise Outlook

U.S. robotic end-of-arm tool market sees growth driven by rising automation across industries

Robotic End Of Arm Tool Market By Country

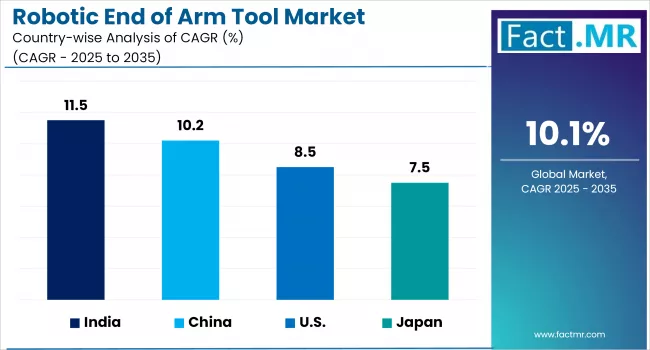
The U.S. market is experiencing strong growth, primarily driven by rising automation demands across industries, technological advancements such as AI-enhanced tooling, and persistent labor shortages that are accelerating the adoption of robotics. The integration of Industry 4.0 and the expansion of applications in sectors such as healthcare and e-commerce are also significant contributors to market growth.

Customization and efficiency are key trends, as industries increasingly demand EOAT solutions tailored to their specific and evolving requirements, especially in automotive manufacturing, where applications such as welding, assembly, and material handling are essential.

Technological advancements, including the adoption of artificial intelligence and machine learning, have enhanced EOAT precision, adaptability, and real-time monitoring capabilities.

US Robotic End Of Arm Tool Market Value (USD Billion) 2025 To 2035

The growing use of collaborative robots (cobots), which require advanced and safe EOAT for human-robot interaction, further boosts market demand. Additionally, government initiatives supporting robotics research, development, and workforce training, such as the Advanced Robotics for Manufacturing (ARM) Institute, help sustain market momentum.

China Witnesses Rapid Market Growth Backed by Expansion of Collaborative Robots

The Chinese market is experiencing robust growth, primarily driven by the rapid adoption of automation across various industries, including automotive, electronics, logistics, and healthcare. The need for increased precision, efficiency, and productivity in manufacturing processes fuels this surge in demand.

The introduction of electrostatic grippers, automatic tool changers, furniture finishing tools, and collision sensors has enhanced precision, flexibility, and safety in automation processes. These innovations are being rapidly adopted in both the automotive and non-automotive sectors, supporting a broader range of applications, from assembly and material handling to surface finishing and packaging. 

Additionally, ABB Robotics has recently launched three new robot families in China and updated its IRB 1200 line of collaborative robots. The new IRB 1200 models, available in four payload variants, are engineered for greater efficiency and precision, targeting electronics, manufacturing, and automotive electronics industries. These robots feature improved motion control, faster cycle times, and are optimized for high-throughput, complex tasks such as surface finishing and assembly.

Japan is Experiencing Notable Growth, Driven Primarily by Expansion in Automotive and Electronics Manufacturing

Rapid technological advancements, including the integration of robotics, automation, and artificial intelligence, are further fueling this growth by enabling more complex and adaptable manufacturing processes. Additionally, Japan’s focus on quality manufacturing standards and its reputation for precision are encouraging the adoption of innovative EOAT solutions.

Recent new launches and initiatives in Japan’s End of Arm Tool (EOAT) and robotic arms highlight a strong focus on technological innovation and expanding automation capabilities. GITAI introduced its autonomous robotic arm, the S2, which was delivered to the International Space Station (ISS) via a SpaceX Falcon 9 rocket in January 2024. The 1.5-meter arm is intended for space-based repair, assembly, and manufacturing tasks, showcasing Japan’s advancements in space robotics.

There is a trend toward developing lightweight and collaborative robots that can safely interact with humans and operate in tight spaces, further broadening the range of EOAT applications in both traditional and emerging industries. These product launches and technological initiatives reflect Japan’s commitment to maintaining leadership in robotics and automation by delivering solutions that enhance productivity, flexibility, and safety across diverse industrial environments.

Category-wise Analysis

Grippers to Exhibit Leading by Product Type

Robotic End Of Arm Tool Market By Product Type

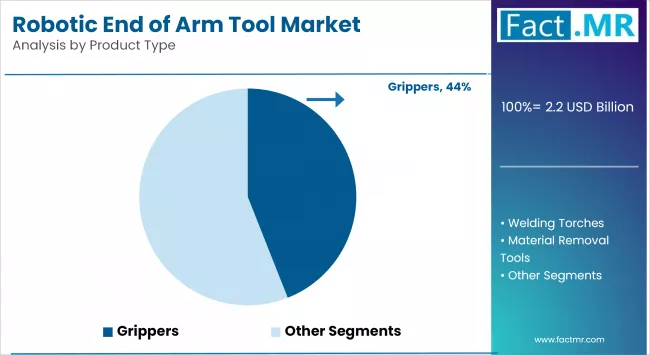
Grippers hold the largest revenue share in the robotic end-of-arm tooling (EOAT) market due to their widespread use in pick-and-place, assembly, and packaging applications across various industries. Their versatility and ability to handle diverse object shapes and sizes make them essential in automotive, electronics, and logistics sectors.

Adaptive grippers are expected to be the fastest-growing segment, driven by increasing demand for flexible automation solutions, especially in collaborative robot (cobot) applications. Their ability to conform to a wide variety of objects without reprogramming or tool changes makes them ideal for high-mix, low-volume production lines.

Automotive to Exhibit Leading by End-Use

Robotic End Of Arm Tool Market By End Use

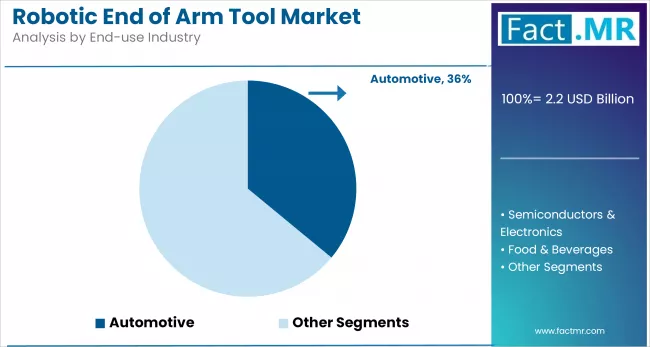
The automotive industry leads in EOAT adoption, accounting for the largest revenue share. End-effectors are widely used for welding, assembly, painting, and material handling, supporting high-speed, precise, and repetitive tasks critical to vehicle production.

The electronics and semiconductor segment is the fastest-growing end-use sector, fueled by miniaturization trends and the need for high-precision assembly. EOAT used in this sector often involves vacuum and electrostatic grippers for delicate component handling, supporting the sector’s push toward higher throughput and yield.

Welding to Exhibit Leading by Process Line

Welding applications dominate the EOAT process line category, driven by heavy use in automotive and industrial equipment manufacturing. Robotic welding torches provide consistency, speed, and accuracy, improving production quality while reducing labor costs and safety risks.

Material removal tools, including robotic deburring, grinding, and polishing end-effectors, are witnessing the fastest growth. This is due to increasing demand in precision manufacturing sectors like aerospace and medical devices, where surface finish quality and tight tolerances are critical.

Competitive Analysis

The robotic end-of-arm tooling (EOAT) market is becoming increasingly competitive, with global automation leaders and specialized solution providers competing based on innovation, product customization, and smart integration capabilities.

Leading companies such as Schunk GmbH & Co. KG, Festo Inc., Zimmer Group, and Robotiq Inc. have established strong global distribution networks and offer a wide array of EOAT solutions tailored for sectors like automotive, electronics, packaging, and life sciences.

Manufacturers of robotic EOATs are making substantial investments in research and development to develop creative grippers, sensors, and attachments. The integration of data analytics, Industry 4.0, and IoT is becoming more prevalent, enabling manufacturers to market their products at a premium and offer cutting-edge innovations.

Key players in the robotic end-of-arm tool industry include Schunk GmbH & Co. KG, Festo Inc., ASS Maschinenbau GmbH, Robotiq Inc., Zimmer Group, Destaco, Piab AB, Applied Robotics Inc., EMI Corporation, J. Schmalz GmbH, and other notable players.

Recent Development

  • In April 2025, SICK, a leading sensor manufacturer, partnered with Universal Robots (UR), a prominent producer of collaborative robots (cobots), to introduce a new safety solution called the End-of-Arm-Safeguard (EOAS).SICK, a leading sensor manufacturer, partnered with Universal Robots (UR), a prominent producer of collaborative robots (cobots), to introduce a new safety solution called the End-of-Arm-Safeguard (EOAS).

(Source: https://www.dpaonthenet.net/article/214928/SICK-launches-end-of-arm-safeguard--EOAS--with-Universal-Robots-for-human-robot-collaboration.aspx.)

  • In May 2024, Tech Rim Standards launched its Tech-Effector EOAT product line at Automate 2024. This line includes components such as aluminum tubing, cross clamps, end extensions, flange mounts, gripper mounts, sensor mounts, tooling adapters, and vacuum cup mounts.

(Source:https://insights.globalspec.com/article/22361/tech-rim-      standards-unveils-its-end-of-arm-tooling-eoat-demonstration-at-  automate-2024.)

Segmentation of Robotic End of Arm Tool Market

  • By Product Type :

    • Grippers
    • Parallel Motion Two-Jaw Grippers
    • Three-Jaw Grippers
    • Needle Grippers
    • Vacuum Cups
    • Magnetic Grippers
    • Bellows Grippers
    • Adaptive Grippers
    • Electrostatic Grippers
    • Welding Torches
    • Material Removal Tools
    • Tool Changers
    • Others
  • By End-use Industry :

    • Automotive
    • Semiconductors & Electronics
    • Food & Beverages
    • Pharmaceuticals
    • Industrial Machinery
    • Logistics & Supply Chain
    • Others
  • By Process Line :

    • Assembly Lines
    • Material Handling
    • Welding Process
    • Packaging Lines
    • Painting Lines
    • Inspection Lines
  • By Region :

    • North America
    • Latin America
    • Western Europe
    • Eastern Europe
    • East Asia
    • South Asia & Pacific
    • Middle East & Africa

Table of Content

  1. Executive Summary
    • Global Market Outlook
    • Demand-side Trends
    • Supply-side Trends
    • Technology Roadmap Analysis
    • Analysis and Recommendations
  2. Market Overview
    • Market Coverage / Taxonomy
    • Market Definition / Scope / Limitations
  3. Market Background
    • Market Dynamics
      • Drivers
      • Restraints
      • Opportunity
      • Trends
    • Scenario Forecast
      • Demand in Optimistic Scenario
      • Demand in Likely Scenario
      • Demand in Conservative Scenario
    • Opportunity Map Analysis
    • Product Life Cycle Analysis
    • Supply Chain Analysis
      • Supply Side Participants and their Roles
        • Producers
        • Mid-Level Participants (Traders/ Agents/ Brokers)
        • Wholesalers and Distributors
      • Value Added and Value Created at Node in the Supply Chain
      • List of Component Suppliers
      • List of Existing and Potential Buyers
    • Investment Feasibility Matrix
    • Value Chain Analysis
      • Profit Margin Analysis
      • Wholesalers and Distributors
    • PESTLE and Porter’s Analysis
    • Regulatory Landscape
      • By Key Regions
      • By Key Countries
    • Production and Consumption Statistics
    • Import and Export Statistics
  4. Global Market Analysis 2020-2024 and Forecast, 2025-2035
    • Historical Market Size Value (USD Bn) & Volume (Units) Analysis, 2020-2024
    • Current and Future Market Size Value (USD Bn) & Volume (Units) Projections, 2025-2035
      • Y-o-Y Growth Trend Analysis
      • Absolute $ Opportunity Analysis
  5. Global Market Pricing Analysis 2020-2024 and Forecast 2025-2035
  6. Global Market Analysis 2020-2024 and Forecast 2025-2035, By Product Type
    • Introduction / Key Findings
    • Historical Market Size Value (USD Bn) & Volume (Units) Analysis By Product Type, 2020-2024
    • Current and Future Market Size Value (USD Bn) & Volume (Units) Analysis and Forecast By Product Type, 2025-2035
      • Grippers
        • Parallel Motion Two-Jaw Grippers
        • Three-Jaw Grippers
        • Needle Grippers
        • Vacuum Cups
        • Magnetic Grippers
        • Bellows Grippers
        • Adaptive Grippers
        • Electrostatic Grippers
      • Welding Torches
      • Material Removal Tools
      • Tool Changers
      • Others
    • Y-o-Y Growth Trend Analysis By Product Type, 2020-2024
    • Absolute $ Opportunity Analysis By Product Type, 2025-2035
  7. Global Market Analysis 2020-2024 and Forecast 2025-2035, By End-use
    • Introduction / Key Findings
    • Historical Market Size Value (USD Bn) & Volume (Units) Analysis By End-use, 2020-2024
    • Current and Future Market Size Value (USD Bn) & Volume (Units) Analysis and Forecast By End-use, 2025-2035
      • Automotive
      • Semiconductors & Electronics
      • Food & Beverages
      • Pharmaceuticals
      • Industrial Machinery
      • Logistics & Supply Chain
      • Others
    • Y-o-Y Growth Trend Analysis By End-use, 2020-2024
    • Absolute $ Opportunity Analysis By End-use, 2025-2035
  8. Global Market Analysis 2020-2024 and Forecast 2025-2035, By Process Line
    • Introduction / Key Findings
    • Historical Market Size Value (USD Bn) & Volume (Units) Analysis By Process Line, 2020-2024
    • Current and Future Market Size Value (USD Bn) & Volume (Units) Analysis and Forecast By Process Line, 2025-2035
      • Assembly Lines
      • Material Handling
      • Welding Process
      • Packaging Lines
      • Painting Lines
      • Inspection Lines
    • Y-o-Y Growth Trend Analysis By Process Line, 2020-2024
    • Absolute $ Opportunity Analysis By Process Line, 2025-2035
  9. Global Market Analysis 2020-2024 and Forecast 2025-2035, By Region
    • Introduction
    • Historical Market Size Value (USD Bn) & Volume (Units) Analysis By Region, 2020-2024
    • Current Market Size Value (USD Bn) & Volume (Units) Analysis and Forecast By Region, 2025-2035
      • North America
      • Latin America
      • Western Europe
      • East Asia
      • South Asia Pacific
      • Eastern Europe
      • Middle East & Africa
    • Market Attractiveness Analysis By Region
  10. North America Market Analysis 2020-2024 and Forecast 2025-2035, By Country
    • Historical Market Size Value (USD Bn) & Volume (Units) Trend Analysis By Market Taxonomy, 2020-2024
    • Market Size Value (USD Bn) & Volume (Units) Forecast By Market Taxonomy, 2025-2035
      • By Country
        • U.S.
        • Canada
        • Mexico
      • By Product Type
      • By End-use
      • By Process Line
    • Market Attractiveness Analysis
      • By Country
      • By Product Type
      • By End-use
      • By Process Line
    • Key Takeaways
  11. Latin America Market Analysis 2020-2024 and Forecast 2025-2035, By Country
    • Historical Market Size Value (USD Bn) & Volume (Units) Trend Analysis By Market Taxonomy, 2020-2024
    • Market Size Value (USD Bn) & Volume (Units) Forecast By Market Taxonomy, 2025-2035
      • By Country
        • Brazil
        • Chile
        • Rest of Latin America
      • By Product Type
      • By End-use
      • By Process Line
    • Market Attractiveness Analysis
      • By Country
      • By Product Type
      • By End-use
      • By Process Line
    • Key Takeaways
  12. Western Europe Market Analysis 2020-2024 and Forecast 2025-2035, By Country
    • Historical Market Size Value (USD Bn) & Volume (Units) Trend Analysis By Market Taxonomy, 2020-2024
    • Market Size Value (USD Bn) & Volume (Units) Forecast By Market Taxonomy, 2025-2035
      • By Country
        • Germany
        • Italy
        • France
        • U.K.
        • Spain
        • Russia
        • BENELUX
        • Rest of Europe
      • By Product Type
      • By End-use
      • By Process Line
    • Market Attractiveness Analysis
      • By Country
      • By Product Type
      • By End-use
      • By Process Line
    • Key Takeaways
  13. East Asia Market Analysis 2020-2024 and Forecast 2025-2035, By Country
    • Historical Market Size Value (USD Bn) & Volume (Units) Trend Analysis By Market Taxonomy, 2020-2024
    • Market Size Value (USD Bn) & Volume (Units) Forecast By Market Taxonomy, 2025-2035
      • By Country
        • China
        • Japan
        • South Korea
      • By Product Type
      • By End-use
      • By Process Line
    • Market Attractiveness Analysis
      • By Country
      • By Product Type
      • By End-use
      • By Process Line
    • Key Takeaways
  14. South Asia Pacific Market Analysis 2020-2024 and Forecast 2025-2035, By Country
    • Historical Market Size Value (USD Bn) & Volume (Units) Trend Analysis By Market Taxonomy, 2020-2024
    • Market Size Value (USD Bn) & Volume (Units) Forecast By Market Taxonomy, 2025-2035
      • By Country
        • India
        • ASEAN Countries
        • Australia & New Zealand
        • Rest of South Asia Pacific
      • By Product Type
      • By End-use
      • By Process Line
    • Market Attractiveness Analysis
      • By Country
      • By Product Type
      • By End-use
      • By Process Line
    • Key Takeaways
  15. Eastern Europe Market Analysis 2020-2024 and Forecast 2025-2035, By Country
    • Historical Market Size Value (USD Bn) & Volume (Units) Trend Analysis By Market Taxonomy, 2020-2024
    • Market Size Value (USD Bn) & Volume (Units) Forecast By Market Taxonomy, 2025-2035
      • By Country
        • Russia
        • Poland
        • Hungary
        • Balkan & Baltics
        • Rest of Eastern Europe
      • By Product Type
      • By End-use
      • By Process Line
    • Market Attractiveness Analysis
      • By Country
      • By Product Type
      • By End-use
      • By Process Line
    • Key Takeaways
  16. Middle East & Africa Market Analysis 2020-2024 and Forecast 2025-2035, By Country
    • Historical Market Size Value (USD Bn) & Volume (Units) Trend Analysis By Market Taxonomy, 2020-2024
    • Market Size Value (USD Bn) & Volume (Units) Forecast By Market Taxonomy, 2025-2035
      • By Country
        • KSA
        • Other GCC Countries
        • Turkiye
        • South Africa
        • Rest of MEA
      • By Product Type
      • By End-use
      • By Process Line
    • Market Attractiveness Analysis
      • By Country
      • By Product Type
      • By End-use
      • By Process Line
    • Key Takeaways
  17. Key Countries Market Analysis
    • U.S.
      • Pricing Analysis
      • Market Share Analysis, 2024
        • By Product Type
        • By End-use
        • By Process Line
    • Germany
      • Pricing Analysis
      • Market Share Analysis, 2024
        • By Product Type
        • By End-use
        • By Process Line
    • China
      • Pricing Analysis
      • Market Share Analysis, 2024
        • By Product Type
        • By End-use
        • By Process Line
    • Japan
      • Pricing Analysis
      • Market Share Analysis, 2024
        • By Product Type
        • By End-use
        • By Process Line
    • South Korea
      • Pricing Analysis
      • Market Share Analysis, 2024
        • By Product Type
        • By End-use
        • By Process Line
  18. Market Structure Analysis
    • Competition Dashboard
    • Competition Benchmarking
    • Market Share Analysis of Top Players
      • By Regional
      • By Product Type
      • By End-use
      • By Process Line
  19. Competition Analysis
    • Competition Deep Dive
      • Schunk GmbH & Co. KG
        • Overview
        • Product Portfolio
        • Profitability by Market Segments (Product/Age /Sales Channel/Region)
        • Sales Footprint
        • Strategy Overview
          • Marketing Strategy
          • Product Strategy
          • Channel Strategy
      • Festo Inc.
        • Overview
        • Product Portfolio
        • Profitability by Market Segments (Product/Age /Sales Channel/Region)
        • Sales Footprint
        • Strategy Overview
          • Marketing Strategy
          • Product Strategy
          • Channel Strategy
      • ASS Maschinenbau GmbH
        • Overview
        • Product Portfolio
        • Profitability by Market Segments (Product/Age /Sales Channel/Region)
        • Sales Footprint
        • Strategy Overview
          • Marketing Strategy
          • Product Strategy
          • Channel Strategy
      • Robotiq Inc.
        • Overview
        • Product Portfolio
        • Profitability by Market Segments (Product/Age /Sales Channel/Region)
        • Sales Footprint
        • Strategy Overview
          • Marketing Strategy
          • Product Strategy
          • Channel Strategy
      • Zimmer Group
        • Overview
        • Product Portfolio
        • Profitability by Market Segments (Product/Age /Sales Channel/Region)
        • Sales Footprint
        • Strategy Overview
          • Marketing Strategy
          • Product Strategy
          • Channel Strategy
      • Destaco
        • Overview
        • Product Portfolio
        • Profitability by Market Segments (Product/Age /Sales Channel/Region)
        • Sales Footprint
        • Strategy Overview
          • Marketing Strategy
          • Product Strategy
          • Channel Strategy
      • Piab AB
        • Overview
        • Product Portfolio
        • Profitability by Market Segments (Product/Age /Sales Channel/Region)
        • Sales Footprint
        • Strategy Overview
          • Marketing Strategy
          • Product Strategy
          • Channel Strategy
      • Applied Robotics Inc.
        • Overview
        • Product Portfolio
        • Profitability by Market Segments (Product/Age /Sales Channel/Region)
        • Sales Footprint
        • Strategy Overview
          • Marketing Strategy
          • Product Strategy
          • Channel Strategy
      • EMI Corporation
        • Overview
        • Product Portfolio
        • Profitability by Market Segments (Product/Age /Sales Channel/Region)
        • Sales Footprint
        • Strategy Overview
          • Marketing Strategy
          • Product Strategy
          • Channel Strategy
      • J. Schmalz GmbH
        • Overview
        • Product Portfolio
        • Profitability by Market Segments (Product/Age /Sales Channel/Region)
        • Sales Footprint
        • Strategy Overview
          • Marketing Strategy
          • Product Strategy
          • Channel Strategy
  20. Assumptions & Acronyms Used
  21. Research Methodology

List Of Table

Table 1: Global Market Value (USD Bn) Forecast by Region, 2020 to 2035
Table 2: Global Market Volume (Units) Forecast by Region, 2020 to 2035
Table 3: Global Market Value (USD Bn) Forecast by Product Type, 2020 to 2035
Table 4: Global Market Volume (Units) Forecast by Product Type, 2020 to 2035
Table 5: Global Market Value (USD Bn) Forecast by End-use, 2020 to 2035
Table 6: Global Market Volume (Units) Forecast by End-use, 2020 to 2035
Table 7: Global Market Value (USD Bn) Forecast by Process Line, 2020 to 2035
Table 8: Global Market Volume (Units) Forecast by Process Line, 2020 to 2035
Table 9: North America Market Value (USD Bn) Forecast by Country, 2020 to 2035
Table 10: North America Market Volume (Units) Forecast by Country, 2020 to 2035
Table 11: North America Market Value (USD Bn) Forecast by Product Type, 2020 to 2035
Table 12: North America Market Volume (Units) Forecast by Product Type, 2020 to 2035
Table 13: North America Market Value (USD Bn) Forecast by End-use, 2020 to 2035
Table 14: North America Market Volume (Units) Forecast by End-use, 2020 to 2035
Table 15: North America Market Value (USD Bn) Forecast by Process Line, 2020 to 2035
Table 16: North America Market Volume (Units) Forecast by Process Line, 2020 to 2035
Table 17: Latin America Market Value (USD Bn) Forecast by Country, 2020 to 2035
Table 18: Latin America Market Volume (Units) Forecast by Country, 2020 to 2035
Table 19: Latin America Market Value (USD Bn) Forecast by Product Type, 2020 to 2035
Table 20: Latin America Market Volume (Units) Forecast by Product Type, 2020 to 2035
Table 21: Latin America Market Value (USD Bn) Forecast by End-use, 2020 to 2035
Table 22: Latin America Market Volume (Units) Forecast by End-use, 2020 to 2035
Table 23: Latin America Market Value (USD Bn) Forecast by Process Line, 2020 to 2035
Table 24: Latin America Market Volume (Units) Forecast by Process Line, 2020 to 2035
Table 25: Western Europe Market Value (USD Bn) Forecast by Country, 2020 to 2035
Table 26: Western Europe Market Volume (Units) Forecast by Country, 2020 to 2035
Table 27: Western Europe Market Value (USD Bn) Forecast by Product Type, 2020 to 2035
Table 28: Western Europe Market Volume (Units) Forecast by Product Type, 2020 to 2035
Table 29: Western Europe Market Value (USD Bn) Forecast by End-use, 2020 to 2035
Table 30: Western Europe Market Volume (Units) Forecast by End-use, 2020 to 2035
Table 31: Western Europe Market Value (USD Bn) Forecast by Process Line, 2020 to 2035
Table 32: Western Europe Market Volume (Units) Forecast by Process Line, 2020 to 2035
Table 33: East Asia Market Value (USD Bn) Forecast by Country, 2020 to 2035
Table 34: East Asia Market Volume (Units) Forecast by Country, 2020 to 2035
Table 35: East Asia Market Value (USD Bn) Forecast by Product Type, 2020 to 2035
Table 36: East Asia Market Volume (Units) Forecast by Product Type, 2020 to 2035
Table 37: East Asia Market Value (USD Bn) Forecast by End-use, 2020 to 2035
Table 38: East Asia Market Volume (Units) Forecast by End-use, 2020 to 2035
Table 39: East Asia Market Value (USD Bn) Forecast by Process Line, 2020 to 2035
Table 40: East Asia Market Volume (Units) Forecast by Process Line, 2020 to 2035
Table 41: South Asia Pacific Market Value (USD Bn) Forecast by Country, 2020 to 2035
Table 42: South Asia Pacific Market Volume (Units) Forecast by Country, 2020 to 2035
Table 43: South Asia Pacific Market Value (USD Bn) Forecast by Product Type, 2020 to 2035
Table 44: South Asia Pacific Market Volume (Units) Forecast by Product Type, 2020 to 2035
Table 45: South Asia Pacific Market Value (USD Bn) Forecast by End-use, 2020 to 2035
Table 46: South Asia Pacific Market Volume (Units) Forecast by End-use, 2020 to 2035
Table 47: South Asia Pacific Market Value (USD Bn) Forecast by Process Line, 2020 to 2035
Table 48: South Asia Pacific Market Volume (Units) Forecast by Process Line, 2020 to 2035
Table 49: Eastern Europe Market Value (USD Bn) Forecast by Country, 2020 to 2035
Table 50: Eastern Europe Market Volume (Units) Forecast by Country, 2020 to 2035
Table 51: Eastern Europe Market Value (USD Bn) Forecast by Product Type, 2020 to 2035
Table 52: Eastern Europe Market Volume (Units) Forecast by Product Type, 2020 to 2035
Table 53: Eastern Europe Market Value (USD Bn) Forecast by End-use, 2020 to 2035
Table 54: Eastern Europe Market Volume (Units) Forecast by End-use, 2020 to 2035
Table 55: Eastern Europe Market Value (USD Bn) Forecast by Process Line, 2020 to 2035
Table 56: Eastern Europe Market Volume (Units) Forecast by Process Line, 2020 to 2035
Table 57: Middle East & Africa Market Value (USD Bn) Forecast by Country, 2020 to 2035
Table 58: Middle East & Africa Market Volume (Units) Forecast by Country, 2020 to 2035
Table 59: Middle East & Africa Market Value (USD Bn) Forecast by Product Type, 2020 to 2035
Table 60: Middle East & Africa Market Volume (Units) Forecast by Product Type, 2020 to 2035
Table 61: Middle East & Africa Market Value (USD Bn) Forecast by End-use, 2020 to 2035
Table 62: Middle East & Africa Market Volume (Units) Forecast by End-use, 2020 to 2035
Table 63: Middle East & Africa Market Value (USD Bn) Forecast by Process Line, 2020 to 2035
Table 64: Middle East & Africa Market Volume (Units) Forecast by Process Line, 2020 to 2035

List Of Figures

Figure 1: Global Market Volume (Units) Forecast 2020 to 2035
Figure 2: Global Market Pricing Analysis
Figure 3: Global Market Value (USD Bn) Forecast 2020 to 2035
Figure 4: Global Market Value Share and BPS Analysis by Product Type, 2025 and 2035
Figure 5: Global Market Y-o-Y Growth Comparison by Product Type, 2025 to 2035
Figure 6: Global Market Attractiveness Analysis by Product Type
Figure 7: Global Market Value Share and BPS Analysis by End-use, 2025 and 2035
Figure 8: Global Market Y-o-Y Growth Comparison by End-use, 2025 to 2035
Figure 9: Global Market Attractiveness Analysis by End-use
Figure 10: Global Market Value Share and BPS Analysis by Process Line, 2025 and 2035
Figure 11: Global Market Y-o-Y Growth Comparison by Process Line, 2025 to 2035
Figure 12: Global Market Attractiveness Analysis by Process Line
Figure 13: Global Market Value (USD Bn) Share and BPS Analysis by Region, 2025 and 2035
Figure 14: Global Market Y-o-Y Growth Comparison by Region, 2025 to 2035
Figure 15: Global Market Attractiveness Analysis by Region
Figure 16: North America Market Incremental $ Opportunity, 2025 to 2035
Figure 17: Latin America Market Incremental $ Opportunity, 2025 to 2035
Figure 18: Western Europe Market Incremental $ Opportunity, 2025 to 2035
Figure 19: East Asia Market Incremental $ Opportunity, 2025 to 2035
Figure 20: South Asia Pacific Market Incremental $ Opportunity, 2025 to 2035
Figure 21: Eastern Europe Market Incremental $ Opportunity, 2025 to 2035
Figure 22: Middle East & Africa Market Incremental $ Opportunity, 2025 to 2035
Figure 23: North America Market Value Share and BPS Analysis by Country, 2025 and 2035
Figure 24: North America Market Value Share and BPS Analysis by Product Type, 2025 and 2035
Figure 25: North America Market Y-o-Y Growth Comparison by Product Type, 2025 to 2035
Figure 26: North America Market Attractiveness Analysis by Product Type
Figure 27: North America Market Value Share and BPS Analysis by End-use, 2025 and 2035
Figure 28: North America Market Y-o-Y Growth Comparison by End-use, 2025 to 2035
Figure 29: North America Market Attractiveness Analysis by End-use
Figure 30: North America Market Value Share and BPS Analysis by Process Line, 2025 and 2035
Figure 31: North America Market Y-o-Y Growth Comparison by Process Line, 2025 to 2035
Figure 32: North America Market Attractiveness Analysis by Process Line
Figure 33: Latin America Market Value Share and BPS Analysis by Country, 2025 and 2035
Figure 34: Latin America Market Value Share and BPS Analysis by Product Type, 2025 and 2035
Figure 35: Latin America Market Y-o-Y Growth Comparison by Product Type, 2025 to 2035
Figure 36: Latin America Market Attractiveness Analysis by Product Type
Figure 37: Latin America Market Value Share and BPS Analysis by End-use, 2025 and 2035
Figure 38: Latin America Market Y-o-Y Growth Comparison by End-use, 2025 to 2035
Figure 39: Latin America Market Attractiveness Analysis by End-use
Figure 40: Latin America Market Value Share and BPS Analysis by Process Line, 2025 and 2035
Figure 41: Latin America Market Y-o-Y Growth Comparison by Process Line, 2025 to 2035
Figure 42: Latin America Market Attractiveness Analysis by Process Line
Figure 43: Western Europe Market Value Share and BPS Analysis by Country, 2025 and 2035
Figure 44: Western Europe Market Value Share and BPS Analysis by Product Type, 2025 and 2035
Figure 45: Western Europe Market Y-o-Y Growth Comparison by Product Type, 2025 to 2035
Figure 46: Western Europe Market Attractiveness Analysis by Product Type
Figure 47: Western Europe Market Value Share and BPS Analysis by End-use, 2025 and 2035
Figure 48: Western Europe Market Y-o-Y Growth Comparison by End-use, 2025 to 2035
Figure 49: Western Europe Market Attractiveness Analysis by End-use
Figure 50: Western Europe Market Value Share and BPS Analysis by Process Line, 2025 and 2035
Figure 51: Western Europe Market Y-o-Y Growth Comparison by Process Line, 2025 to 2035
Figure 52: Western Europe Market Attractiveness Analysis by Process Line
Figure 53: East Asia Market Value Share and BPS Analysis by Country, 2025 and 2035
Figure 54: East Asia Market Value Share and BPS Analysis by Product Type, 2025 and 2035
Figure 55: East Asia Market Y-o-Y Growth Comparison by Product Type, 2025 to 2035
Figure 56: East Asia Market Attractiveness Analysis by Product Type
Figure 57: East Asia Market Value Share and BPS Analysis by End-use, 2025 and 2035
Figure 58: East Asia Market Y-o-Y Growth Comparison by End-use, 2025 to 2035
Figure 59: East Asia Market Attractiveness Analysis by End-use
Figure 60: East Asia Market Value Share and BPS Analysis by Process Line, 2025 and 2035
Figure 61: East Asia Market Y-o-Y Growth Comparison by Process Line, 2025 to 2035
Figure 62: East Asia Market Attractiveness Analysis by Process Line
Figure 63: South Asia Pacific Market Value Share and BPS Analysis by Country, 2025 and 2035
Figure 64: South Asia Pacific Market Value Share and BPS Analysis by Product Type, 2025 and 2035
Figure 65: South Asia Pacific Market Y-o-Y Growth Comparison by Product Type, 2025 to 2035
Figure 66: South Asia Pacific Market Attractiveness Analysis by Product Type
Figure 67: South Asia Pacific Market Value Share and BPS Analysis by End-use, 2025 and 2035
Figure 68: South Asia Pacific Market Y-o-Y Growth Comparison by End-use, 2025 to 2035
Figure 69: South Asia Pacific Market Attractiveness Analysis by End-use
Figure 70: South Asia Pacific Market Value Share and BPS Analysis by Process Line, 2025 and 2035
Figure 71: South Asia Pacific Market Y-o-Y Growth Comparison by Process Line, 2025 to 2035
Figure 72: South Asia Pacific Market Attractiveness Analysis by Process Line
Figure 73: Eastern Europe Market Value Share and BPS Analysis by Country, 2025 and 2035
Figure 74: Eastern Europe Market Value Share and BPS Analysis by Product Type, 2025 and 2035
Figure 75: Eastern Europe Market Y-o-Y Growth Comparison by Product Type, 2025 to 2035
Figure 76: Eastern Europe Market Attractiveness Analysis by Product Type
Figure 77: Eastern Europe Market Value Share and BPS Analysis by End-use, 2025 and 2035
Figure 78: Eastern Europe Market Y-o-Y Growth Comparison by End-use, 2025 to 2035
Figure 79: Eastern Europe Market Attractiveness Analysis by End-use
Figure 80: Eastern Europe Market Value Share and BPS Analysis by Process Line, 2025 and 2035
Figure 81: Eastern Europe Market Y-o-Y Growth Comparison by Process Line, 2025 to 2035
Figure 82: Eastern Europe Market Attractiveness Analysis by Process Line
Figure 83: Middle East & Africa Market Value Share and BPS Analysis by Country, 2025 and 2035
Figure 84: Middle East & Africa Market Value Share and BPS Analysis by Product Type, 2025 and 2035
Figure 85: Middle East & Africa Market Y-o-Y Growth Comparison by Product Type, 2025 to 2035
Figure 86: Middle East & Africa Market Attractiveness Analysis by Product Type
Figure 87: Middle East & Africa Market Value Share and BPS Analysis by End-use, 2025 and 2035
Figure 88: Middle East & Africa Market Y-o-Y Growth Comparison by End-use, 2025 to 2035
Figure 89: Middle East & Africa Market Attractiveness Analysis by End-use
Figure 90: Middle East & Africa Market Value Share and BPS Analysis by Process Line, 2025 and 2035
Figure 91: Middle East & Africa Market Y-o-Y Growth Comparison by Process Line, 2025 to 2035
Figure 92: Middle East & Africa Market Attractiveness Analysis by Process Line
Figure 93: Global Market - Tier Structure Analysis
Figure 94: Global Market - Company Share Analysis

- FAQs -

What is the Global Robotic End of Arm Tool Market Size in 2025?

The robotic end of arm tool market is valued at USD 2.2 billion in 2025.

Who are the Major Players Operating in the Robotic End of Arm Tool Market?

Prominent players in the market include Schunk GmbH & Co. KG, Festo Inc., ASS Maschinenbau GmbH, Robotiq Inc., and Zimmer Group.

What is the Estimated Valuation of the Robotic End of Arm Tool Market by 2035?

The market is expected to reach a valuation of USD 5.8 billion by 2035.

What Value CAGR is the Robotic End of Arm Tool Market Exhibit Over the Last Five Years?

The growth rate of the robotic end of arm tool market is 8.8% from 2020-2024.

Robotic End of Arm Tool Market

Schedule a Call