Stump Grinder Market

Stump Grinder Market Analysis, By Machine Type, By Tooth Length, By Number of Cutting Teeth, By Cutting Edge Per Tooth, By End-User, and Region - Market Insights 2025 to 2035

Analysis Of Stump Grinder Market Covering 30+ Countries Including Analysis Of US, Canada, UK, Germany, France, Nordics, GCC Countries, Japan, Korea And Many More

Stump Grinder Market Outlook (2025 to 2035)

The global stump grinder market is forecast to reach USD 812.5 million by 2035, up from USD 523.2 million in 2025. During the forecast period, the industry is projected to register at a CAGR of 4.5%, driven by the increasing prevalence of automation in forestry and landscaping operations, as well as the growing emphasis on operator safety and efficiency across various end-use industries.

Stump Grinder Market Value (USD Million) 2025 To 2035

What are the drivers of stump grinder market?

The market is significantly influenced by the increasing emphasis on safety and risk mitigation associated with tree roots, as well as the growing demand for well-maintained landscapes and visually appealing outdoor spaces. Additionally, the market is influenced by the growth in urbanization and infrastructure development.

Additionally, market players in the stump grinder industry are emphasizing the development of grinders that incorporate cutting-edge technology, such as the creation of more durable cutting teeth, innovative grinding wheel designs, and enhanced cutting systems that facilitate faster and more effective stump removal.

The necessity of efficient land preparation becomes increasingly critical as cities expand and new residential and commercial areas are established. Stump cutter grinders are essential in this process, as they facilitate the smooth reclamation and construction of land by efficiently removing tree stumps and detritus.

This demand is further intensified by the growing recognition of the importance of sustainable landscaping practices, which promote the efficient management of land and the reuse of soil materials. Additionally, landowners, developers, and municipal authorities are motivated to invest in high-quality stump-cutting solutions by the increase in property value that results from well-maintained landscapes.

Companies are expected to innovate and provide advanced machinery that ensures quicker and more efficient stump removal operations, as the stump cutter grinder market continues to expand in line with the accelerating pace of urbanization and infrastructure development.

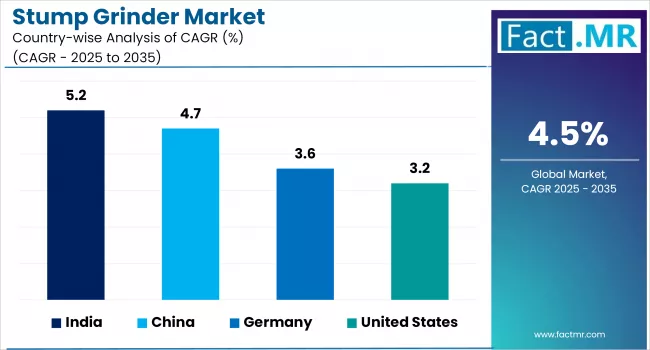
What are the regional trends of the stump grinder market?

The regional trends of the stump grinder market show distinct patterns across key global areas. The Asia-Pacific region is expected to lead the market in both revenue and market share, driven by increased municipal and forestry expenditures, as well as the growing adoption of stump grinders in countries such as China, Japan, and India.

North America is expected to hold a significant share in 2025, supported by strong demand from the region’s active landscaping, construction, and forestry industries. It offers a wide range of stump grinding solutions tailored to diverse professional needs. Europe is projected to be the fastest-growing region, primarily due to the increasing adoption of advanced equipment and Western landscaping practices, particularly in countries such as Germany, France, and the UK.

Meanwhile, regions such as Latin America, the Middle East, and Africa are also experiencing growth, albeit at a more moderate pace, driven by urbanization and the gradual shift toward mechanized land clearing solutions. Overall, global market expansion is supported by trends in urbanization, infrastructure development, and technological advancements in stump grinding equipment.

What are the challenges and restraining factors of stump grinder market?

The stump grinder market faces several significant challenges and restraining factors that impact its growth and adoption. High initial equipment costs are a primary barrier, particularly for small businesses and individual users, as the upfront investment required for advanced stump grinders can be prohibitive.

Another key challenge is the requirement for skilled operators; the complexity of modern stump grinders necessitates trained personnel, which can limit broader adoption and increase labor costs.

Stringent environmental regulations and restrictions on land clearing practices also pose hurdles, as compliance can add to operational complexity and costs. Additionally, safety concerns such as risks from high-speed cutting wheels, flying debris, and proximity to underground utilities can deter smaller contractors and municipalities from investing in stump grinders, particularly in areas where training resources and safety compliance are limited.

Country-Wise Outlook

United States stump grinder market sees growth as businesses and homeowners seek improved performance and sustainability

Stump Grinder Market By Country

The market is experiencing growth primarily due to the increasing demand for land clearing and development, driven by the construction and real estate sectors, urbanization, and infrastructure projects. As cities expand and new buildings and roads are constructed, the need for efficient removal of tree stumps grows, making stump grinders essential equipment for both commercial and residential landscaping and forestry activities.

US Stump Grinder Market Value (USD Million) 2025 To 2035

Technological advancements such as more efficient, durable, and user-friendly stump grinders are also propelling market growth as businesses and homeowners seek improved performance and sustainability. Manufacturers are focusing on innovations such as advanced cutting systems and environmentally friendly designs to meet evolving customer demands.

China witnesses rapid market growth backed by increased investment by government

Increased investment from Chinese authorities in modernizing forestry operations is a major driver, supporting the adoption of advanced stump grinding machinery. The central government has allocated USD 11 billion, specifically for equipment upgrades and trade-in subsidies, with an expanded scope that now covers new sectors, including agricultural and forestry equipment.

These subsidies are designed to encourage businesses to replace outdated machinery with more advanced, efficient, and environmentally friendly alternatives. Up to 20% subsidies are available for equipment upgrades, making it more financially attractive for forestry operators to invest in modern machinery such as stump grinders.

The growth of large-scale timber plantations and the presence of major wood industry companies are fueling demand for efficient stump removal solutions. China has established nearly 54 million hectares of new timber plantations, with a strong focus on fast-growing and high-yielding species to meet the rising demand for domestic and industrial wood.

These plantations are concentrated in regions with favorable conditions, such as eastern and southern provinces, and are managed on a large scale using modern forestry techniques. Economic growth, urbanization, and the booming construction and manufacturing sectors have significantly increased the demand for timber and wood products.

For example, cities like Shanghai consume millions of cubic meters of timber annually for construction, furniture, and other manufacturing purposes. Thus, stump grinders, to support efficient land management and meet the increasing need for wood products, it fueling demand for advanced stump removal equipment.

Germany's urbanization and infrastructure development fuels demand for stump grinder

The ongoing urban expansion in cities such as Berlin, Munich, and Frankfurt has increased the need for land preparation and landscaping services, further boosting stump grinder demand. Major infrastructure projects, such as the A3 Autobahn expansion, require extensive stump removal, highlighting the importance of these machines in construction and urban renewal.

The transition to renewable energy and the growing demand for biomass and wood-based energy products have intensified logging and land-clearing activities, necessitating efficient stump grinding for reforestation and biomass production.

German engineering is renowned for producing high-quality, durable stump grinders that can operate in challenging environments. Leading global brands, such as Vermeer, FAE Group, and Bandit, have strong partnerships with German firms, emphasizing innovation and reliability.

In September 2023, Greentec introduced Piranha 10. This new addition to the German market is the largest mechanically driven stump grinder in the Piranha family, designed for tractors with 150-400 hp. It features a 1000mm grinding wheel, double-arm construction for extended reach, and a hydraulically adjustable protective cover to minimize debris.

The Piranha 10 is optimized for large-scale stump removal, including deep grinding up to 145cm and efficient operation on slopes or ditch edges. These launches reflect a focus on increased power, operator safety, and adaptability to diverse terrains and project scales in the German stump grinder market.

Category-wise Analysis

Self-Propelled to Exhibit Leading by Machine Type

Stump Grinder Market By Machine Type

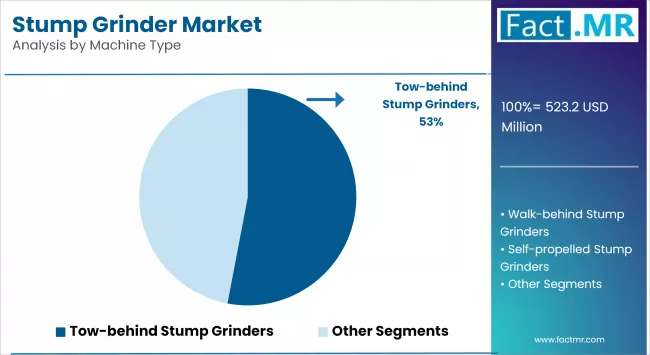
Self-propelled stump grinders dominate the market due to their high maneuverability, power, and efficiency, making them ideal for both residential and commercial landscaping tasks. Among them, wheeled variants are widely preferred for their ability to navigate across varied terrain.

Tracked self-propelled stump grinders are witnessing the fastest growth, particularly in rugged and uneven terrains where stability and traction are essential. Their growing use by professional landscapers and municipal services is fueling demand.

2.5 to 3 to Exhibit Leading by Tooth Length

Stump Grinder Market By Tooth Leangth

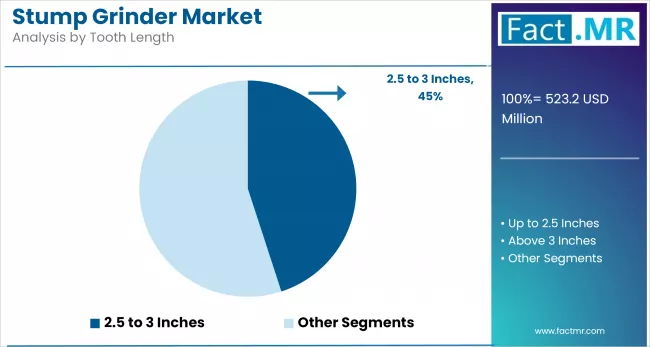
The 2.5 to 3-inch tooth length segment dominates the market due to its balanced performance, offering versatility in handling a wide range of stump sizes. This segment is preferred for its optimal combination of cutting power and efficiency, making it suitable for both residential and commercial applications. These grinders are the most commonly used due to their balance of cutting efficiency and durability, ideal for a wide range of stump sizes in both urban and rural settings.

The above 3-inch segment is the fastest-growing category, catering to the increasing demand for machines capable of efficiently handling larger and more challenging stumps. This segment is particularly appealing to contractors and forestry professionals involved in extensive land-clearing projects.

16 to 24 to Exhibit Leading by Number of Cutting Teeth

Stump grinders with 16 to 24 cutting teeth dominate the market due to their ideal balance between performance and affordability. They offer reliable cutting efficiency for most residential and small commercial applications. This range is favored by landscaping professionals and rental users alike. Their availability across brands and models makes them the most accessible option for general use..

Grinders equipped with more than 32 cutting teeth are rapidly gaining traction among industrial and municipal users. They are designed for high-efficiency, large-scale stump removal projects. Their rise reflects the growing preference for productivity in time-sensitive operations.

Two Cutting to Exhibit Leading by Cutting Edge Per Tooth

Two-edge teeth are the industry standard, delivering durability at a competitive cost. These teeth are easier to manufacture, replace, and maintain. They are ideal for typical landscaping and moderate-duty commercial tasks. The simplicity of two-edge teeth allows for widespread adoption across regions. Their dominance is also attributed to better availability and compatibility with most grinder models.

Three-edge teeth are becoming increasingly popular for their extended operational life. With an extra cutting surface, they reduce downtime between maintenance cycles. They offer smoother operation and better efficiency in harder wood types. Professionals are adopting them to reduce long-term maintenance costs. As grinding demands intensify, the appeal of high-performance teeth is accelerating market growth.

Rental to Exhibit Leading by End-User

Rental companies hold the highest market share due to the high upfront cost of stump grinders. These businesses cater to seasonal, one-time, or small-scale users. The rental model is particularly popular in urban and suburban regions. It allows access to different machine types without ownership or maintenance burdens. The flexibility and convenience they offer drive steady demand across use cases.

Government agencies are increasingly investing in stump grinders for the maintenance of public lands. This includes clearing roadsides, parks, and utility corridors. Climate-related events, such as storms, also drive public-sector demand for rapid debris removal. Procurement of durable, high-performance machines is a priority for municipalities. Their commitment to sustainable land use and infrastructure safety fuels segment growth

Competitive Analysis

The remote-controlled stump grinder market is becoming increasingly competitive, with a mix of established manufacturers, emerging competitors, and specialized equipment providers. In order to preserve their competitive advantage, market leaders prioritize strategic partnerships, product differentiation, and continuous innovation.

Companies are endeavoring to introduce advanced features, including enhanced battery life, real-time diagnostics, and autonomous operation capabilities, by prioritizing investment in research and development. The integration of digital solutions and smart technologies has become a critical differentiator, enabling manufacturers to offer value-added services and foster consumer loyalty.

Manufacturers are addressing the evolving requirements of diverse end-user segments through the expansion of their product portfolios. This encompasses the creation of compact, user-friendly models for residential consumers, as well as high-capacity, rugged devices for commercial and industrial applications.

The significance of customization and modular design is on the rise, as they enable customers to customize equipment configurations to meet the specific needs of their projects. Market reach and brand visibility are further enhanced through strategic partnerships with technology providers, industry associations, and distributors.

Key players in the stump grinder industry are Caterpillar Inc., Morbark, LLC, MTB Mfg Inc., Vermeer Corporation, Tracmaster Ltd., Predator Power Ltd., Wacker Neuson SE, Avant Tecno Oy, Sneller Machine, D&M Machine Division, Inc., Bandit Industries, Inc., Green Manufacturing, Inc., J.P. Carlton Company, HAWK Equipment Corporation and other players.

Recent Development

  • In February 2025, Baumalight introduced the 1P14 Stump Grinder, a tractor-mounted model designed for efficient stump removal. This attachment is designed for smaller tractors equipped with a hydrostatic drive and a Category I 3PH (three-point hitch) system.
  • In February 2024, Rotadairon launched the RS 480 stump grinder, an attachment designed for mini hydraulic loaders (skid steers). This machine is designed to efficiently grind, trim, and crush a wide range of tree stumps.

Segmentation of Stump Grinder Market

  • By Machine Type :

    • Walk-behind Stump Grinders
    • Self-propelled Stump Grinders
    • Wheeled
    • Tracked
    • Tow-behind Stump Grinders
  • By Tooth Length :

    • Up to 2.5 Inches
    • 2.5 to 3 Inches
    • Above 3 Inches
  • By Number of Cutting Teeth :

    • 8 to 16
    • 16 to 24
    • 24 to 32
    • Above 32
  • By Cutting Edge Per Tooth :

    • Two
    • Three
  • By End-User :

    • Personal/Private
    • Governments
    • Rental Companies
  • By Region :

    • North America
    • Latin America
    • Western Europe
    • Eastern Europe
    • East Asia
    • South Asia & Pacific
    • Middle East & Africa

Table of Content

  1. Executive Summary
    • Global Market Outlook
    • Demand-side Trends
    • Supply-side Trends
    • Technology Roadmap Analysis
    • Analysis and Recommendations
  2. Market Overview
    • Market Coverage / Taxonomy
    • Market Definition / Scope / Limitations
  3. Market Background
    • Market Dynamics
      • Drivers
      • Restraints
      • Opportunity
      • Trends
    • Scenario Forecast
      • Demand in Optimistic Scenario
      • Demand in Likely Scenario
      • Demand in Conservative Scenario
    • Opportunity Map Analysis
    • Product Life Cycle Analysis
    • Supply Chain Analysis
      • Supply Side Participants and their Roles
        • Producers
        • Mid-Level Participants (Traders/ Agents/ Brokers)
        • Wholesalers and Distributors
      • Value Added and Value Created at Node in the Supply Chain
      • List of Component Suppliers
      • List of Existing and Potential Buyers
    • Investment Feasibility Matrix
    • Value Chain Analysis
      • Profit Margin Analysis
      • Wholesalers and Distributors
    • PESTLE and Porter’s Analysis
    • Regulatory Landscape
      • By Key Regions
      • By Key Countries
    • Production and Consumption Statistics
    • Import and Export Statistics
  4. Global Market Analysis 2020-2024 and Forecast, 2025-2035
    • Historical Market Size Value (USD Mn) & Volume (Units) Analysis, 2020-2024
    • Current and Future Market Size Value (USD Mn) & Volume (Units) Projections, 2025-2035
      • Y-o-Y Growth Trend Analysis
      • Absolute $ Opportunity Analysis
  5. Global Market Pricing Analysis 2020-2024 and Forecast 2025-2035
  6. Global Market Analysis 2020-2024 and Forecast 2025-2035, By Machine Type
    • Introduction / Key Findings
    • Historical Market Size Value (USD Mn) & Volume (Units) Analysis By Machine Type, 2020-2024
    • Current and Future Market Size Value (USD Mn) & Volume (Units) Analysis and Forecast By Machine Type, 2025-2035
      • Walk-behind Stump Grinders
      • Self-propelled Stump Grinders
        • Wheeled
        • Tracked
      • Tow-behind Stump Grinders
    • Y-o-Y Growth Trend Analysis By Machine Type, 2020-2024
    • Absolute $ Opportunity Analysis By Machine Type, 2025-2035
  7. Global Market Analysis 2020-2024 and Forecast 2025-2035, By Tooth Length
    • Introduction / Key Findings
    • Historical Market Size Value (USD Mn) & Volume (Units) Analysis By Tooth Length, 2020-2024
    • Current and Future Market Size Value (USD Mn) & Volume (Units) Analysis and Forecast By Tooth Length, 2025-2035
      • Up to 2.5 Inches
      • 2.5 to 3 Inches
      • Above 3 Inches
    • Y-o-Y Growth Trend Analysis By Tooth Length, 2020-2024
    • Absolute $ Opportunity Analysis By Tooth Length, 2025-2035
  8. Global Market Analysis 2020-2024 and Forecast 2025-2035, By Number of Cutting Teeth
    • Introduction / Key Findings
    • Historical Market Size Value (USD Mn) & Volume (Units) Analysis By Number of Cutting Teeth, 2020-2024
    • Current and Future Market Size Value (USD Mn) & Volume (Units) Analysis and Forecast By Number of Cutting Teeth, 2025-2035
      • 8 to 16
      • 16 to 24
      • 24 to 32
      • Above 32
    • Y-o-Y Growth Trend Analysis By Number of Cutting Teeth, 2020-2024
    • Absolute $ Opportunity Analysis By Number of Cutting Teeth, 2025-2035
  9. Global Market Analysis 2020-2024 and Forecast 2025-2035, By Cutting Edge Per Tooth
    • Introduction / Key Findings
    • Historical Market Size Value (USD Mn) & Volume (Units) Analysis By Cutting Edge Per Tooth, 2020-2024
    • Current and Future Market Size Value (USD Mn) & Volume (Units) Analysis and Forecast By Cutting Edge Per Tooth, 2025-2035
      • Two
      • Three
    • Y-o-Y Growth Trend Analysis By Cutting Edge Per Tooth, 2020-2024
    • Absolute $ Opportunity Analysis By Cutting Edge Per Tooth, 2025-2035
  10. Global Market Analysis 2020-2024 and Forecast 2025-2035, By End-User
    • Introduction / Key Findings
    • Historical Market Size Value (USD Mn) & Volume (Units) Analysis By End-User, 2020-2024
    • Current and Future Market Size Value (USD Mn) & Volume (Units) Analysis and Forecast By End-User, 2025-2035
      • Personal/Private
      • Governments
      • Rental Companies
    • Y-o-Y Growth Trend Analysis By End-User, 2020-2024
    • Absolute $ Opportunity Analysis By End-User, 2025-2035
  11. Global Market Analysis 2020-2024 and Forecast 2025-2035, By Region
    • Introduction
    • Historical Market Size Value (USD Mn) & Volume (Units) Analysis By Region, 2020-2024
    • Current Market Size Value (USD Mn) & Volume (Units) Analysis and Forecast By Region, 2025-2035
      • North America
      • Latin America
      • Western Europe
      • East Asia
      • South Asia Pacific
      • Eastern Europe
      • Middle East & Africa
    • Market Attractiveness Analysis By Region
  12. North America Market Analysis 2020-2024 and Forecast 2025-2035, By Country
    • Historical Market Size Value (USD Mn) & Volume (Units) Trend Analysis By Market Taxonomy, 2020-2024
    • Market Size Value (USD Mn) & Volume (Units) Forecast By Market Taxonomy, 2025-2035
      • By Country
        • U.S.
        • Canada
        • Mexico
      • By Machine Type
      • By Tooth Length
      • By Number of Cutting Teeth
      • By Cutting Edge Per Tooth
      • By End-User
    • Market Attractiveness Analysis
      • By Country
      • By Machine Type
      • By Tooth Length
      • By Number of Cutting Teeth
      • By Cutting Edge Per Tooth
      • By End-User
    • Key Takeaways
  13. Latin America Market Analysis 2020-2024 and Forecast 2025-2035, By Country
    • Historical Market Size Value (USD Mn) & Volume (Units) Trend Analysis By Market Taxonomy, 2020-2024
    • Market Size Value (USD Mn) & Volume (Units) Forecast By Market Taxonomy, 2025-2035
      • By Country
        • Brazil
        • Chile
        • Rest of Latin America
      • By Machine Type
      • By Tooth Length
      • By Number of Cutting Teeth
      • By Cutting Edge Per Tooth
      • By End-User
    • Market Attractiveness Analysis
      • By Country
      • By Machine Type
      • By Tooth Length
      • By Number of Cutting Teeth
      • By Cutting Edge Per Tooth
      • By End-User
    • Key Takeaways
  14. Western Europe Market Analysis 2020-2024 and Forecast 2025-2035, By Country
    • Historical Market Size Value (USD Mn) & Volume (Units) Trend Analysis By Market Taxonomy, 2020-2024
    • Market Size Value (USD Mn) & Volume (Units) Forecast By Market Taxonomy, 2025-2035
      • By Country
        • Germany
        • Italy
        • France
        • U.K.
        • Spain
        • Russia
        • BENELUX
        • Rest of Europe
      • By Machine Type
      • By Tooth Length
      • By Number of Cutting Teeth
      • By Cutting Edge Per Tooth
      • By End-User
    • Market Attractiveness Analysis
      • By Country
      • By Machine Type
      • By Tooth Length
      • By Number of Cutting Teeth
      • By Cutting Edge Per Tooth
      • By End-User
    • Key Takeaways
  15. East Asia Market Analysis 2020-2024 and Forecast 2025-2035, By Country
    • Historical Market Size Value (USD Mn) & Volume (Units) Trend Analysis By Market Taxonomy, 2020-2024
    • Market Size Value (USD Mn) & Volume (Units) Forecast By Market Taxonomy, 2025-2035
      • By Country
        • China
        • Japan
        • South Korea
      • By Machine Type
      • By Tooth Length
      • By Number of Cutting Teeth
      • By Cutting Edge Per Tooth
      • By End-User
    • Market Attractiveness Analysis
      • By Country
      • By Machine Type
      • By Tooth Length
      • By Number of Cutting Teeth
      • By Cutting Edge Per Tooth
      • By End-User
    • Key Takeaways
  16. South Asia Pacific Market Analysis 2020-2024 and Forecast 2025-2035, By Country
    • Historical Market Size Value (USD Mn) & Volume (Units) Trend Analysis By Market Taxonomy, 2020-2024
    • Market Size Value (USD Mn) & Volume (Units) Forecast By Market Taxonomy, 2025-2035
      • By Country
        • India
        • ASEAN Countries
        • Australia & New Zealand
        • Rest of South Asia Pacific
      • By Machine Type
      • By Tooth Length
      • By Number of Cutting Teeth
      • By Cutting Edge Per Tooth
      • By End-User
    • Market Attractiveness Analysis
      • By Country
      • By Machine Type
      • By Tooth Length
      • By Number of Cutting Teeth
      • By Cutting Edge Per Tooth
      • By End-User
    • Key Takeaways
  17. Eastern Europe Market Analysis 2020-2024 and Forecast 2025-2035, By Country
    • Historical Market Size Value (USD Mn) & Volume (Units) Trend Analysis By Market Taxonomy, 2020-2024
    • Market Size Value (USD Mn) & Volume (Units) Forecast By Market Taxonomy, 2025-2035
      • By Country
        • Russia
        • Poland
        • Hungary
        • Balkan & Baltics
        • Rest of Eastern Europe
      • By Machine Type
      • By Tooth Length
      • By Number of Cutting Teeth
      • By Cutting Edge Per Tooth
      • By End-User
    • Market Attractiveness Analysis
      • By Country
      • By Machine Type
      • By Tooth Length
      • By Number of Cutting Teeth
      • By Cutting Edge Per Tooth
      • By End-User
    • Key Takeaways
  18. Middle East & Africa Market Analysis 2020-2024 and Forecast 2025-2035, By Country
    • Historical Market Size Value (USD Mn) & Volume (Units) Trend Analysis By Market Taxonomy, 2020-2024
    • Market Size Value (USD Mn) & Volume (Units) Forecast By Market Taxonomy, 2025-2035
      • By Country
        • KSA
        • Other GCC Countries
        • Turkiye
        • South Africa
        • Rest of MEA
      • By Machine Type
      • By Tooth Length
      • By Number of Cutting Teeth
      • By Cutting Edge Per Tooth
      • By End-User
    • Market Attractiveness Analysis
      • By Country
      • By Machine Type
      • By Tooth Length
      • By Number of Cutting Teeth
      • By Cutting Edge Per Tooth
      • By End-User
    • Key Takeaways
  19. Key Countries Market Analysis
    • U.S.
      • Pricing Analysis
      • Market Share Analysis, 2024
        • By Machine Type
        • By Tooth Length
        • By Number of Cutting Teeth
        • By Cutting Edge Per Tooth
        • By End-User
    • Canada
      • Pricing Analysis
      • Market Share Analysis, 2024
        • By Machine Type
        • By Tooth Length
        • By Number of Cutting Teeth
        • By Cutting Edge Per Tooth
        • By End-User
    • Germany
      • Pricing Analysis
      • Market Share Analysis, 2024
        • By Machine Type
        • By Tooth Length
        • By Number of Cutting Teeth
        • By Cutting Edge Per Tooth
        • By End-User
    • Australia
      • Pricing Analysis
      • Market Share Analysis, 2024
        • By Machine Type
        • By Tooth Length
        • By Number of Cutting Teeth
        • By Cutting Edge Per Tooth
        • By End-User
    • U.K.
      • Pricing Analysis
      • Market Share Analysis, 2024
        • By Machine Type
        • By Tooth Length
        • By Number of Cutting Teeth
        • By Cutting Edge Per Tooth
        • By End-User
  20. Market Structure Analysis
    • Competition Dashboard
    • Competition Benchmarking
    • Market Share Analysis of Top Players
      • By Regional
      • By Machine Type
      • By Tooth Length
      • By Number of Cutting Teeth
      • By Cutting Edge per Tooth
      • By End-User
  21. Competition Analysis
    • Competition Deep Dive
      • Caterpillar Inc.
        • Overview
        • Product Portfolio
        • Profitability by Market Segments (Product/Age /Sales Channel/Region)
        • Sales Footprint
        • Strategy Overview
          • Marketing Strategy
          • Product Strategy
          • Channel Strategy
      • Morbark, LLC
        • Overview
        • Product Portfolio
        • Profitability by Market Segments (Product/Age /Sales Channel/Region)
        • Sales Footprint
        • Strategy Overview
          • Marketing Strategy
          • Product Strategy
          • Channel Strategy
      • MTB Mfg Inc.
        • Overview
        • Product Portfolio
        • Profitability by Market Segments (Product/Age /Sales Channel/Region)
        • Sales Footprint
        • Strategy Overview
          • Marketing Strategy
          • Product Strategy
          • Channel Strategy
      • Vermeer Corporation
        • Overview
        • Product Portfolio
        • Profitability by Market Segments (Product/Age /Sales Channel/Region)
        • Sales Footprint
        • Strategy Overview
          • Marketing Strategy
          • Product Strategy
          • Channel Strategy
      • Tracmaster Ltd.
        • Overview
        • Product Portfolio
        • Profitability by Market Segments (Product/Age /Sales Channel/Region)
        • Sales Footprint
        • Strategy Overview
          • Marketing Strategy
          • Product Strategy
          • Channel Strategy
      • Predator Power Ltd.
        • Overview
        • Product Portfolio
        • Profitability by Market Segments (Product/Age /Sales Channel/Region)
        • Sales Footprint
        • Strategy Overview
          • Marketing Strategy
          • Product Strategy
          • Channel Strategy
      • Wacker Neuson SE
        • Overview
        • Product Portfolio
        • Profitability by Market Segments (Product/Age /Sales Channel/Region)
        • Sales Footprint
        • Strategy Overview
          • Marketing Strategy
          • Product Strategy
          • Channel Strategy
      • Avant Tecno Oy
        • Overview
        • Product Portfolio
        • Profitability by Market Segments (Product/Age /Sales Channel/Region)
        • Sales Footprint
        • Strategy Overview
          • Marketing Strategy
          • Product Strategy
          • Channel Strategy
      • Sneller Machine
        • Overview
        • Product Portfolio
        • Profitability by Market Segments (Product/Age /Sales Channel/Region)
        • Sales Footprint
        • Strategy Overview
          • Marketing Strategy
          • Product Strategy
          • Channel Strategy
      • D&M Machine Division, Inc.
        • Overview
        • Product Portfolio
        • Profitability by Market Segments (Product/Age /Sales Channel/Region)
        • Sales Footprint
        • Strategy Overview
          • Marketing Strategy
          • Product Strategy
          • Channel Strategy
      • Bandit Industries, Inc.
        • Overview
        • Product Portfolio
        • Profitability by Market Segments (Product/Age /Sales Channel/Region)
        • Sales Footprint
        • Strategy Overview
          • Marketing Strategy
          • Product Strategy
          • Channel Strategy
      • Green Manufacturing, Inc.
        • Overview
        • Product Portfolio
        • Profitability by Market Segments (Product/Age /Sales Channel/Region)
        • Sales Footprint
        • Strategy Overview
          • Marketing Strategy
          • Product Strategy
          • Channel Strategy
      • J.P. Carlton Company
        • Overview
        • Product Portfolio
        • Profitability by Market Segments (Product/Age /Sales Channel/Region)
        • Sales Footprint
        • Strategy Overview
          • Marketing Strategy
          • Product Strategy
          • Channel Strategy
      • HAWK Equipment Corporation
        • Overview
        • Product Portfolio
        • Profitability by Market Segments (Product/Age /Sales Channel/Region)
        • Sales Footprint
        • Strategy Overview
          • Marketing Strategy
          • Product Strategy
          • Channel Strategy
  22. Assumptions & Acronyms Used
  23. Research Methodology

List Of Table

  • Table 1: Global Market Value (USD Mn) Forecast by Region, 2020 to 2035
  • Table 2: Global Market Volume (Units) Forecast by Region, 2020 to 2035
  • Table 3: Global Market Value (USD Mn) Forecast by Machine Type, 2020 to 2035
  • Table 4: Global Market Volume (Units) Forecast by Machine Type, 2020 to 2035
  • Table 5: Global Market Value (USD Mn) Forecast by Tooth Length, 2020 to 2035
  • Table 6: Global Market Volume (Units) Forecast by Tooth Length, 2020 to 2035
  • Table 7: Global Market Value (USD Mn) Forecast by Number of Cutting Teeth, 2020 to 2035
  • Table 8: Global Market Volume (Units) Forecast by Number of Cutting Teeth, 2020 to 2035
  • Table 9: Global Market Value (USD Mn) Forecast by Cutting Edge Per Tooth, 2020 to 2035
  • Table 10: Global Market Volume (Units) Forecast by Cutting Edge Per Tooth, 2020 to 2035
  • Table 11: Global Market Value (USD Mn) Forecast by End-User, 2020 to 2035
  • Table 12: Global Market Volume (Units) Forecast by End-User, 2020 to 2035
  • Table 13: North America Market Value (USD Mn) Forecast by Country, 2020 to 2035
  • Table 14: North America Market Volume (Units) Forecast by Country, 2020 to 2035
  • Table 15: North America Market Value (USD Mn) Forecast by Machine Type, 2020 to 2035
  • Table 16: North America Market Volume (Units) Forecast by Machine Type, 2020 to 2035
  • Table 17: North America Market Value (USD Mn) Forecast by Tooth Length, 2020 to 2035
  • Table 18: North America Market Volume (Units) Forecast by Tooth Length, 2020 to 2035
  • Table 19: North America Market Value (USD Mn) Forecast by Number of Cutting Teeth, 2020 to 2035
  • Table 20: North America Market Volume (Units) Forecast by Number of Cutting Teeth, 2020 to 2035
  • Table 21: North America Market Value (USD Mn) Forecast by Cutting Edge Per Tooth, 2020 to 2035
  • Table 22: North America Market Volume (Units) Forecast by Cutting Edge Per Tooth, 2020 to 2035
  • Table 23: North America Market Value (USD Mn) Forecast by End-User, 2020 to 2035
  • Table 24: North America Market Volume (Units) Forecast by End-User, 2020 to 2035
  • Table 25: Latin America Market Value (USD Mn) Forecast by Country, 2020 to 2035
  • Table 26: Latin America Market Volume (Units) Forecast by Country, 2020 to 2035
  • Table 27: Latin America Market Value (USD Mn) Forecast by Machine Type, 2020 to 2035
  • Table 28: Latin America Market Volume (Units) Forecast by Machine Type, 2020 to 2035
  • Table 29: Latin America Market Value (USD Mn) Forecast by Tooth Length, 2020 to 2035
  • Table 30: Latin America Market Volume (Units) Forecast by Tooth Length, 2020 to 2035
  • Table 31: Latin America Market Value (USD Mn) Forecast by Number of Cutting Teeth, 2020 to 2035
  • Table 32: Latin America Market Volume (Units) Forecast by Number of Cutting Teeth, 2020 to 2035
  • Table 33: Latin America Market Value (USD Mn) Forecast by Cutting Edge Per Tooth, 2020 to 2035
  • Table 34: Latin America Market Volume (Units) Forecast by Cutting Edge Per Tooth, 2020 to 2035
  • Table 35: Latin America Market Value (USD Mn) Forecast by End-User, 2020 to 2035
  • Table 36: Latin America Market Volume (Units) Forecast by End-User, 2020 to 2035
  • Table 37: Western Europe Market Value (USD Mn) Forecast by Country, 2020 to 2035
  • Table 38: Western Europe Market Volume (Units) Forecast by Country, 2020 to 2035
  • Table 39: Western Europe Market Value (USD Mn) Forecast by Machine Type, 2020 to 2035
  • Table 40: Western Europe Market Volume (Units) Forecast by Machine Type, 2020 to 2035
  • Table 41: Western Europe Market Value (USD Mn) Forecast by Tooth Length, 2020 to 2035
  • Table 42: Western Europe Market Volume (Units) Forecast by Tooth Length, 2020 to 2035
  • Table 43: Western Europe Market Value (USD Mn) Forecast by Number of Cutting Teeth, 2020 to 2035
  • Table 44: Western Europe Market Volume (Units) Forecast by Number of Cutting Teeth, 2020 to 2035
  • Table 45: Western Europe Market Value (USD Mn) Forecast by Cutting Edge Per Tooth, 2020 to 2035
  • Table 46: Western Europe Market Volume (Units) Forecast by Cutting Edge Per Tooth, 2020 to 2035
  • Table 47: Western Europe Market Value (USD Mn) Forecast by End-User, 2020 to 2035
  • Table 48: Western Europe Market Volume (Units) Forecast by End-User, 2020 to 2035
  • Table 49: East Asia Market Value (USD Mn) Forecast by Country, 2020 to 2035
  • Table 50: East Asia Market Volume (Units) Forecast by Country, 2020 to 2035
  • Table 51: East Asia Market Value (USD Mn) Forecast by Machine Type, 2020 to 2035
  • Table 52: East Asia Market Volume (Units) Forecast by Machine Type, 2020 to 2035
  • Table 53: East Asia Market Value (USD Mn) Forecast by Tooth Length, 2020 to 2035
  • Table 54: East Asia Market Volume (Units) Forecast by Tooth Length, 2020 to 2035
  • Table 55: East Asia Market Value (USD Mn) Forecast by Number of Cutting Teeth, 2020 to 2035
  • Table 56: East Asia Market Volume (Units) Forecast by Number of Cutting Teeth, 2020 to 2035
  • Table 57: East Asia Market Value (USD Mn) Forecast by Cutting Edge Per Tooth, 2020 to 2035
  • Table 58: East Asia Market Volume (Units) Forecast by Cutting Edge Per Tooth, 2020 to 2035
  • Table 59: East Asia Market Value (USD Mn) Forecast by End-User, 2020 to 2035
  • Table 60: East Asia Market Volume (Units) Forecast by End-User, 2020 to 2035
  • Table 61: South Asia Pacific Market Value (USD Mn) Forecast by Country, 2020 to 2035
  • Table 62: South Asia Pacific Market Volume (Units) Forecast by Country, 2020 to 2035
  • Table 63: South Asia Pacific Market Value (USD Mn) Forecast by Machine Type, 2020 to 2035
  • Table 64: South Asia Pacific Market Volume (Units) Forecast by Machine Type, 2020 to 2035
  • Table 65: South Asia Pacific Market Value (USD Mn) Forecast by Tooth Length, 2020 to 2035
  • Table 66: South Asia Pacific Market Volume (Units) Forecast by Tooth Length, 2020 to 2035
  • Table 67: South Asia Pacific Market Value (USD Mn) Forecast by Number of Cutting Teeth, 2020 to 2035
  • Table 68: South Asia Pacific Market Volume (Units) Forecast by Number of Cutting Teeth, 2020 to 2035
  • Table 69: South Asia Pacific Market Value (USD Mn) Forecast by Cutting Edge Per Tooth, 2020 to 2035
  • Table 70: South Asia Pacific Market Volume (Units) Forecast by Cutting Edge Per Tooth, 2020 to 2035
  • Table 71: South Asia Pacific Market Value (USD Mn) Forecast by End-User, 2020 to 2035
  • Table 72: South Asia Pacific Market Volume (Units) Forecast by End-User, 2020 to 2035
  • Table 73: Eastern Europe Market Value (USD Mn) Forecast by Country, 2020 to 2035
  • Table 74: Eastern Europe Market Volume (Units) Forecast by Country, 2020 to 2035
  • Table 75: Eastern Europe Market Value (USD Mn) Forecast by Machine Type, 2020 to 2035
  • Table 76: Eastern Europe Market Volume (Units) Forecast by Machine Type, 2020 to 2035
  • Table 77: Eastern Europe Market Value (USD Mn) Forecast by Tooth Length, 2020 to 2035
  • Table 78: Eastern Europe Market Volume (Units) Forecast by Tooth Length, 2020 to 2035
  • Table 79: Eastern Europe Market Value (USD Mn) Forecast by Number of Cutting Teeth, 2020 to 2035
  • Table 80: Eastern Europe Market Volume (Units) Forecast by Number of Cutting Teeth, 2020 to 2035
  • Table 81: Eastern Europe Market Value (USD Mn) Forecast by Cutting Edge Per Tooth, 2020 to 2035
  • Table 82: Eastern Europe Market Volume (Units) Forecast by Cutting Edge Per Tooth, 2020 to 2035
  • Table 83: Eastern Europe Market Value (USD Mn) Forecast by End-User, 2020 to 2035
  • Table 84: Eastern Europe Market Volume (Units) Forecast by End-User, 2020 to 2035
  • Table 85: Middle East & Africa Market Value (USD Mn) Forecast by Country, 2020 to 2035
  • Table 86: Middle East & Africa Market Volume (Units) Forecast by Country, 2020 to 2035
  • Table 87: Middle East & Africa Market Value (USD Mn) Forecast by Machine Type, 2020 to 2035
  • Table 88: Middle East & Africa Market Volume (Units) Forecast by Machine Type, 2020 to 2035
  • Table 89: Middle East & Africa Market Value (USD Mn) Forecast by Tooth Length, 2020 to 2035
  • Table 90: Middle East & Africa Market Volume (Units) Forecast by Tooth Length, 2020 to 2035
  • Table 91: Middle East & Africa Market Value (USD Mn) Forecast by Number of Cutting Teeth, 2020 to 2035
  • Table 92: Middle East & Africa Market Volume (Units) Forecast by Number of Cutting Teeth, 2020 to 2035
  • Table 93: Middle East & Africa Market Value (USD Mn) Forecast by Cutting Edge Per Tooth, 2020 to 2035
  • Table 94: Middle East & Africa Market Volume (Units) Forecast by Cutting Edge Per Tooth, 2020 to 2035
  • Table 95: Middle East & Africa Market Value (USD Mn) Forecast by End-User, 2020 to 2035
  • Table 96: Middle East & Africa Market Volume (Units) Forecast by End-User, 2020 to 2035

List Of Figures

  • Figure 1: Global Market Volume (Units) Forecast 2020 to 2035
  • Figure 2: Global Market Pricing Analysis
  • Figure 3: Global Market Value (USD Mn) Forecast 2020 to 2035
  • Figure 4: Global Market Value Share and BPS Analysis by Machine Type, 2025 and 2035
  • Figure 5: Global Market Y-o-Y Growth Comparison by Machine Type, 2025 to 2035
  • Figure 6: Global Market Attractiveness Analysis by Machine Type
  • Figure 7: Global Market Value Share and BPS Analysis by Tooth Length, 2025 and 2035
  • Figure 8: Global Market Y-o-Y Growth Comparison by Tooth Length, 2025 to 2035
  • Figure 9: Global Market Attractiveness Analysis by Tooth Length
  • Figure 10: Global Market Value Share and BPS Analysis by Number of Cutting Teeth, 2025 and 2035
  • Figure 11: Global Market Y-o-Y Growth Comparison by Number of Cutting Teeth, 2025 to 2035
  • Figure 12: Global Market Attractiveness Analysis by Number of Cutting Teeth
  • Figure 13: Global Market Value Share and BPS Analysis by Cutting Edge Per Tooth, 2025 and 2035
  • Figure 14: Global Market Y-o-Y Growth Comparison by Cutting Edge Per Tooth, 2025 to 2035
  • Figure 15: Global Market Attractiveness Analysis by Cutting Edge Per Tooth
  • Figure 16: Global Market Value Share and BPS Analysis by End-User, 2025 and 2035
  • Figure 17: Global Market Y-o-Y Growth Comparison by End-User, 2025 to 2035
  • Figure 18: Global Market Attractiveness Analysis by End-User
  • Figure 19: Global Market Value (USD Mn) Share and BPS Analysis by Region, 2025 and 2035
  • Figure 20: Global Market Y-o-Y Growth Comparison by Region, 2025 to 2035
  • Figure 21: Global Market Attractiveness Analysis by Region
  • Figure 22: North America Market Incremental $ Opportunity, 2025 to 2035
  • Figure 23: Latin America Market Incremental $ Opportunity, 2025 to 2035
  • Figure 24: Western Europe Market Incremental $ Opportunity, 2025 to 2035
  • Figure 25: East Asia Market Incremental $ Opportunity, 2025 to 2035
  • Figure 26: South Asia Pacific Market Incremental $ Opportunity, 2025 to 2035
  • Figure 27: Eastern Europe Market Incremental $ Opportunity, 2025 to 2035
  • Figure 28: Middle East & Africa Market Incremental $ Opportunity, 2025 to 2035
  • Figure 29: North America Market Value Share and BPS Analysis by Country, 2025 and 2035
  • Figure 30: North America Market Value Share and BPS Analysis by Machine Type, 2025 and 2035
  • Figure 31: North America Market Y-o-Y Growth Comparison by Machine Type, 2025 to 2035
  • Figure 32: North America Market Attractiveness Analysis by Machine Type
  • Figure 33: North America Market Value Share and BPS Analysis by Tooth Length, 2025 and 2035
  • Figure 34: North America Market Y-o-Y Growth Comparison by Tooth Length, 2025 to 2035
  • Figure 35: North America Market Attractiveness Analysis by Tooth Length
  • Figure 36: North America Market Value Share and BPS Analysis by Number of Cutting Teeth, 2025 and 2035
  • Figure 37: North America Market Y-o-Y Growth Comparison by Number of Cutting Teeth, 2025 to 2035
  • Figure 38: North America Market Attractiveness Analysis by Number of Cutting Teeth
  • Figure 39: North America Market Value Share and BPS Analysis by Cutting Edge Per Tooth, 2025 and 2035
  • Figure 40: North America Market Y-o-Y Growth Comparison by Cutting Edge Per Tooth, 2025 to 2035
  • Figure 41: North America Market Attractiveness Analysis by Cutting Edge Per Tooth
  • Figure 42: North America Market Value Share and BPS Analysis by End-User, 2025 and 2035
  • Figure 43: North America Market Y-o-Y Growth Comparison by End-User, 2025 to 2035
  • Figure 44: North America Market Attractiveness Analysis by End-User
  • Figure 45: Latin America Market Value Share and BPS Analysis by Country, 2025 and 2035
  • Figure 46: Latin America Market Value Share and BPS Analysis by Machine Type, 2025 and 2035
  • Figure 47: Latin America Market Y-o-Y Growth Comparison by Machine Type, 2025 to 2035
  • Figure 48: Latin America Market Attractiveness Analysis by Machine Type
  • Figure 49: Latin America Market Value Share and BPS Analysis by Tooth Length, 2025 and 2035
  • Figure 50: Latin America Market Y-o-Y Growth Comparison by Tooth Length, 2025 to 2035
  • Figure 51: Latin America Market Attractiveness Analysis by Tooth Length
  • Figure 52: Latin America Market Value Share and BPS Analysis by Number of Cutting Teeth, 2025 and 2035
  • Figure 53: Latin America Market Y-o-Y Growth Comparison by Number of Cutting Teeth, 2025 to 2035
  • Figure 54: Latin America Market Attractiveness Analysis by Number of Cutting Teeth
  • Figure 55: Latin America Market Value Share and BPS Analysis by Cutting Edge Per Tooth, 2025 and 2035
  • Figure 56: Latin America Market Y-o-Y Growth Comparison by Cutting Edge Per Tooth, 2025 to 2035
  • Figure 57: Latin America Market Attractiveness Analysis by Cutting Edge Per Tooth
  • Figure 58: Latin America Market Value Share and BPS Analysis by End-User, 2025 and 2035
  • Figure 59: Latin America Market Y-o-Y Growth Comparison by End-User, 2025 to 2035
  • Figure 60: Latin America Market Attractiveness Analysis by End-User
  • Figure 61: Western Europe Market Value Share and BPS Analysis by Country, 2025 and 2035
  • Figure 62: Western Europe Market Value Share and BPS Analysis by Machine Type, 2025 and 2035
  • Figure 63: Western Europe Market Y-o-Y Growth Comparison by Machine Type, 2025 to 2035
  • Figure 64: Western Europe Market Attractiveness Analysis by Machine Type
  • Figure 65: Western Europe Market Value Share and BPS Analysis by Tooth Length, 2025 and 2035
  • Figure 66: Western Europe Market Y-o-Y Growth Comparison by Tooth Length, 2025 to 2035
  • Figure 67: Western Europe Market Attractiveness Analysis by Tooth Length
  • Figure 68: Western Europe Market Value Share and BPS Analysis by Number of Cutting Teeth, 2025 and 2035
  • Figure 69: Western Europe Market Y-o-Y Growth Comparison by Number of Cutting Teeth, 2025 to 2035
  • Figure 70: Western Europe Market Attractiveness Analysis by Number of Cutting Teeth
  • Figure 71: Western Europe Market Value Share and BPS Analysis by Cutting Edge Per Tooth, 2025 and 2035
  • Figure 72: Western Europe Market Y-o-Y Growth Comparison by Cutting Edge Per Tooth, 2025 to 2035
  • Figure 73: Western Europe Market Attractiveness Analysis by Cutting Edge Per Tooth
  • Figure 74: Western Europe Market Value Share and BPS Analysis by End-User, 2025 and 2035
  • Figure 75: Western Europe Market Y-o-Y Growth Comparison by End-User, 2025 to 2035
  • Figure 76: Western Europe Market Attractiveness Analysis by End-User
  • Figure 77: East Asia Market Value Share and BPS Analysis by Country, 2025 and 2035
  • Figure 78: East Asia Market Value Share and BPS Analysis by Machine Type, 2025 and 2035
  • Figure 79: East Asia Market Y-o-Y Growth Comparison by Machine Type, 2025 to 2035
  • Figure 80: East Asia Market Attractiveness Analysis by Machine Type
  • Figure 81: East Asia Market Value Share and BPS Analysis by Tooth Length, 2025 and 2035
  • Figure 82: East Asia Market Y-o-Y Growth Comparison by Tooth Length, 2025 to 2035
  • Figure 83: East Asia Market Attractiveness Analysis by Tooth Length
  • Figure 84: East Asia Market Value Share and BPS Analysis by Number of Cutting Teeth, 2025 and 2035
  • Figure 85: East Asia Market Y-o-Y Growth Comparison by Number of Cutting Teeth, 2025 to 2035
  • Figure 86: East Asia Market Attractiveness Analysis by Number of Cutting Teeth
  • Figure 87: East Asia Market Value Share and BPS Analysis by Cutting Edge Per Tooth, 2025 and 2035
  • Figure 88: East Asia Market Y-o-Y Growth Comparison by Cutting Edge Per Tooth, 2025 to 2035
  • Figure 89: East Asia Market Attractiveness Analysis by Cutting Edge Per Tooth
  • Figure 90: East Asia Market Value Share and BPS Analysis by End-User, 2025 and 2035
  • Figure 91: East Asia Market Y-o-Y Growth Comparison by End-User, 2025 to 2035
  • Figure 92: East Asia Market Attractiveness Analysis by End-User
  • Figure 93: South Asia Pacific Market Value Share and BPS Analysis by Country, 2025 and 2035
  • Figure 94: South Asia Pacific Market Value Share and BPS Analysis by Machine Type, 2025 and 2035
  • Figure 95: South Asia Pacific Market Y-o-Y Growth Comparison by Machine Type, 2025 to 2035
  • Figure 96: South Asia Pacific Market Attractiveness Analysis by Machine Type
  • Figure 97: South Asia Pacific Market Value Share and BPS Analysis by Tooth Length, 2025 and 2035
  • Figure 98: South Asia Pacific Market Y-o-Y Growth Comparison by Tooth Length, 2025 to 2035
  • Figure 99: South Asia Pacific Market Attractiveness Analysis by Tooth Length
  • Figure 100: South Asia Pacific Market Value Share and BPS Analysis by Number of Cutting Teeth, 2025 and 2035
  • Figure 101: South Asia Pacific Market Y-o-Y Growth Comparison by Number of Cutting Teeth, 2025 to 2035
  • Figure 102: South Asia Pacific Market Attractiveness Analysis by Number of Cutting Teeth
  • Figure 103: South Asia Pacific Market Value Share and BPS Analysis by Cutting Edge Per Tooth, 2025 and 2035
  • Figure 104: South Asia Pacific Market Y-o-Y Growth Comparison by Cutting Edge Per Tooth, 2025 to 2035
  • Figure 105: South Asia Pacific Market Attractiveness Analysis by Cutting Edge Per Tooth
  • Figure 106: South Asia Pacific Market Value Share and BPS Analysis by End-User, 2025 and 2035
  • Figure 107: South Asia Pacific Market Y-o-Y Growth Comparison by End-User, 2025 to 2035
  • Figure 108: South Asia Pacific Market Attractiveness Analysis by End-User
  • Figure 109: Eastern Europe Market Value Share and BPS Analysis by Country, 2025 and 2035
  • Figure 110: Eastern Europe Market Value Share and BPS Analysis by Machine Type, 2025 and 2035
  • Figure 111: Eastern Europe Market Y-o-Y Growth Comparison by Machine Type, 2025 to 2035
  • Figure 112: Eastern Europe Market Attractiveness Analysis by Machine Type
  • Figure 113: Eastern Europe Market Value Share and BPS Analysis by Tooth Length, 2025 and 2035
  • Figure 114: Eastern Europe Market Y-o-Y Growth Comparison by Tooth Length, 2025 to 2035
  • Figure 115: Eastern Europe Market Attractiveness Analysis by Tooth Length
  • Figure 116: Eastern Europe Market Value Share and BPS Analysis by Number of Cutting Teeth, 2025 and 2035
  • Figure 117: Eastern Europe Market Y-o-Y Growth Comparison by Number of Cutting Teeth, 2025 to 2035
  • Figure 118: Eastern Europe Market Attractiveness Analysis by Number of Cutting Teeth
  • Figure 119: Eastern Europe Market Value Share and BPS Analysis by Cutting Edge Per Tooth, 2025 and 2035
  • Figure 120: Eastern Europe Market Y-o-Y Growth Comparison by Cutting Edge Per Tooth, 2025 to 2035
  • Figure 121: Eastern Europe Market Attractiveness Analysis by Cutting Edge Per Tooth
  • Figure 122: Eastern Europe Market Value Share and BPS Analysis by End-User, 2025 and 2035
  • Figure 123: Eastern Europe Market Y-o-Y Growth Comparison by End-User, 2025 to 2035
  • Figure 124: Eastern Europe Market Attractiveness Analysis by End-User
  • Figure 125: Middle East & Africa Market Value Share and BPS Analysis by Country, 2025 and 2035
  • Figure 126: Middle East & Africa Market Value Share and BPS Analysis by Machine Type, 2025 and 2035
  • Figure 127: Middle East & Africa Market Y-o-Y Growth Comparison by Machine Type, 2025 to 2035
  • Figure 128: Middle East & Africa Market Attractiveness Analysis by Machine Type
  • Figure 129: Middle East & Africa Market Value Share and BPS Analysis by Tooth Length, 2025 and 2035
  • Figure 130: Middle East & Africa Market Y-o-Y Growth Comparison by Tooth Length, 2025 to 2035
  • Figure 131: Middle East & Africa Market Attractiveness Analysis by Tooth Length
  • Figure 132: Middle East & Africa Market Value Share and BPS Analysis by Number of Cutting Teeth, 2025 and 2035
  • Figure 133: Middle East & Africa Market Y-o-Y Growth Comparison by Number of Cutting Teeth, 2025 to 2035
  • Figure 134: Middle East & Africa Market Attractiveness Analysis by Number of Cutting Teeth
  • Figure 135: Middle East & Africa Market Value Share and BPS Analysis by Cutting Edge per Tooth, 2025 and 2035
  • Figure 136: Middle East & Africa Market Y-o-Y Growth Comparison by Cutting Edge per Tooth, 2025 to 2035
  • Figure 137: Middle East & Africa Market Attractiveness Analysis by Cutting Edge Per Tooth
  • Figure 138: Middle East & Africa Market Value Share and BPS Analysis by End-User, 2025 and 2035
  • Figure 139: Middle East & Africa Market Y-o-Y Growth Comparison by End-User, 2025 to 2035
  • Figure 140: Middle East & Africa Market Attractiveness Analysis by End-User
  • Figure 141: Global Market - Tier Structure Analysis
  • Figure 142: Global Market - Company Share Analysis

- FAQs -

What is the Global Stump Grinder Market Size in 2025?

The stump grinder market is valued at USD 523.2 million in 2025.

Who are the Major Players Operating in the Stump Grinder Market?

Prominent players in the market include Caterpillar Inc., Morbark, LLC, MTB Mfg Inc., Vermeer Corporation, Tracmaster Ltd., Predator Power Ltd., and Wacker Neuson SE.

What is the Estimated Valuation of the Stump Grinder Market by 2035?

The market is expected to reach a valuation of USD 812.5 million by 2035.

What Value CAGR Did the Stump Grinder Market Exhibit Over the Last Five Years?

The growth rate of the stump grinder market is 4.1% from 2020-2024.

Stump Grinder Market

Schedule a Call