- Market Value (2025): USD 1.07 Bn
- Estimated Value (2026): USD 1.13 Bn
- Forecast Value (2036): USD 1.91 Bn
- CAGR (2026-2036): 5.4%
What is the Automatic Balancing System Market forecast to be worth by 2036?
USD 1.1 billion in 2026 to USD 1.9 billion by 2036 at a 5.4% CAGR.
- The automatic balancing system market was valued at USD 1.07 billion in 2025, with vehicle component plants placing the bulk of machine orders.
- Spending on these systems will grow from USD 1.13 billion in 2026 to USD 1.91 billion by 2036 as electric drive and aerospace rotor output widens.
- A 5.4% CAGR will hold from 2026 to 2036, since each new rotor design brings fresh tooling, fixtures and correction programs.
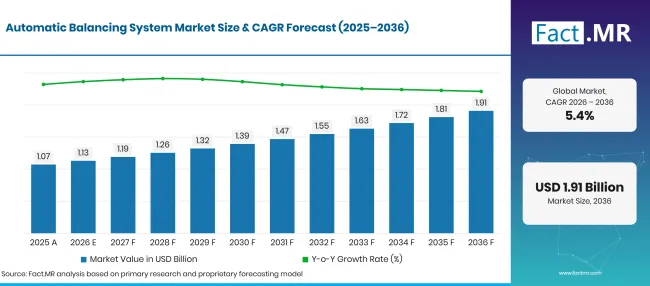
Automatic Balancing System Market Forecast Global | Source: Fact.MR
automatic-balancing
| Year | Basis | Market Value (USD billion) |
|---|---|---|
| 2025 | Actual | 1.07 |
| 2026 | Estimate | 1.13 |
| 2036 | Forecast | 1.91 |
| CAGR 2026 to 2036 | Forecast period | 5.4% |
Source: Fact.MR analysis. Updated Oct 22, 2026
-system-market
What are the defining numbers behind Automatic Balancing System Market growth?
The 2026 to 2036 period adds USD 0.8 billion in new value, led by automotive and industrial machinery lines.
- Demand Drivers in the Market
- Balancing accuracy now carries a formal measurement benchmark. In September 2026, ISO published ISO 21940-14:2026, which sets procedures for identifying and assessing errors in the unbalance measuring process and for accounting for them when evaluating residual unbalance [1]. Buyers use such rules to audit machine capability, which favors systems with traceable sensor and software data.
- Electric drive output is adding a new class of rotors to balance. The International Energy Agency reported that electric car sales grew by 20% to more than 20 million in 2025, about one-quarter of new cars sold worldwide [2]. Every e-motor rotor needs balancing at high speed, and plants prefer inline machines that correct the part in one clamping.
- Labor shortages on machining lines push plants toward machines that measure, correct and recheck without an operator. Robotic loading and automatic drilling cut cycle time and keep results consistent across shifts.
- Turbochargers, fans and spindles spin faster with each design generation. Higher speeds shrink the allowed residual unbalance, so older manual balancers struggle to meet drawing limits.
- Quality teams want a record of each part. Systems that log unbalance before and after correction give auditors a part-level history and help maintenance staff spot drift in tooling.
- Key Segments Analyzed
- By Component: Sensors will account for 32.5% share in 2026, as every correction cycle starts with a vibration or displacement reading taken at speed.
- By Application: Automotive will capture 35.6% share in 2026 on the strength of series output of crankshafts, turbochargers, brake discs and electric drive rotors.
- By Deployment Mode: On-Premises will command 68.2% share in 2026, given that balancing controllers must respond in real time to the spindle and the correction unit on the shop floor.
- Analyst Opinion at Fact.MR
- Shambhu Nath Jha, Principal Consultant at Fact.MR, states, “Plants rarely buy a balancing machine on its own today. They buy a cell that measures, corrects and documents each rotor, and the sensor is the part that sets its accuracy. Suppliers who can retool a cell quickly for new e-motor and turbocharger designs will win repeat orders from the same customers.”
- Strategic Implications
- Machine builders should offer modular cells with swappable fixtures and correction heads, so a line can move from one rotor family to the next without a new frame.
- Sensor and controller suppliers should publish measurement uncertainty data in line with the new ISO error assessment procedures, since buyers will ask for it during acceptance.
- Automotive and e-motor plants should specify balancing data export at the tender stage to link part results with their plant quality systems.
- Service providers should build calibration and retrofit programs for the installed base, where older manual machines can gain automatic correction and new measuring software.
Brazil heads the country set at 6.8%, where vehicle and parts plants keep adding output. The United States follows at 6.4%, backed by a large durable goods base and steady capital equipment orders. In the United Kingdom, growth of 5.7% rests on aerospace engines and specialist automotive work. Japan reaches 5.3% through high-precision motor and machine tool production. Germany trails at 4.0%, with a mature, already automated installed base and weaker car output.
How does the Automatic Balancing System Market break down by segment?
Sensors will lead Component at 32.5%; Automotive will top Application at 35.6%; On-Premises will head Deployment Mode at 68.2%.
Which Component leads?
Sensors make up 32.5% of 2026 sales.
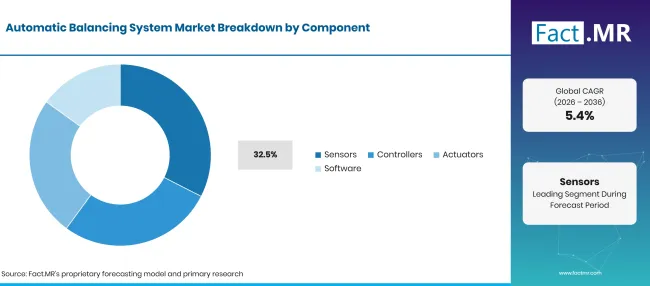
Automatic Balancing System Market Breakdown Component | Source: Fact.MR
| Component | Share (2026) |
|---|---|
| Sensors (Leading segment) | 32.5% |
| Other segments combined | 67.5%* |
| Total | 100.0% |
Source: Fact.MR analysis. Updated Oct 22, 2026
A balancing cell cannot correct what it cannot measure, so buyers judge a machine first by its pickups. Piezoelectric and velocity sensors on the bearing supports record vibration, while a reference sensor marks the angle of the heavy spot. Many plants already run machine condition monitoring tools built on similar sensors. Controllers convert the signals into a correction plan and steer the spindle. Actuators drive the drill, mill or weight placer. Software stores rotor recipes and tolerance limits, and it now carries the error assessment steps set out in ISO 21940-14:2026 [1].
What supports Automotive within Application?
Automotive takes 35.6% of 2026 sales.
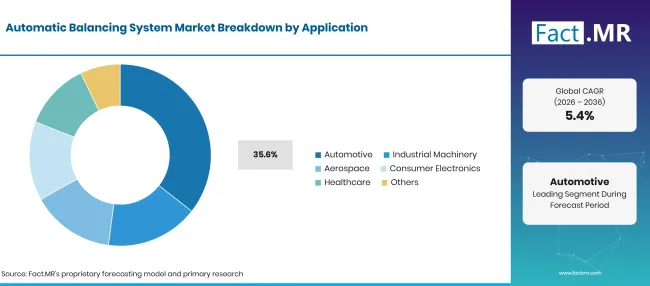
Automatic Balancing System Market Breakdown Application | Source: Fact.MR
| Application | Share (2026) |
|---|---|
| Automotive (Leading segment) | 35.6% |
| Other segments combined | 64.4%* |
| Total | 100.0% |
Source: Fact.MR analysis. Updated Oct 22, 2026
Vehicle plants balance thousands of identical parts per day, which makes full automation pay back quickly. Lines for the automotive crankshaft and for brake discs and rotors use inline machines with automatic drilling. Turbocharger and drive shaft lines follow the same pattern. Electric drives add new work. Rotors for the permanent magnet motor used in traction drives spin far above engine speeds and need correction in two planes. Industrial machinery comes next, followed by aerospace, consumer electronics and healthcare uses such as imaging gantries and centrifuges.
What leads the Deployment Mode segment?
On-Premises represents 68.2% of 2026 sales.
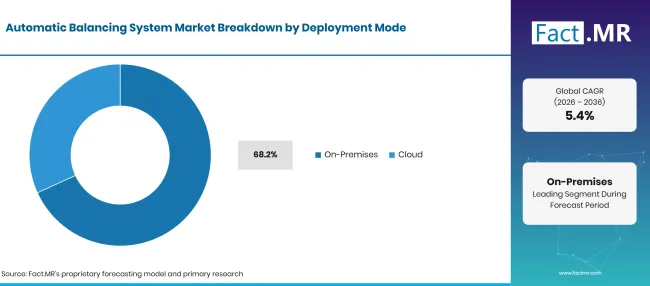
Automatic Balancing System Market Breakdown Deployment Mode | Source: Fact.MR
| Deployment Mode | Share (2026) |
|---|---|
| On-Premises (Leading segment) | 68.2% |
| Other segments combined | 31.8%* |
| Total | 100.0% |
Source: Fact.MR analysis. Updated Oct 22, 2026
Shop floor control keeps the correction loop fast and safe. Plants want measuring data, spindle drives and correction tools linked on a local network that runs even when the internet link drops. Defense and aerospace suppliers also keep part data inside their own walls for export control reasons. Cloud deployment is growing from a small base. Suppliers use it for remote diagnostics, software updates and fleet-wide reports on machine health. Cloud tools also suit firms that run balancing cells at several sites and want one view of scrap and rework.
What is accelerating Automatic Balancing System Market adoption, and what is holding it back?
Electric drive output, tighter tolerances and part-level traceability keep orders coming from vehicle and machinery plants. Purchases slow where high upfront cost, long integration work and a shortage of trained setters weigh on smaller manufacturers.
Drivers Impact Analysis
| DRIVER | (~) % IMPACT ON CAGR | GEOGRAPHIC RELEVANCE | IMPACT TIMELINE |
|---|---|---|---|
| Automated balancing cells on high-volume automotive component lines | +1.3% | Global | Medium term (2-4 years) |
| Electric drive rotors that need two-plane correction at high speed | +1.0% | East Asia, Western Europe, North America | Medium term (2-4 years) |
| Tighter residual unbalance limits for turbochargers, fans and spindles | +0.6% | Global | Long term (>= 4 years) |
| Part-level quality records and traceability demands | +0.4% | North America, Western Europe | Short term (<= 2 years) |
Source: Fact.MR analysis. Updated Oct 22, 2026
Opportunity Impact Analysis
| OPPORTUNITY | (~) % IMPACT ON CAGR | GEOGRAPHIC RELEVANCE | IMPACT TIMELINE |
|---|---|---|---|
| Retrofit of manual balancers with automatic correction and new software | +0.6% | Global | Medium term (2-4 years) |
| Robotic loading and unloading integrated with balancing cells | +0.4% | Global | Medium term (2-4 years) |
| Remote diagnostics and cloud reporting for multi-site fleets | +0.3% | North America, Western Europe | Long term (>= 4 years) |
| Balancing systems for drone, aerospace and medical rotors | +0.2% | North America, Western Europe | Long term (>= 4 years) |
Source: Fact.MR analysis. Updated Oct 22, 2026
Restraints Impact Analysis
| RESTRAINT | (~) % IMPACT ON CAGR | GEOGRAPHIC RELEVANCE | IMPACT TIMELINE |
|---|---|---|---|
| High upfront cost of automatic balancing cells | -0.4% | Global | Short term (<= 2 years) |
| Integration cost and downtime on existing production lines | -0.2% | Global | Medium term (2-4 years) |
| Calibration, maintenance and operator training needs | -0.1% | Global | Medium term (2-4 years) |
Source: Fact.MR analysis. Updated Oct 22, 2026
Which countries are scaling the Automatic Balancing System Market through 2036?
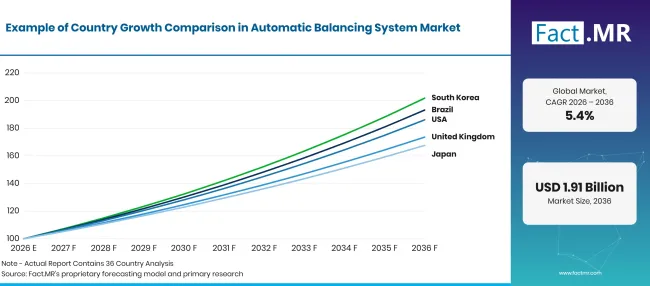
Automatic Balancing System Market Growth Index | Source: Fact.MR
| Country | CAGR (2026 to 2036) |
|---|---|
| Brazil | 6.8% |
| United States | 6.4% |
| United Kingdom | 5.7% |
| Japan | 5.3% |
| Germany | 4.0% |
Source: Fact.MR analysis. Updated Oct 22, 2026
What supports Brazil’s adoption?
6.8% CAGR, driven by vehicle and parts plants that keep raising output.
Brazilian factories posted steady gains through early 2026. IBGE reported that industrial output rose 0.7% in April 2026 from March and 2.7% from April 2025 [3]. Production of motor vehicles, trailers and bodies was up 2.0% for January to April [3]. New engine and component lines in the state of São Paulo and the South are the main buyers of automatic balancing cells.
How is the United States scaling demand?
6.4% CAGR, backed by a broad durable goods base and aerospace engine work.
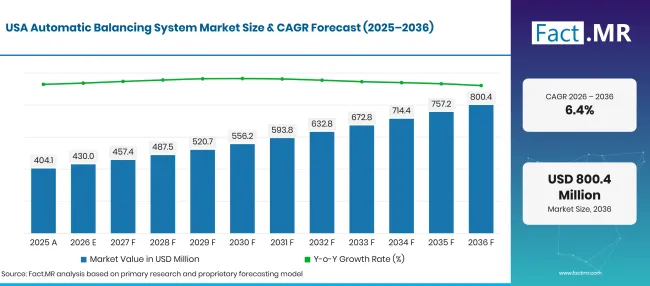
Automatic Balancing System Market Forecast Usa | Source: Fact.MR
American plants balance rotors for cars, jet engines, pumps and HVAC fans. The Federal Reserve reported that manufacturing output rose 0.3% in September 2026 and factory capacity utilization reached 75.9% [4]. The Census Bureau put August 2026 new orders for durable goods at USD 338.6 billion [5]. Turbocharger, driveline and electric motor lines in the Midwest and South order most new machines.
What is supporting the United Kingdom’s adoption?
5.7% CAGR, helped by aerospace engines and specialist automotive production.
British manufacturers balance turbine discs, fan assemblies and high-performance engine parts in smaller batches. The Office for National Statistics reported that manufacturing output grew 1.2% in August 2026, with nine of 13 subsectors rising [6]. Aerospace suppliers favor flexible cells that switch between part numbers. Motorsport and luxury vehicle makers add orders for high-speed machines.
How is Japan developing demand?
5.3% CAGR, on the back of precision motor and machine tool output.
Japanese plants produce small motors, spindles and hard disk parts that need fine correction. The Ministry of Economy, Trade and Industry put the August 2026 industrial production index at 101.9 (2020 = 100), down 2.4% from July [7]. That soft month points to demand that rests on retooling, not on volume growth. Domestic machine builders supply many lines, and exporters of motors and compressors keep retooling for electric vehicles.
How does Germany perform?
4.0% CAGR, reflecting a mature installed base and softer car production.
Germany has long used automatic balancing on its car and machine lines, so new demand comes mostly from replacement and e-drive retooling. Destatis reported that production in the automotive industry fell 9.2% in July 2026 from June [8], which explains the slower pace. The economy ministry noted that mechanical engineering output rose 5.3% in August 2026 [9]. Machinery makers remain steady buyers of flexible balancing cells.
Who leads the Automatic Balancing System Market?
Three groups compete for orders. Full-line German and Italian builders such as Schenck RoTec, CEMB and Hofmann Mess- und Auswuchttechnik sell automatic machines for crankshafts, turbochargers, armatures and e-drives, and they win large automotive programs on accuracy and service reach.
Hofmann released Pulsar in July 2026, a new measuring software for static and dynamic rotor balancing [10]. Specialists compete on niche know-how. Balance Systems pairs balancing machines with grinding process control, and in October 2025 it began building a modular balancing machine for electric motor parts under the InnoMec+ project [11]. In April 2026, it presented its balancing and data traceability offer to drone makers [12]. Hines Automation in the United States sells machines with robotic transfer and automatic correction. ABRO Balancing and Erbessd Instruments serve repair shops, power plants and general industry with universal machines and vibration tools. Fast changeovers, sensor accuracy and service near the customer’s plant will separate winners from the rest.
Bibliography
- [1] International Organization for Standardization. (2026, September). ISO 21940-14:2026: Mechanical vibration, Rotor balancing, Part 14: Procedures for assessing balance errors.
- [2] International Energy Agency. (2026). Global EV Outlook 2026: Executive summary.
- [3] Instituto Brasileiro de Geografia e Estatística. (2026, June 3). Produção industrial brasileira variou 0,7% em abril [Brazilian industrial production changed 0.7% in April].
- [4] Board of Governors of the Federal Reserve System. (2026, October 16). Industrial Production and Capacity Utilization: G.17.
- [5] U.S. Census Bureau. (2026, September 25). Advance Report on Durable Goods Manufacturers’ Shipments, Inventories and Orders: August 2026.
- [6] Office for National Statistics. (2026, October 15). Index of Production, UK: August 2026.
- [7] Ministry of Economy, Trade and Industry, Japan. (2026, October 15). Indices of Industrial Production: Revised Report for August 2026.
- [8] Statistisches Bundesamt (Destatis). (2026, September 7). Produktion im Juli 2026: -1,1 % zum Vormonat [Production in July 2026: -1.1% on the previous month].
- [9] Federal Ministry for Economic Affairs and Energy, Germany. (2026, October 7). Entwicklung der Produktion im Produzierenden Gewerbe Berichtsmonat August 2026 [Production in industry, reporting month August 2026].
- [10] Hofmann Mess- und Auswuchttechnik. (2026, July 31). NEU: Pulsar: Die nächste Generation unserer Mess-Software für Auswuchtmaschinen [New: Pulsar, the next generation of our measuring software for balancing machines].
- [11] Balance Systems S.r.l. (2025, October 1). Balance Systems takes center stage at InnoMec+: innovation and sustainability for the mechanics of the future.
- [12] Balance Systems S.r.l. (2026, April 20). Balance Systems and UAV Evolution: Dynamic Precision for Future Mobility.
How is the market segmented?
-
By Component
- Sensors
- Controllers
- Actuators
- Software
-
By Application
- Automotive
- Industrial Machinery
- Aerospace
- Consumer Electronics
- Healthcare
-
By Deployment Mode
- On-Premises
- Cloud
-
By Region
- North America
- Latin America
- Western Europe
- Eastern Europe
- East Asia
- South Asia & Pacific
- Middle East & Africa
This Report Answers
- Revenue for automatic balancing systems is split by component, application and deployment mode for 2026 to 2036.
- Readers learn why sensors, automotive lines and on-premises control hold first place in their segments.
- Growth in Brazil, the United States, the United Kingdom, Japan and Germany is set against each country’s industrial output.
- Machine builders and specialists are profiled by the rotor types and correction methods they serve.
- Electric drives, tighter tolerances and traceability rules are weighed against cost and integration hurdles.
What does the Automatic Balancing System Market cover?
Machines and cells that measure unbalance and then correct it automatically fall inside this market. Correction can mean drilling, milling, welding, or adding and placing balance weights.
Value is counted for complete systems, including the sensors, controllers, actuators and software built into them. Parts balanced include crankshafts, turbochargers, armatures, electric drive rotors, fans, spindles and turbine components.
What is included in the scope?
Inline balancing cells with robotic loading, semi-automatic machines with automatic correction, and active balancing heads fitted to grinders are in scope. Balancing heads on grinding machines count when they correct wheel unbalance during the process.
Rotors for the automotive turbocharger and for jet engines are covered when balanced on automatic equipment. Measuring software and cloud reporting tools sold with these systems are included.
What is excluded from the scope?
Manual balancing machines without automatic correction are excluded. Portable field balancers and stand-alone vibration analyzers used for plant maintenance also fall outside this market.
Garage wheel balancers used in tire shops are left out, as are contract balancing services. General industrial sensors and actuators count only when sold as part of a balancing system.
How Was the Analysis Built?
The analysis draws on 120+ sources, 35+ company portfolios, 25+ countries, and more than 20 industry interviews.
- Primary Research: Primary research includes discussions with manufacturers, service providers, technology developers, distributors, end users, and subject-matter experts. These conversations examine purchasing priorities, product adoption, operational challenges, approval requirements, competitive positioning, and the factors that influence wider market acceptance.
- Desk Research: Desk research covers government statistics, regulatory publications, company filings, trade data, technical studies, industry associations, standards, public policy, and other authoritative sources. Every source used in the analysis is documented in the bibliography.
- Market Sizing and Forecasting: Market estimates combine historical performance, demand indicators, pricing and volume trends, segment shares, company participation, country-level growth, adoption patterns, investment activity, and barriers to market expansion.
- Data Validation and Update Cycle: Findings are validated by comparing primary interviews with public data, company activity, regulatory changes, trade patterns, and industry developments. Regular updates review new product launches, capacity changes, partnerships, approvals, and shifts in commercial adoption.
Segmentation
What is the report’s scope and coverage?
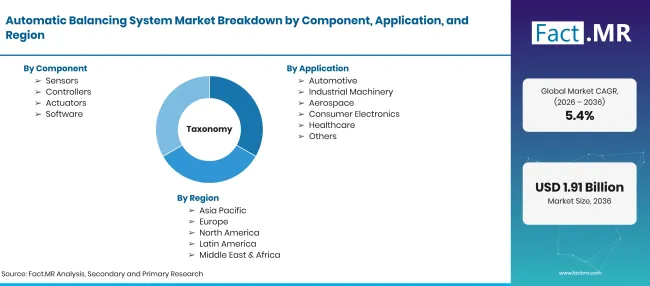
Automatic Balancing System Market Taxonomy | Source: Fact.MR
| Attribute | Details |
|---|---|
| Quantitative Units | USD billion in 2026 to USD billion by 2036 at CAGR |
| Market Definition | Automatic balancing systems that measure unbalance in rotating parts and correct it with little or no operator input. The scope covers sensors, controllers, actuators and software sold as part of these systems. |
| Component | Sensors; Controllers; Actuators; Software |
| Application | Automotive; Industrial Machinery; Aerospace; Consumer Electronics; Healthcare |
| Deployment Mode | On-Premises; Cloud |
| Regions Covered | North America; Latin America; Western Europe; Eastern Europe; East Asia; South Asia & Pacific; Middle East & Africa |
| Countries Covered | Brazil; United States; United Kingdom; Japan; Germany |
| Companies Profiled | Schenck RoTec GmbH; CEMB S.p.A.; Hofmann Mess- und Auswuchttechnik GmbH & Co. KG; Balance Systems S.r.l.; Hines Automation; ABRO Balancing; Erbessd Instruments |
| Forecast Period | 2026 to 2036 |
| Approach | Hybrid top-down and bottom-up approach using rotor production volumes by application; installed base and replacement cycles of balancing machines; component and deployment split; country industrial output; and supplier portfolio review. |
Source: Fact.MR analysis. Updated Oct 22, 2026
Which companies are the key providers?
Key companies include Schenck RoTec GmbH; CEMB S.p.A.; Hofmann Mess- und Auswuchttechnik GmbH & Co. KG; Balance Systems S.r.l.; Hines Automation; ABRO Balancing; and Erbessd Instruments.
- Schenck RoTec GmbH
- CEMB S.p.A.
- Hofmann Mess- und Auswuchttechnik GmbH & Co. KG
- Balance Systems S.r.l.
- Hines Automation
- ABRO Balancing
- Erbessd Instruments
Frequently Asked Questions
How big is the automatic balancing system market in 2026?
What is the CAGR of the automatic balancing system market from 2026 to 2036?
Which component leads the automatic balancing system market?
Which application leads the automatic balancing system market?
Which deployment mode leads the automatic balancing system market?
Which country will grow the most in the automatic balancing system market?
Who are the main companies in the automatic balancing system market?
Who worked on this report


Preview the report firsthand - request a free sample
Free SampleGet the brochure for pricing and purchase details
Download PDF