- Market Value (2025): USD 9.9 Bn
- Estimated Value (2026): USD 10.3 Bn
- Forecast Value (2036): USD 16.0 Bn
- CAGR (2026-2036): 4.5%
What is the Automotive Parts Packaging Market forecast to be worth by 2036?
USD 10.3 billion in 2026 to USD 16.0 billion by 2036, at 4.5% CAGR.
- The automotive parts packaging market crossed a valuation of USD 9.9 billion in 2025 as vehicle production and component logistics activity supported packaging turnover.
- Demand is projected to increase from USD 10.3 billion in 2026 to USD 16.0 billion by 2036 across vehicle manufacturing and aftermarket flows.
- The market is forecast to record a 4.5% CAGR from 2026 to 2036 as OEM and aftermarket packaging requirements expand across component logistics networks.
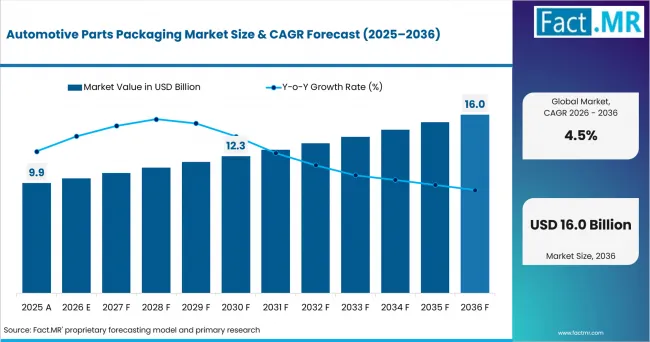
Automotive Parts Packaging Market Market Value Analysis | Source: Fact.MR
What are the defining numbers behind Automotive Parts Packaging Market growth?
USD 5.7 billion absolute opportunity by 2036, led by OEM purchasing and Corrugated Board while Trays and Engine Components lead their respective categories.
- Demand Drivers in the Market
- OEM logistics teams need standardized returnable containers supported by stable loop volumes across assembly plants and nearby component consolidation centers.
- Tier suppliers need custom dunnage shaped by part geometry so painted surfaces and machined assemblies remain protected during repeated handling.
- Battery-system manufacturers need cleanable racks and inserts owing to tight dimensional tolerances across modules and high-value electrical components.
- Aftersales parts operations need mixed-SKU packaging supported by clear identification and quick pack-out across dealer replenishment networks.
- Key Segments Analyzed
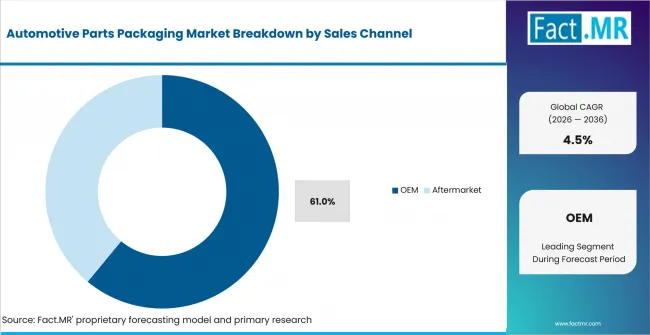
- By Sales Channel: OEM is estimated to represent 61.0% share in 2026, attributable to program-specific specifications and controlled packaging loops.
- By Material: Corrugated Board is estimated to account for 38.0% share in 2026, supported by broad availability and adaptable protection across component flows.
- By Product Type: Trays are projected to account for 29.0% share in 2026, owing to repeatable part positioning across plant and supplier handling steps.
- By Application: Engine Components are anticipated to capture 24.0% share in 2026, shaped by strict restraint needs for heavy and machined parts.
- Analyst Opinion at Fact.MR
- Shambhu Nath Jha, Senior Analyst at Fact.MR, states, “Automotive parts packaging becomes difficult when return loops are uncertain and dunnage changes before a vehicle program stabilizes. Adoption is expected to favor providers that prove loop economics and part protection under real handling conditions. Suppliers should combine packaging engineering and local repair capacity with container-fleet visibility that keeps shortages away from assembly schedules.”
- Strategic Implications
- OEM logistics teams should model round-trip distance and container dwell time before replacing expendable packs across interplant component lanes.
- Tier suppliers should validate dunnage against real part tolerances and handling motions before committing tooling across an entire vehicle program.
- Packaging providers should place repair capacity near automotive clusters so damaged returnables re-enter circulation before fleet shortages affect production schedules.
- Aftersales operations should separate fast-moving service parts from irregular emergency orders when choosing reusable assets or expendable protective formats.
Packaging providers continued to expand local capacity close to industrial customers and automotive supply corridors. Nefab began operations at a new plant in Rio Grande do Sul during October 2025. The expansion increased regional access to packaging production and service support for customers with repeat shipment needs.
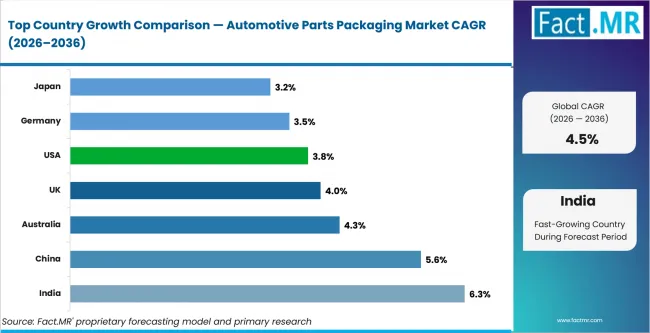
India is expected to record a 6.3% CAGR between 2026 and 2036, supported by vehicle output expansion and growing component-manufacturing corridors. China is projected to post a 5.6% CAGR over the forecast period, owing to EV production scale and dense regional supplier networks. Australia is anticipated to advance at a 4.3% CAGR during the forecast period, shaped by replacement-parts flows across a dispersed vehicle fleet. The United Kingdom is estimated to record a 4.0% CAGR across the forecast window, attributable to zero-emission vehicle turnover and structured aftermarket distribution. The United States is forecast to post a 3.8% CAGR from 2026 to 2036, driven by deep vehicle-service networks and recall-sensitive parts movement. Germany is projected to register a 3.5% CAGR during the forecast period, supported by export-oriented production and established supplier clusters. Japan is estimated to advance at a 3.2% CAGR between 2026 and 2036, shaped by established manufacturing programs and exacting component-handling requirements.
How does the Automotive Parts Packaging Market break down by segment?
Corrugated Board accounts for 38.0%; Trays to record 29.0% share.
Which Material is estimated to account for the largest share?
Corrugated Board accounts for 38.0% share in 2026.
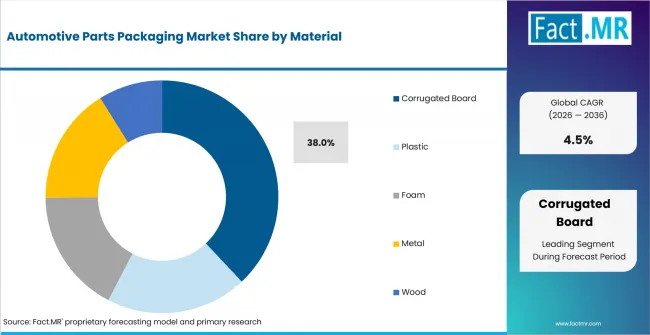
Automotive Parts Packaging Market Analysis By Material | Source: Fact.MR
Corrugated Board is estimated to account for 38.0% share in 2026, supported by adaptable strength and broad converter availability across automotive supply corridors. Plastic formats serve reusable loops that require cleaning and repeated handling. Foam provides cushioning for sensitive parts while Metal and Wood support heavy components or oversized assemblies. Material selection remains tied to route frequency and damage sensitivity across each component program.
Which Product Type is projected to garner the largest share?
Trays garner 29.0% share in 2026.
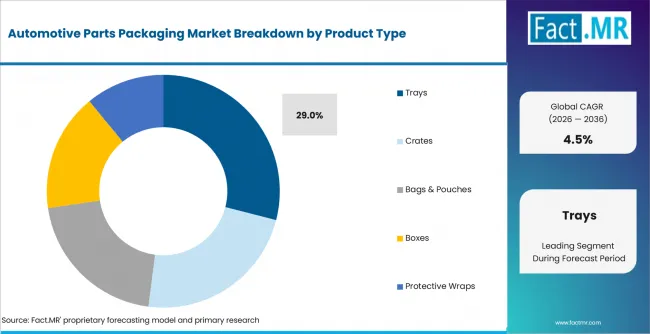
Automotive Parts Packaging Market Analysis By Product Type | Source: Fact.MR
Trays are projected to account for 29.0% share in 2026, owing to repeatable part positioning across line-side handling and interplant movement. Crates support larger assemblies that need reinforced external protection. Bags & Pouches serve smaller parts while Boxes handle broad shipment profiles across distribution networks. Protective Wraps provide surface protection where abrasion risk is more important than rigid containment.
Which Application is estimated to account for the largest share?
Engine Components record 24.0% share in 2026.
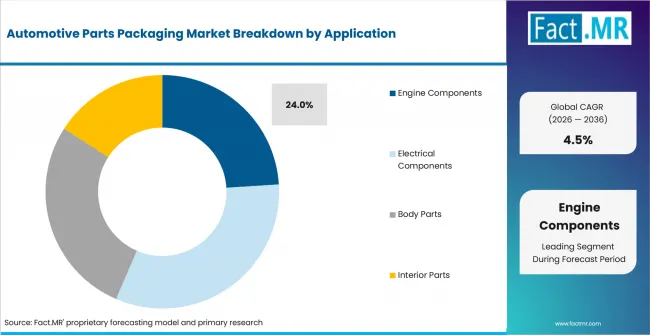
Automotive Parts Packaging Market Analysis By Application | Source: Fact.MR
Engine Components are anticipated to capture 24.0% share in 2026, shaped by weight and damage-control requirements across machined parts. Electrical Components need cushioning or static-sensitive protection for modules and connectors. Body Parts require surface protection across panels and exterior assemblies. Interior Parts need clean pack presentation that limits scratches or contamination during delivery to assembly operations.
What supports OEM purchasing within Sales Channel?
OEM purchasing is forecast to account for 61.0% share in 2026.
Automotive Parts Packaging Market Analysis By Sales Channel | Source: Fact.MR
OEM purchasing is estimated to represent 61.0% share in 2026, attributable to program-specific specifications and controlled packaging loops between plants and Tier suppliers. Aftermarket channels handle mixed order sizes and wider destination networks that favor flexible protective formats. International Paper / DS Smith announced a GBP 108 million JLR packaging contract in March 2025 under a fully integrated service model. The agreement illustrates how large OEM programs can support dedicated packaging design and service capacity.
What is accelerating Automotive Parts Packaging Market adoption, and what is holding it back?
Closed-loop return economics drive adoption; empty-return imbalance restrains it.
Drivers Impact Analysis
| DRIVER | (~) % IMPACT ON CAGR | GEOGRAPHIC RELEVANCE | IMPACT TIMELINE |
|---|---|---|---|
| Closed-loop standardization across OEM lanes | +0.7% | Global automotive clusters | Long term (>= 4 years) |
| EV component protection requirements | +0.6% | China and Europe alongside India | Medium term (2-4 years) |
| Transport-packaging reuse requirements | +0.5% | European Union and United Kingdom | Medium term (2-4 years) |
| Recall-sensitive handling and traceability | +0.4% | United States and Europe | Medium term (2-4 years) |
| Regionalized component production corridors | +0.3% | India and China alongside Mexico | Long term (>= 4 years) |
Source: Fact.MR analysis. Updated Jul 9, 2026
- Closed-loop standardization: OEM programs reuse container fleets across predictable lanes where repeated turns spread tooling and repair costs over several vehicle-program years. Standard footprints also reduce repacking between warehouses and line-side areas while helping automation equipment handle known load units. Adoption is expected to deepen where plants share packaging standards across nearby supplier clusters and common consolidation points.
- EV component protection: Battery modules and power electronics need controlled support points because small handling errors create expensive scrap or rework during production. Packaging engineers increasingly use custom inserts and reinforced racks for these component families across repeated interplant movements. Demand is projected to favor providers that test packaging against actual lifting and line-side handling steps.
- Transport-packaging reuse rules: European packaging rules place reuse performance directly inside transport-packaging planning for cross-border manufacturing networks and shared logistics pools. EUR-Lex reported in September 2025 that 40% of transport packaging must be reusable by 2030. Qualification activity is anticipated to increase as automotive companies map which loops support reuse without excessive empty-return movement.
- Recall-sensitive handling: Recall exposure increases the value of packaging that preserves identification and prevents part mix-ups before components reach assembly or service channels. NHTSA reported 150,364 electric vehicles affected by EV-specific component recalls during 2025 across the United States. Packaging documentation is estimated to gain attention where corrective actions require accurate separation and controlled redistribution of replacement parts.
- Regionalized production: Regional sourcing places more component value inside dense manufacturing corridors where short transport loops improve returnable-packaging economics. Packaging providers can place design and repair capacity close to supplier parks that support frequent container turns. Demand is forecast to deepen where local sourcing creates dependable return routes between parts plants and assembly facilities.
Opportunity Impact Analysis
| OPPORTUNITY | (~) % IMPACT ON CAGR | GEOGRAPHIC RELEVANCE | IMPACT TIMELINE |
|---|---|---|---|
| Returnable packs for batteries and power electronics | +0.4% | China and Europe alongside United States | Medium term (2-4 years) |
| Asset tracking for reusable transport items | +0.3% | North America and Europe | Medium term (2-4 years) |
| Recycled-plastic transport packaging fleets | +0.3% | Europe and North America | Medium term (2-4 years) |
| Mixed-SKU aftermarket packaging services | +0.2% | United States and India alongside Australia | Long term (>= 4 years) |
Source: Fact.MR analysis. Updated Jul 9, 2026
- Battery and electronics packs: Electrified vehicles create specialized packaging work around battery modules and power electronics that need precise support or contamination control. The United Kingdom registered 528,000 zero-emission vehicles for the first time across national licensing records during 2025. Opportunity is expected to expand for providers that combine reusable hardware with documented cleaning and inspection routines.
- Reusable asset tracking: Reusable fleets lose value when containers sit outside planned loops or disappear into uncontrolled storage areas between component movements. Identification hardware and software records help logistics teams locate assets before shortages trigger emergency expendable-pack purchases. Service revenue is projected to expand where tracking data is tied to fleet balancing and repair decisions.
- Recycled-plastic fleets: Large returnable fleets create a long-term material-recovery question when damaged containers reach the end of their service life. EPA estimates that USD 36.5 to 43.4 billion is needed for United States recycling infrastructure by 2030. Packaging providers are anticipated to differentiate through repair pathways and material recovery arrangements that support fleet replacement planning.
- Aftermarket mixed-SKU services: Aftermarket networks handle older vehicles and irregular part combinations that need flexible internal protection without excessive packaging variety. BITRE reported an average motor-vehicle age of 11.54 years across Australia’s national registered fleet during 2025. Opportunity is estimated to favor modular inserts and pack-out services that serve several part numbers within common outer containers.
Restraints Impact Analysis
| RESTRAINT | (~) % IMPACT ON CAGR | GEOGRAPHIC RELEVANCE | IMPACT TIMELINE |
|---|---|---|---|
| High upfront cost for returnable fleets | -0.4% | Global mid-volume component lanes | Short term (<= 2 years) |
| Empty-return imbalance across supply corridors | -0.3% | Cross-border automotive networks | Medium term (2-4 years) |
| Frequent dunnage redesign during model transitions | -0.3% | EV transition manufacturing hubs | Medium term (2-4 years) |
| Packaging standard fragmentation across tiers | -0.2% | Multi-tier supplier networks | Long term (>= 4 years) |
Source: Fact.MR analysis. Updated Jul 9, 2026
- Upfront fleet cost: Returnable systems require capital for containers and dunnage before enough transport cycles prove the expected cost per trip. Low-frequency lanes often struggle to recover tooling and management costs within a vehicle program before specifications change again. Adoption is forecast to remain selective where shipment density is unstable or contract duration is uncertain.
- Empty-return imbalance: A returnable container creates little value when reverse routes carry air and transport costs exceed savings from avoided expendable materials. Imbalanced supplier corridors also create local shortages even when total container ownership appears sufficient across the broader network. Operators are expected to favor collapsible formats and pooled fleets where backhaul conditions remain difficult.
- Dunnage redesign pressure: Powertrain transitions change part geometry and handling requirements before packaging tooling reaches the end of its expected service life. China ended 2025 with 43.97 million new-energy vehicles in operation across its national vehicle fleet. Packaging reuse is projected to face redesign pressure where battery formats or electronics layouts change across model programs.
- System fragmentation: Different OEM standards force Tier suppliers to hold separate containers and pack specifications for similar parts moving through different customer networks. Extra variants increase training needs and reduce the chance of balancing containers across programs within the same supplier network. Adoption is anticipated to improve slowly where multi-tier networks lack shared dimensional or identification standards.
Which countries are scaling Automotive Parts Packaging Market fastest?
India 6.3%; China 5.6%; Australia 4.3%; United Kingdom 4.0%; United States 3.8%; Germany 3.5%; Japan 3.2%.
Automotive Parts Packaging Market coverage spans North America and Europe alongside Asia Pacific with Latin America and the Middle East & Africa completing the regional framework.
| COUNTRY | CAGR |
|---|---|
| India | 6.3% |
| China | 5.6% |
| Australia | 4.3% |
| United Kingdom | 4.0% |
| United States | 3.8% |
| Germany | 3.5% |
| Japan | 3.2% |
Source: Fact.MR analysis. Updated Jul 9, 2026
Automotive Parts Packaging Market Cagr Analysis By Country | Source: Fact.MR
Why is India strengthening its Automotive Parts Packaging position?
6.3% CAGR, supported by vehicle output expansion and component-manufacturing corridors.
India’s expanding vehicle production base is creating repeatable packaging flows between component suppliers and final assembly operations. In February 2026, the Press Information Bureau reported passenger-vehicle production of 5.38 million units during 2025. The market is expected to record a 6.3% CAGR over the assessment period as local sourcing supports tighter delivery schedules. Packaging suppliers can deepen account access by positioning reusable systems near manufacturing clusters with frequent component movements.
How are dense supplier networks advancing China’s packaging demand?
5.6% CAGR, owing to automotive production activity and dense supplier networks.
Across China’s manufacturing provinces, concentrated supplier networks create short and frequent packaging cycles between component plants and assembly facilities. In April 2025, the National Bureau of Statistics reported that automobile manufacturing value added increased 11.5% year on year during March. The market is projected to post a 5.6% CAGR between 2026 and 2036 owing to high-frequency interplant movements. Reusable packaging fleets become more practical where shorter return routes support faster circulation and localized repair operations.
Why does Australia offer a distinct replacement-parts opportunity?
4.3% CAGR, shaped by replacement-parts flows across a geographically dispersed vehicle fleet.
Australia’s widely distributed vehicle fleet creates packaging requirements that differ from concentrated assembly-led markets across major manufacturing regions. In September 2025, BITRE reported 22.31 million registered motor vehicles as of January 31 that year. Demand is anticipated to advance at a 4.3% CAGR over the forecast period as replacement parts move through dispersed service networks. Modular protection systems gain relevance by reducing packaging complexity across mixed orders serving distant repair and maintenance locations.
What is reshaping the United Kingdom growth pathway?
4.0% CAGR, attributable to vehicle technology transition and structured aftermarket distribution.
As vehicle technology changes, United Kingdom parts networks must manage established service demand alongside rapidly expanding zero-emission fleets. In April 2026, the Department for Transport reported 42.3 million licensed vehicles at the end of 2025. The market is estimated to record a 4.0% CAGR during the forecast period as model transitions renew packaging requirements. Suppliers gain opportunities when protective formats adapt to changing component profiles without disrupting established dealer distribution systems.
Where is the United States finding sustained packaging demand?
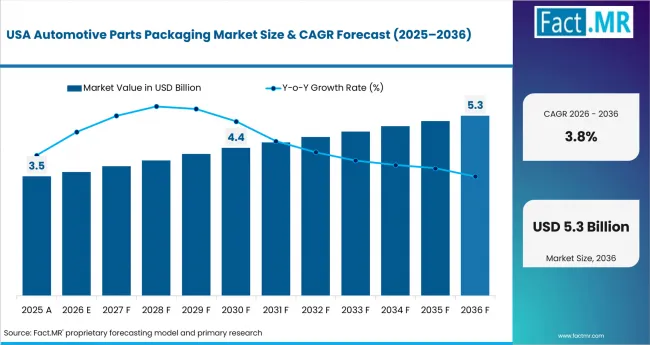
3.8% CAGR, driven by extensive service networks and recurring replacement-parts movement.
Automotive Parts Packaging Market Country Value Analysis | Source: Fact.MR
With personal vehicles central to local mobility, the United States maintains a large service ecosystem requiring continuous parts distribution. In December 2025, the Bureau of Transportation Statistics reported that personal motor vehicles accounted for 86.8% of local trips. Demand is forecast to post a 3.8% CAGR from 2026 to 2036 as service networks sustain replacement-part flows. Providers improve account retention when local design assistance and repair capacity reduce downtime across reusable packaging fleets.
How does export intensity support Germany’s packaging outlook?
3.5% CAGR, supported by export-oriented production and established cross-border supplier clusters.
Export-intensive production keeps German automotive packaging closely tied to repeat component movements across specialized European supply routes. In March 2025, Destatis reported that Germany exported approximately 3.4 million new passenger cars during 2024. The market is projected to register a 3.5% CAGR during the forecast period as cross-border production requires disciplined packaging specifications. Suppliers remain better positioned when reusable formats support predictable handling across recurring routes between specialist plants and assembly operations.
Why do handling standards sustain Japan’s market development?
3.2% CAGR, shaped by established manufacturing programs and exacting component-handling requirements.
Japan’s long-running production programs place strong emphasis on packaging consistency across specialized supplier relationships and synchronized component deliveries. In April 2025, the Ministry of Economy Trade and Industry reported that automobiles accounted for 20% of domestic shipment value. Demand is estimated to advance at a 3.2% CAGR between 2026 and 2036 as model programs renew packaging requirements. Providers gain relevance when protective systems deliver repeatable handling performance across tightly controlled manufacturing and replenishment processes.
Which companies are shaping the Automotive Parts Packaging Market?
Nefab Group, International Paper / DS Smith, Greif Inc., SEE / Sealed Air, Mondi Group, Smurfit Kappa, Myers Industries / Buckhorn.
Competition spans industrial packaging groups and protective-packaging specialists that compete through material breadth, custom engineering and service reach. Nefab Group is positioned strongly through engineered packaging, reusable systems, and local service support across automotive supply corridors. International Paper / DS Smith and Greif Inc. compete across corrugated and industrial packaging requirements for automotive component flows.
SEE / Sealed Air addresses protective formats for sensitive and irregular parts while Mondi Group and Smurfit Kappa support corrugated transport packaging. Myers Industries / Buckhorn adds reusable plastic handling formats through its industrial portfolio. Providers with local design support and broad material coverage are best positioned to serve mixed OEM and aftermarket programs.
Which companies are the key providers?
Nefab Group, International Paper / DS Smith, Greif Inc., SEE / Sealed Air, Mondi Group, Smurfit Kappa, Myers Industries / Buckhorn.
- Nefab Group
- International Paper / DS Smith
- Greif Inc.
- SEE / Sealed Air
- Mondi Group
- Smurfit Kappa
- Myers Industries / Buckhorn
Bibliography
- Bureau of Infrastructure and Transport Research Economics. (2025, September 26). Road vehicles Australia, January 2025. Department of Infrastructure, Transport, Regional Development, Communications and the Arts.
- Bureau of Transportation Statistics. (2025, December 23). Transportation Statistics Annual Report 2025. U.S. Department of Transportation.
- Department for Transport. (2026, April 29). Vehicle licensing statistics, United Kingdom: 2025. GOV.UK.
- EUR-Lex. (2025, September 26). Packaging and packaging waste from 2026. European Union.
- Federal Statistical Office of Germany. (2025, March 20). 3.4 million new cars exported from Germany in 2024. Destatis.
- Ministry of Heavy Industries. (2026, February 10). Status of heavy industries sector. Press Information Bureau, Government of India.
- National Bureau of Statistics of China. (2025, April 25). Industrial production operation in March 2025. National Bureau of Statistics of China.
- National Bureau of Statistics of China. (2026, February 28). Statistical communiqué of the People’s Republic of China on the 2025 national economic and social development. National Bureau of Statistics of China.
- National Highway Traffic Safety Administration. (2026, March). NHTSA 2025 Annual Report: Safety Recalls. U.S. Department of Transportation.
- U.S. Environmental Protection Agency. (2025, August 6). U.S. recycling infrastructure assessment and state data collection reports. U.S. Environmental Protection Agency.
- DS Smith. (2025, March). We proudly announce extended five-year contract with JLR to create fibre-based packaging solutions within a fully integrated service model. DS Smith.
- Nefab Group. (2025, October 1). Nefab begins operations at a new plant in Rio Grande do Sul, Brazil. Nefab Group.
- Greif. (2026). Industrial goods. Greif.
- Ministry of Economy, Trade and Industry. (2025, April 3). METI establishes task force for U.S. tariffs, opens special consultation counters, provides cash flow support, etc. in the short term in response to the execution of additional U.S. tariff measures on automobiles and announcement of reciprocal tariffs. Government of Japan.
This Report Addresses
- The report provides strategic intelligence on Automotive Parts Packaging across Material and Product Type choices that shape plant and supplier logistics programs.
- Regional outlook evaluates India and China alongside Australia. The United Kingdom and United States are assessed with Germany and Japan to complete the country growth comparison.
- Competitive analysis profiles Nefab Group and International Paper / DS Smith alongside Greif Inc. The review also covers SEE / Sealed Air and Mondi Group with Smurfit Kappa and Myers Industries / Buckhorn.
- Material assessment covers Corrugated Board and Plastic systems alongside Foam protection. Metal and Wood formats are assessed for heavier component movements.
- Product Type assessment covers Trays and Crates alongside Bags & Pouches. Boxes and Protective Wraps complete the format review across OEM and aftermarket routes.
What does the Automotive Parts Packaging Market cover?
Corrugated board and reusable plastic formats protect automotive components across OEM and aftermarket logistics networks.
The Automotive Parts Packaging Market covers engineered systems used to protect and move components between Tier suppliers and vehicle assembly plants. Coverage includes Corrugated Board and Plastic formats alongside Foam, Metal and Wood solutions that serve different handling conditions.
The market differs from general vehicle packaging because commercial value comes from component protection and logistics performance before final vehicle sale. Consumer vehicle covers and retail car-care packaging remain outside the boundary as part of an automotive component logistics program.
What is included in the scope?
Automotive parts packaging systems used across inbound supply and interplant movement. Coverage also includes aftermarket distribution networks.
The scope includes Corrugated Board and Plastic alongside Foam, Metal and Wood packaging materials used for component movement. Product Type coverage spans Trays and Crates alongside Bags & Pouches. Boxes and Protective Wraps are also assessed across varied shipment profiles. Application coverage includes Engine Components and Electrical Components alongside Body Parts and Interior Parts. Sales channels include OEM and Aftermarket routes that use program-specific packaging or mixed-order protection across dealer replenishment networks. Adjacent analysis of returnable transport packaging helps frame repeated-loop economics and return-flow requirements across defined automotive component routes.
What is excluded from the scope?
Finished-vehicle covers and consumer retail packaging are outside the scope.
The scope excludes finished-vehicle shipping covers and consumer car-care packaging that does not protect automotive parts during supply-chain movement. General warehouse totes are excluded unless they are specified or engineered for vehicle-component flows across OEM and Tier-supplier networks. Finished vehicle transport equipment also remains outside the boundary because it moves completed vehicles instead of component packaging systems.
How was the analysis built?
The analysis reviewed 120+ sources and 35+ company portfolios while covering 25+ countries and 20+ interviews.
- Primary Research:
- Primary research includes interviews with OEM logistics managers and Tier-supplier packaging engineers alongside returnable-packaging providers and aftersales distribution teams. Interview coverage also includes plant material planners and packaging designers who evaluate damage rates or fleet availability during component movement.
- Desk Research:
- Desk research reviews official vehicle production and registration statistics alongside packaging regulations and transport-packaging provider portfolios. Company announcements and product pages are compared with automotive application evidence to confirm provider activity and current capability coverage.
- Market-Sizing and Forecasting:
- Forecasting uses vehicle and component production trends alongside packaging replacement cycles across defined routes. Models also consider material mix and product-type demand alongside application requirements, sales-channel structure and average packaging pricing.
- Data Validation and Update Cycle:
- Forecasts are validated through provider checks and technical interviews that test assumptions on packaging life or repair frequency and fleet utilization. Portfolio mapping and country evidence are reviewed as production programs or packaging regulations change across the assessment period.
Segmentation
What is the report’s scope and coverage?
Automotive Parts Packaging Market Breakdown By Material, Product Type, And Region | Source: Fact.MR
| Attribute | Details |
|---|---|
| Quantitative Units | USD billion |
| Market Definition | Engineered packaging systems used to protect and move automotive components across inbound supply, interplant movement and aftermarket distribution networks |
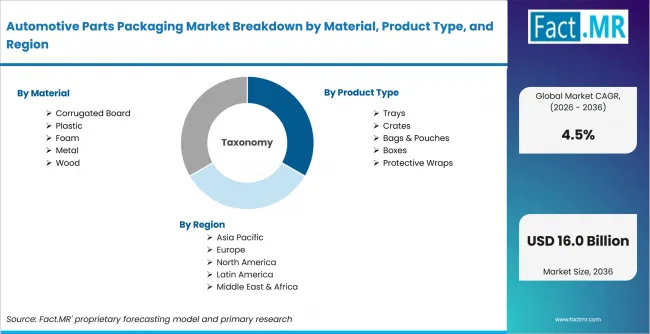
| Material | Corrugated Board; Plastic; Foam; Metal; Wood |
| Product Type | Trays; Crates; Bags & Pouches; Boxes; Protective Wraps |
| Application | Engine Components; Electrical Components; Body Parts; Interior Parts |
| Sales Channel | OEM; Aftermarket |
| Regions Covered | North America; Europe; Asia Pacific; Latin America; Middle East & Africa |
| Countries Covered | India; China; Australia; United Kingdom; United States; Germany; Japan |
| Key Companies Profiled | Nefab Group; International Paper / DS Smith; Greif Inc.; SEE / Sealed Air; Mondi Group; Smurfit Kappa; Myers Industries / Buckhorn |
| Forecast Period | 2026 to 2036 |
| Approach | Hybrid top-down and bottom-up approach using vehicle production and registration activity; component output; packaging replacement cycles; material mix; product-type demand; application requirements; sales-channel split; average packaging pricing; supplier validation and technical interviews |
Source: Fact.MR analysis. Updated Jul 9, 2026
How is the market segmented?
-
By Material:
- Corrugated Board
- Plastic
- Foam
- Metal
- Wood
-
By Product Type:
- Trays
- Crates
- Bags & Pouches
- Boxes
- Protective Wraps
-
By Application:
- Engine Components
- Electrical Components
- Body Parts
- Interior Parts
-
By Sales Channel:
- OEM
- Aftermarket
-
By Region:
- North America
- United States
- Canada
- Europe
- Germany
- United Kingdom
- France
- Italy
- Spain
- Asia Pacific
- India
- China
- Japan
- South Korea
- Australia
- Latin America
- Brazil
- Argentina
- Mexico
- Chile
- Middle East & Africa
- UAE
- Saudi Arabia
- South Africa
- North America
Frequently Asked Questions
Which material category captures the highest share in the Automotive Parts Packaging Market?
Which product format accounts for the largest share?
Which application segment contributes the largest value share?
How prominent is OEM purchasing within the Automotive Parts Packaging Market?
Which country demonstrates the strongest growth potential in the Automotive Parts Packaging Market?
How is the Automotive Parts Packaging Market expected to evolve in China?
What expansion trend is projected for Australia in the Automotive Parts Packaging Market?
What is the United Kingdom growth outlook?
How will demand develop in the United States Automotive Parts Packaging Market?
What pace of growth is Germany projected to achieve?
How is Japan positioned within the Automotive Parts Packaging Market outlook?
What serves as the primary adoption driver in the Automotive Parts Packaging Market?
Which challenge most notably restrains market adoption?
Why are trays important in the Automotive Parts Packaging Market?
Why do OEMs account for a substantial share of packaging demand?
Who worked on this report


Preview the report firsthand - request a free sample
Free SampleGet the brochure for pricing and purchase details
Download PDF