- Market Value (2025): USD 1.8 Bn
- Estimated Value (2026): USD 2.1 Bn
- Forecast Value (2036): USD 7.6 Bn
- CAGR (2026-2036): 13.8%
What is the Biomass Balanced Ammonia Market forecast to be worth by 2036?
USD 2.1 billion in 2026 to USD 7.6 billion by 2036, at a 13.8% CAGR.
- The biomass balanced ammonia market reached USD 1.8 billion in 2025.
- Demand is projected to increase from USD 2.1 billion in 2026 to USD 7.6 billion by 2036.
- The market is forecast to record a 13.8% CAGR from 2026 to 2036 as agriculture, energy and chemical buyers seek lower-carbon nitrogen.
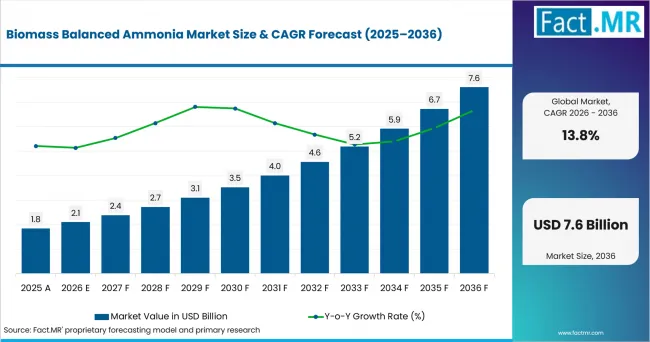
Biomass Balanced Ammonia Market Value Analysis | Source: Fact.MR
What are the defining numbers behind Biomass Balanced Ammonia Market growth?
USD 5.5 billion absolute opportunity by 2036, led by Green Ammonia (Biomass Derived), Agriculture Industry and Direct Industrial Sales.
- Demand Drivers in the Market
- Fertilizer producers need lower-carbon ammonia routes because USDA ERS reported in March 2025 that fertilizer made up 33% to 44% of corn operating costs since 2020.
- Chemical manufacturers need traceable inputs where mass-balance records separate biomass-linked ammonia from conventional ammonia volumes.
- Energy buyers need ammonia that fits fuel trials and storage systems while allowing certificate review before long-term offtake.
- Industrial procurement teams need direct contracts that define delivery, certification and carbon-intensity claims before early volumes scale.
- Key Segments Analyzed
- By Product: Green Ammonia (Biomass Derived) is expected to hold 61.80% share in 2026 because biomass-origin claims are easiest to explain to fertilizer and chemical customers.
- By Application: Fertilizer Production is projected to account for 43.50% share in 2026 due to ammonia’s direct use in nitrogen fertilizer manufacturing.
- By End Use: Agriculture Industry is anticipated to capture 67.90% share in 2026 owing to the scale of crop nitrogen use.
- By Technology: Biomass Gasification Technology is estimated to represent 38.90% share in 2026, supported by conversion pathways that turn biomass into syngas.
- By Formulation: Integrated Green Ammonia Systems are forecast to hold 58.40% share in 2026, shaped by linked feedstock and synthesis control.
- By Distribution Channel: Direct Industrial Sales are expected to account for 74.60% share in 2026 because early customers need auditable supply terms.
- Analyst Opinion at Fact.MR
- Shambhu Nath Jha, Principal Consultant at Fact.MR, states, “Biomass-balanced ammonia gives nitrogen users a familiar molecule with a different feedstock record. Demand is expected to rise where buyers need lower-carbon documentation without changing application systems. Suppliers should combine traceability, synthesis reliability and delivery contracts.”
- Strategic Implications
- Ammonia producers should document biomass input, syngas conversion and mass-balance allocation before commercial negotiations begin.
- Fertilizer brands should connect ammonia sourcing to crop-level carbon programs, especially where Yara reported in May 2025 that a fertilizer mix consisting mostly of Yara Climate Choice products could, depending on the variant, reduce the carbon footprint per tonne of potato by 20% to 40%.
- Energy consortiums should test ammonia handling and port safety requirements before scaling procurement.
- Industrial distributors should keep separate records for biomass-balanced volumes so customers are able to audit claims.
Germany is forecast to record 15.9% CAGR through 2036, supported by crop nutrient demand and ammonia-emission pressure. Brazil is projected to post 14.5% CAGR through grain output and fertilizer diversification. The USA is anticipated to advance at 13.1%, while the UK holds 11.7% and Japan reaches 10.4%.
How does the Biomass Balanced Ammonia Market break down by segment?
Agriculture Industry leads at 67.90%; Direct Industrial Sales lead at 74.60%.
Which Product dominates?
Green Ammonia (Biomass Derived) holds 61.80% share in 2026.
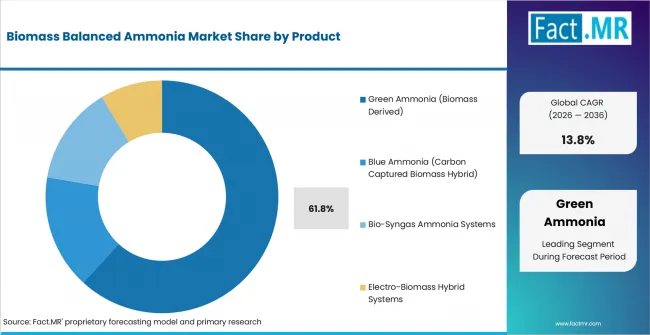
Biomass Balanced Ammonia Market Analysis By Product | Source: Fact.MR
Green Ammonia (Biomass Derived) is expected to lead Product because biomass-origin claims fit customers that want lower-carbon nitrogen. Gasification Based Green Ammonia supports syngas-led projects, while blue hybrid systems remain relevant where carbon capture is tied to feedstock records.
What leads the Application segment?
Fertilizer Production accounts for 43.50% share in 2026.
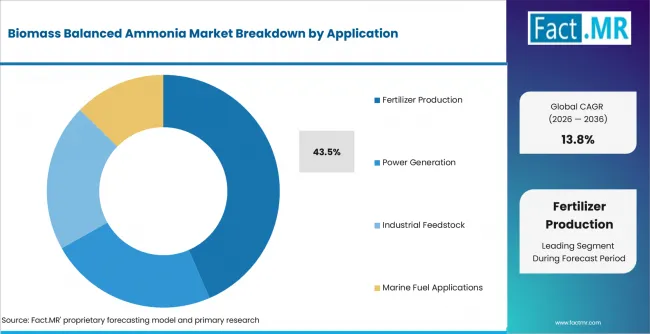
Biomass Balanced Ammonia Market Analysis By Application | Source: Fact.MR
Fertilizer Production is projected to account for the largest Application share because ammonia already feeds nitrogen fertilizer chains. Blended Fertilizer Applications add value where food companies ask suppliers to connect nutrient plans with carbon accounting.
How does End Use shape demand?
Agriculture Industry captures 67.90% share in 2026.
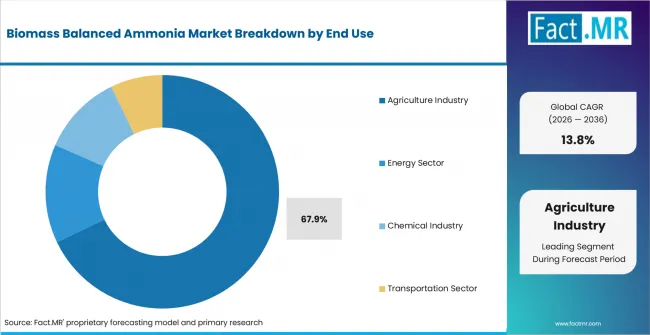
Biomass Balanced Ammonia Market Analysis By End Use | Source: Fact.MR
Agriculture Industry is anticipated to capture 67.90% share in 2026 due to crop nitrogen use. Crop Production Sector remains the practical outlet, while agrochemical companies use lower-carbon ammonia as a portfolio input.
What supports Technology demand?
Biomass Gasification Technology represents 38.90% share in 2026.
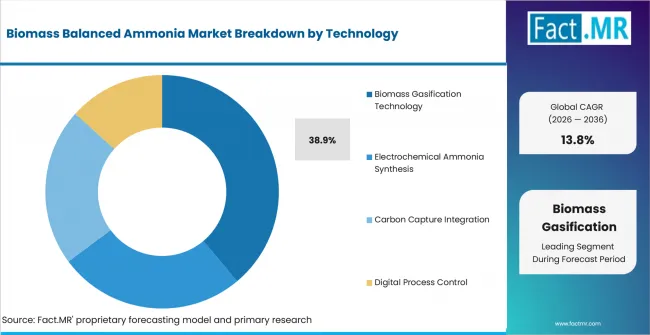
Biomass Balanced Ammonia Market Analysis By Technology | Source: Fact.MR
Biomass Gasification Technology is estimated to represent 38.90% share in 2026 because it creates syngas from biomass inputs. Thermochemical and catalytic systems support projects where synthesis purity is tightly controlled.
Which Formulation leads?
Integrated Green Ammonia Systems hold 58.40% share in 2026.
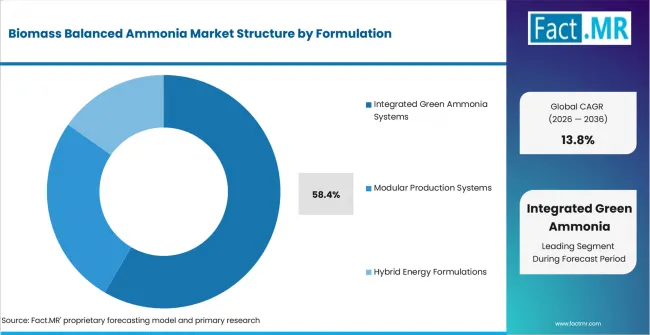
Biomass Balanced Ammonia Market Analysis By Formulation | Source: Fact.MR
Integrated Green Ammonia Systems are forecast to hold 58.40% share in 2026 because early projects need linked feedstock, conversion and synthesis control. Single Stream systems simplify traceability for contract buyers.
What leads Distribution Channel?
Direct Industrial Sales account for 74.60% share in 2026.
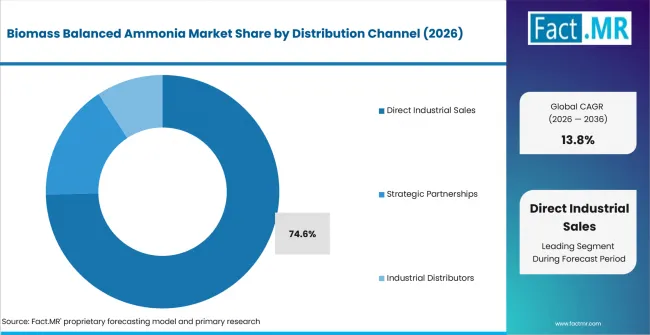
Biomass Balanced Ammonia Market Analysis By Distribution Channel | Source: Fact.MR
Direct Industrial Sales are expected to account for 74.60% share in 2026 because biomass-balanced volumes need qualification before delivery. Enterprise contracts remain practical for crop-nutrition and chemical buyers that want auditable supply.
What is accelerating Biomass Balanced Ammonia Market adoption, and what is holding it back?
Fertilizer decarbonization drives it; cost and certification complexity restrain it.
Drivers Impact Analysis
| Driver | (~) % Impact on CAGR | Geographic Relevance | Impact Timeline |
|---|---|---|---|
| Food-chain pressure for lower-carbon fertilizer | +1.8% | North America, Europe, Brazil | Short term (<= 2 years) |
| Biomass gasification routes for syngas ammonia | +1.5% | Germany, USA, Japan | Medium term (2-4 years) |
| Direct industrial offtake for auditable supply | +1.2% | Global | Medium term (2-4 years) |
| Energy and marine fuel trials using ammonia | +0.9% | Japan, Europe | Long term (>= 4 years) |
| Mass-balance procurement and product carbon claims | +0.7% | Europe, North America | Short term (<= 2 years) |
- Biomass gasification routes: Biomass gasification is expected to give producers a feedstock pathway when residue quality and logistics are controlled.
- Direct industrial offtake: Early buyers are expected to favor direct contracts because ammonia claims require traceable delivery terms and certificate treatment.
- Energy and marine fuel infrastructure context: The IEA reported in 2026 that around 170 ammonia and 130 methanol port terminals are in operation.
- Mass-balance procurement: OCI states that its bio- and green ammonia are ISCC PLUS certified under a mass-balance system, giving buyers a reference for audit-ready claims.
Opportunity Impact Analysis
| Opportunity | (~) % Impact on CAGR | Geographic Relevance | Impact Timeline |
|---|---|---|---|
| Fertilizer programs tied to food-brand targets | +1.4% | USA, Brazil, UK | Short term (<= 2 years) |
| Low-carbon ammonia for industrial feedstock | +1.1% | Germany, USA, Japan | Medium term (2-4 years) |
| Port and fuel-chain preparation | +0.8% | Japan, Europe | Long term (>= 4 years) |
| Hybrid biomass and CCS formulations | +0.6% | North America, Western Europe | Medium term (2-4 years) |
- Fertilizer programs: Food manufacturers are expected to pair lower-carbon ammonia with agronomy support when farmer economics are protected.
- Industrial feedstock replacement: Chemical buyers are likely to use existing ammonia handling systems when supplier documentation is clear and plant records are auditable.
- Port and fuel-chain preparation: IHI said in March 2026 that the Tomakomai plan targets up to 280,000 tons per year of low-carbon ammonia by fiscal 2030.
- Hybrid formulations: Biomass and CCS combinations are expected to widen customer choices where physical supply and claim allocation are aligned.
Restraints Impact Analysis
| Restraint | (~) % Impact on CAGR | Geographic Relevance | Impact Timeline |
|---|---|---|---|
| Higher capital intensity for integrated plants | -0.8% | Global | Short term (<= 2 years) |
| Feedstock availability and quality variation | -0.6% | Brazil, Europe | Medium term (2-4 years) |
| Certification and claim-audit complexity | -0.5% | Europe, North America | Short term (<= 2 years) |
| Price exposure in fertilizer markets | -0.4% | USA, Brazil, UK | Medium term (2-4 years) |
- Capital intensity: Integrated plants need feedstock handling, gas cleanup and synthesis in one project boundary, raising investment needs before volume stabilizes.
- Feedstock variability: Biomass quality varies by season and region, so gasification projects need sorting and drying controls.
- Certification complexity: Biomass-balanced ammonia claims depend on audit-ready records, which are likely to slow procurement where buyers lack standardized claim rules.
- Fertilizer price exposure: USDA ERS reported on March 27, 2025 that fertilizer prices had declined from their 2022 peaks but remained above pre-2021 levels, while early-2025 prices appeared relatively stable.
Which countries are scaling Biomass Balanced Ammonia Market fastest?
- The country comparison spans 5.5 percentage points and forms three practical growth bands across the forecast period.
- Germany remains 1.4 percentage points above Brazil through crop nutrient demand, ammonia-emission pressure and interest in traceable biomass-balanced supply.
- Brazil remains 1.4 percentage points above the USA as record grain output, high fertilizer import dependence and supply diversification support lower-carbon nitrogen alternatives.
- The USA remains 1.4 percentage points above the UK through large crop demand, established ammonia production capacity and direct industrial contracting.
- The UK remains 1.3 percentage points above Japan as nutrient-balance tracking, agricultural emission pressure and auditable fertilizer procurement support adoption.
- Japan closes the displayed range through low-carbon ammonia infrastructure development, hydrogen-derivative policy support and emerging energy applications.
Comparable CAGRs can create different entry conditions due to crop scale, fertilizer dependence, biomass availability, certification requirements and ammonia infrastructure depth. Full report coverage includes North America, Latin America, Western Europe, Eastern Europe, East Asia, South Asia & Pacific, and Middle East & Africa.
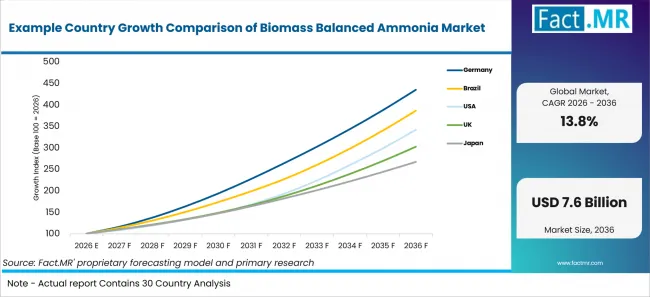
Example Country Growth Comparison Of Biomass Balanced Ammonia Market | Source: Fact.MR
| Country | CAGR |
|---|---|
| Germany | 15.9% |
| Brazil | 14.5% |
| USA | 13.1% |
| UK | 11.7% |
| Japan | 10.4% |
What is powering Germany’s lead?
15.9% CAGR through 2036, driven by crop nutrient demand and ammonia-emission control.
Germany’s growth reflects strong crop production alongside pressure to reduce agricultural ammonia emissions. Destatis reported that German farms harvested 45 million tonnes of grain in 2025, 16% more than in 2024, providing a strong agricultural-production backdrop for fertilizer demand. Biomass-balanced suppliers will need reliable feedstock quality, auditable certification and clear product-carbon documentation to convert this demand into commercial contracts.
How is Brazil scaling demand?
14.5% CAGR through 2036, supported by grain output and fertilizer-supply diversification.
Brazil’s growth is tied to its large agricultural base and dependence on imported fertilizers. Conab reported record Brazilian grain production of 350.2 million tonnes in 2024/25, providing a strong demand backdrop for crop nutrients, while official data showing that more than 85% of fertilizer consumption was supplied by imports in 2025 underscores Brazil’s exposure to external supply risks and the importance of diversified supply. Biomass availability offers additional potential, although residue logistics, feedstock consistency and price sensitivity may slow commercial adoption.
What supports the USA outlook?
13.1% CAGR through 2036, driven by fertilizer-cost visibility and ammonia production depth.
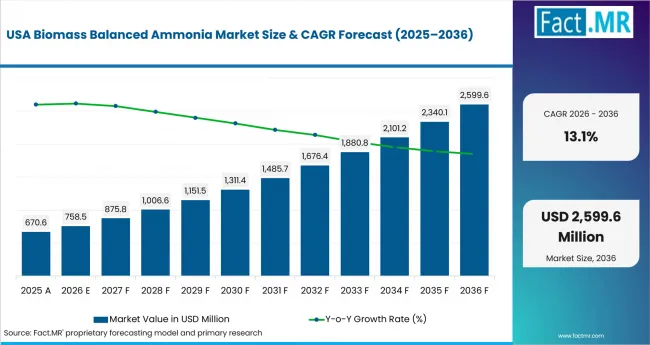
Biomass Balanced Ammonia Market Country Value Analysis | Source: Fact.MR
The USA’s growth reflects large crop demand and an established ammonia production base. USDA ERS reported in March 2025 that fertilizer constituted 33% to 44% of corn operating costs since 2020, underscoring the importance of fertilizer-price economics for corn growers. Low-carbon ammonia investments expand supply options, although biomass-balanced routes must compete with existing natural-gas-based capacity and manage feedstock logistics across states.
What underpins the UK’s growth?
11.7% CAGR through 2036, supported by nutrient-balance tracking and farm-emission pressure.
The UK’s growth is supported by detailed nutrient accounting and continued pressure to reduce agricultural emissions. Defra reported a UK nitrogen surplus of 89.4 kg per hectare of managed agricultural land in 2024, highlighting the continued relevance of nutrient-use efficiency, while agricultural ammonia emissions were estimated to have fallen 20% since 1990. Auditable supply agreements can support early adoption, although smaller crop areas, fertilizer import exposure and sensitivity to premium pricing may restrict scale.
How does Japan perform?
10.4% CAGR through 2036, led by ammonia supply-chain support and energy applications.
Japan’s growth reflects its broader strategy for hydrogen derivatives and low-carbon ammonia infrastructure. The Tomakomai project targets up to 280,000 tons of low-carbon ammonia annually and is certified under Japan’s Hub Development Support Program, which supports infrastructure necessary for transportation and storage. Biomass-balanced demand could emerge within energy applications, although limited domestic biomass availability, project-scale uncertainty and the need for port and safety infrastructure may constrain faster adoption.
Who leads the Biomass Balanced Ammonia Market?
Direct biomass-balance evidence is strongest for BASF SE and OCI Global. Yara International ASA provides verified low-carbon-ammonia context but should not be presented as biomass-balanced suppliers without product-specific biomass-balance evidence.
Yara International ASA is active in ammonia and lower-carbon fertilizer programs. Its July 2026 agreement to acquire Gulf Coast Ammonia’s Texas City plant involves a facility ramping toward 1.3 million metric tonnes per year of nameplate ammonia capacity, while CF Industries expects its Donaldsonville CCS project to support production of approximately 1.9 million tons of low-carbon ammonia annually. These activities provide low-carbon-ammonia context rather than direct evidence of biomass-balanced ammonia. OCI Global is directly relevant through renewable ammonia from biogas and an ISCC PLUS-certified mass-balance system. BASF SE directly documents biomass-balanced BMBcert ammonia.
Which companies are the key providers?
Key companies include BASF SE, OCI Global, Yara International ASA, Algol Chemicals, Fertiglobe plc.
- BASF SE
- OCI Global
- Yara International ASA
- Algol Chemicals
- Fertiglobe plc
Bibliography
- Federal Government of Germany. (2025, September 3). Erntebericht 2025: Landwirtschaft sichert stabile Ernte trotz Wetterextremen.
- Companhia Nacional de Abastecimento. (2025, September 12). Produção de grãos atinge novo recorde com 350,2 milhões de toneladas colhidas na safra 2024/25.
- Ministério da Agricultura e Pecuária. (2025, June 30). Ministro Fávaro recebe governador de Mendoza para tratar de comércio bilateral de fertilizantes.
- Umweltbundesamt. (2026, June 25). Ammoniak-Emissionen.
- Department for Environment, Food & Rural Affairs. (2025, October 30). Soil nutrient balances UK, 2024 – statistics notice.
- Department for Environment, Food & Rural Affairs. (2026, July 29). Chapter 11: Agri-environment. In Agriculture in the United Kingdom 2025.
- International Energy Agency. (2026, June 18). Global Hydrogen Review 2026.
- International Energy Agency. (2026, June 18). Trade and infrastructure. In Global Hydrogen Review 2026.
- Yara International ASA. (2026, July 2). Yara acquires Gulf Coast Ammonia plant.
- CF Industries Holdings, Inc. (2025, July 14). CF Industries announces start-up of Donaldsonville Complex CO2 dehydration and compression unit, permanent CO2 sequestration.
This Report Answers
- The report explains where biomass balanced ammonia is used across product, application and end use.
- Segment analysis identifies Green Ammonia (Biomass Derived), Agriculture Industry and Direct Industrial Sales as leading subsegments.
- Country analysis examines Germany, Brazil, USA, UK and Japan with driver and restraint detail.
- Technology assessment covers biomass gasification, electrochemical synthesis, carbon capture integration and digital process control.
- Application analysis assesses fertilizer production, power generation, industrial feedstock and marine fuel applications.
What does the Biomass Balanced Ammonia Market cover?
Biomass-derived ammonia, bio-syngas systems, hybrid ammonia systems and direct industrial supply used for lower-carbon nitrogen and energy applications.
The Biomass Balanced Ammonia Market covers ammonia linked to biomass-derived feedstock or a documented mass-balance system. It connects to adjacent coverage of biomass balanced ammonia, green ammonia drip fertilizer blends and ammoniacal nitrogen where nitrogen claims meet fertilizer applications.
The assessment differs from the broader ammonia category because conventional fossil ammonia is included only when it forms part of a biomass-balanced, renewable-ammonia or carbon-captured hybrid pathway. Related green hydrogen activity is treated as context when it supports ammonia derivatives.
What is included in the scope?
Biomass balanced ammonia systems used in fertilizer, industrial feedstock, power and marine fuel applications.
The scope includes Green Ammonia (Biomass Derived), Blue Ammonia (Carbon Captured Biomass Hybrid), Bio-Syngas Ammonia Systems and Electro-Biomass Hybrid Systems. It includes fertilizer, power, industrial feedstock and marine fuel. Adjacent coverage of hydrogen, biorefinery, bio-feedstock and carbon-neutral nitrogen programs supports the boundary between feedstock supply and nitrogen-product demand.
What is excluded from the scope?
Conventional ammonia and unrelated hydrogen projects are outside the scope.
Conventional natural-gas or coal-based ammonia is excluded when sold without biomass-balanced, renewable-ammonia or carbon-captured allocation. Pure hydrogen production, base biomass fuel production and general fertilizer distribution are excluded unless they connect directly to ammonia synthesis or ammonia offtake. Downstream pages such as green ammonia bunkering sensors and marine propulsion low-carbon ammonia are used only where fuel handling affects ammonia demand.
How Was the Analysis Built?
The analysis draws on 120+ sources, 35+ company portfolios, 25+ countries, and more than 20 industry interviews.
- Primary Research: Primary research includes discussions with manufacturers, service providers, technology developers, distributors, end users, procurement teams, and subject-matter experts. These conversations examine purchasing priorities, product adoption, operational challenges, approval requirements, competitive positioning, and the factors that influence wider market acceptance.
- Desk Research: Desk research covers government statistics, regulatory publications, company filings, trade data, technical studies, industry associations, standards, public policy, and other authoritative sources. Every source used in the analysis is documented in the bibliography.
- Market Sizing and Forecasting: Market estimates combine historical performance, demand indicators, pricing and volume trends, segment shares, company participation, country-level growth, adoption patterns, investment activity, and barriers to market expansion.
- Data Validation and Update Cycle: Findings are validated by comparing primary interviews with public data, company activity, regulatory changes, trade patterns, and industry developments. Regular updates review new product launches, capacity changes, partnerships, approvals, procurement trends, and shifts in commercial adoption.
What is the report’s scope and coverage?
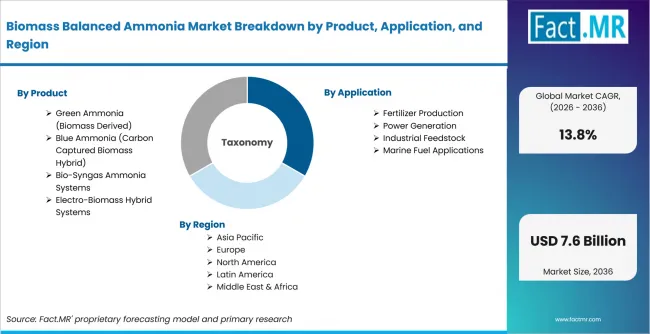
Biomass Balanced Ammonia Market Breakdown By Product, Application, And Region | Source: Fact.MR
| Attribute | Details |
|---|---|
| Quantitative Units | USD Billion in 2026 to USD Billion by 2036 at a CAGR |
| Market Definition | Biomass-balanced ammonia linked to biomass-derived feedstock or a documented mass-balance system, used for lower-carbon nitrogen, fertilizer production, industrial feedstock, power generation and marine fuel applications |
| Product | Green Ammonia (Biomass Derived); Blue Ammonia (Carbon Captured Biomass Hybrid); Bio-Syngas Ammonia Systems; Electro-Biomass Hybrid Systems |
| Application | Fertilizer Production; Power Generation; Industrial Feedstock; Marine Fuel Applications |
| End Use | Agriculture Industry; Energy Sector; Chemical Industry; Transportation Sector |
| Technology | Biomass Gasification Technology; Electrochemical Ammonia Synthesis; Carbon Capture Integration; Digital Process Control |
| Formulation | Integrated Green Ammonia Systems; Modular Production Systems; Hybrid Energy Formulations |
| Distribution Channel | Direct Industrial Sales; Strategic Partnerships; Industrial Distributors |
| Regions Covered | North America; Latin America; Western Europe; Eastern Europe; East Asia; South Asia & Pacific; Middle East & Africa |
| Countries Covered | Germany; Brazil; USA; UK; Japan |
| Key Companies Profiled | BASF SE; OCI Global; Yara International ASA; Algol Chemicals; Fertiglobe plc |
| Forecast Period | 2026 to 2036 |
| Approach | Market assessment using primary research and desk research covering biomass feedstock availability, fertilizer demand, ammonia production, biomass gasification routes, mass-balance certification, low-carbon ammonia projects, direct industrial offtake, country-level adoption, company participation, pricing, investment activity and barriers to commercial scale-up |
How is the market segmented?
-
By Product
- Green Ammonia (Biomass Derived)
- Gasification Based Green Ammonia
- Biochemical Ammonia Pathways
- Blue Ammonia (Carbon Captured Biomass Hybrid)
- CCS Integrated Ammonia Systems
- Hybrid Reforming Systems
- Bio-Syngas Ammonia Systems
- Biomass Gas Reformers
- Gas Cleaning Systems
- Electro-Biomass Hybrid Systems
- Electrochemical Synthesis Units
- Power Integrated Ammonia Systems
- Green Ammonia (Biomass Derived)
-
By Application
- Fertilizer Production
- Nitrogen Fertilizer Manufacturing
- Blended Fertilizer Applications
- Power Generation
- Ammonia Fuel Power Systems
- Energy Storage Applications
- Industrial Feedstock
- Chemical Manufacturing Inputs
- Refining Applications
- Marine Fuel Applications
- Shipping Fuel Systems
- Port Infrastructure Systems
- Fertilizer Production
-
By End Use
- Agriculture Industry
- Crop Production Sector
- Agrochemical Companies
- Energy Sector
- Power Utilities
- Fuel Producers
- Chemical Industry
- Industrial Chemical Producers
- Petrochemical Substitutes
- Transportation Sector
- Marine Transport Operators
- Heavy Transport Industry
- Agriculture Industry
-
By Technology
- Biomass Gasification Technology
- Thermochemical Conversion Systems
- Catalytic Conversion Systems
- Electrochemical Ammonia Synthesis
- Electrolysis Based Systems
- Hybrid Electro-Biomass Systems
- Carbon Capture Integration
- Post Combustion Capture Systems
- Pre Combustion Capture Systems
- Digital Process Control
- AI Based Optimization Systems
- IoT Enabled Plant Systems
- Biomass Gasification Technology
-
By Formulation
- Integrated Green Ammonia Systems
- Single Stream Production Systems
- Multi Feedstock Systems
- Modular Production Systems
- Scalable Ammonia Units
- Portable Ammonia Systems
- Hybrid Energy Formulations
- Renewable Integrated Systems
- Grid Hybrid Systems
- Integrated Green Ammonia Systems
-
By Distribution Channel
- Direct Industrial Sales
- Government Energy Contracts
- Enterprise Supply Contracts
- Strategic Partnerships
- Energy Consortium Sales
- Infrastructure Partnerships
- Industrial Distributors
- Energy Equipment Distributors
- Regional Chemical Traders
- Direct Industrial Sales
-
By Region
- North America
- Latin America
- Western Europe
- Eastern Europe
- East Asia
- South Asia & Pacific
- Middle East & Africa

