- Market Value (2025): USD 818.2 Mn
- Estimated Value (2026): USD 882.0 Mn
- Forecast Value (2036): USD 1869.2 Mn
- CAGR (2026-2036): 7.8%
What is the Clean-Label Butter Powders Market forecast to be worth by 2036?
USD 882.0 million in 2026 to USD 1,869.2 million by 2036 at a 7.8% CAGR.
- The Clean-Label Butter Powders Market was valued at USD 818.2 million in 2025.
- Demand is projected to increase from USD 882.0 million in 2026 to USD 1,869.2 million by 2036.
- The market is forecast to record 7.8% CAGR from 2026 to 2036 as food product teams use dry butter ingredients in bakery, savory and ready-food systems.
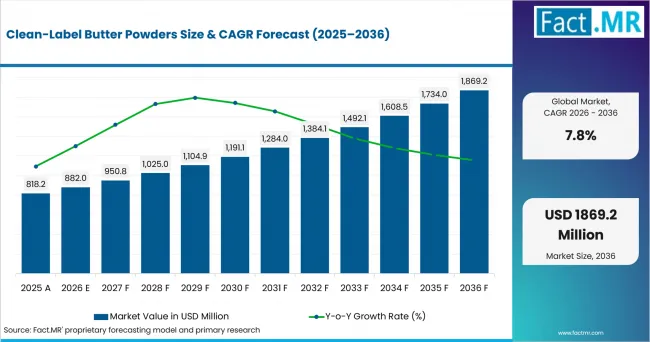
Clean Label Butter Powders Value Analysis | Source: Fact.MR
What are the defining numbers behind Clean-Label Butter Powders Market growth?
An absolute opportunity of USD 987.2 million is expected between 2026 and 2036.
- Demand Drivers in the Market
- Bakery makers need a stable butter profile that works in dry mixes. USDA Economic Research Service reported in June 2026 that U.S. food spending reached $2.51 trillion in 2025.
- Snack and seasoning product teams need concentrated dairy character in low-moisture systems. Butter powder adds buttery taste and mouthfeel to seasonings and coatings. It also fits dry sauce bases.
- Ready-food makers need inputs that move easily through dry handling systems. Powdered butter can support soups and meal parts with less chilled-fat handling at the dry-mix stage.
- Product development teams need label-compatible dairy inputs for additive-free or clean-label recipes. Supplier records help teams compare label claims with flavor and fat level.
- Key Segments Analyzed
- By Butter Powder Type: Sweet cream butter powder is expected to hold 34.0% share in 2026 due to its familiar butter profile and broad fit across bakery, mixes and prepared foods.
- By Label Positioning: Additive-free is projected to account for 31.0% share in 2026 as formulators limit optional ingredients when a shorter declaration is part of the product brief.
- By Application: Bakery is anticipated to capture 36.0% share in 2026. Butter taste remains central to cakes and biscuits. It is also used in fillings and dry mixes.
- By Fat Content: Less than 40% fat is estimated to represent 29.0% share in 2026 where formulators balance butter character with powder flow, handling and recipe solids.
- Analyst Opinion at Fact.MR
- Shambhu Nath Jha is Principal Consultant at Fact.MR. He states: “Commercial value depends on more than drying butter. Food makers compare the ingredient statement with the butter profile. They also check how the powder behaves in the plant. Demand is expected to favor suppliers that pair clear label claims with hands-on use support.”
- Strategic Implications
- Dairy ingredient suppliers should make fat level and carrier choice easy to compare. USDA NASS reported in April 2026 that U.S. butter production reached 2.39 billion pounds in 2025. A large butter stream supports ingredient availability while keeping raw-material quality central to supplier choice.
- Savory-ingredient companies should support seasoning and sauce uses with clear use guidance. Formulators need practical information on dispersion and finished flavor intensity.
- Export-oriented makers should maintain traceable certification and origin records. These documents support non-GMO and organic-compatible label claim across customer markets.
The USA is forecast to record 8.3% CAGR through 2036 on the back of commercial bakery use. France is projected to post 8.3% as dairy processing supports ingredient supply. China is anticipated to reach 8.1% as food production expands. Germany is expected to record 8.1% owing to its dairy-plant base. Japan is forecast at 7.0% supported by business-use butter demand.
How does the Clean-Label Butter Powders Market break down by segment?
Sweet cream butter powder is projected to lead Butter Powder Type at 34.0% share in 2026; while Bakery leads Application at 36.0% share.
Which Butter Powder Type dominates?
Sweet cream butter powder is expected to hold 34.0% share in 2026.
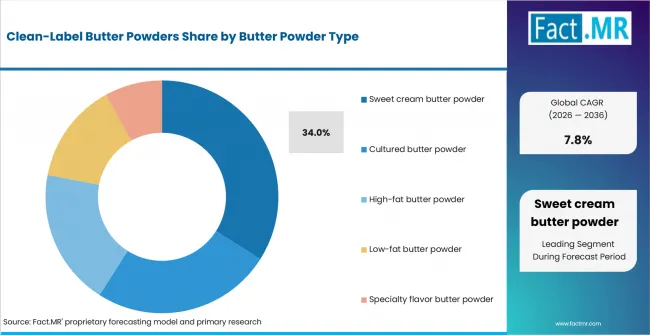
Clean Label Butter Powders Analysis By Butter Powder Type | Source: Fact.MR
Sweet cream butter powder is expected to lead because its flavor works across sweet and savory recipes. Cultured powder serves recipes that need a stronger fermented note. High-fat grades add richness and low-fat grades suit lighter recipes. The grade is easy to place in cakes and cookie mixes. It can also work in soup bases and seasoning blends. Product teams can adjust the dose without changing the full recipe.
What leads the Label Positioning segment?
Additive-free is projected to account for 31.0% share in 2026.
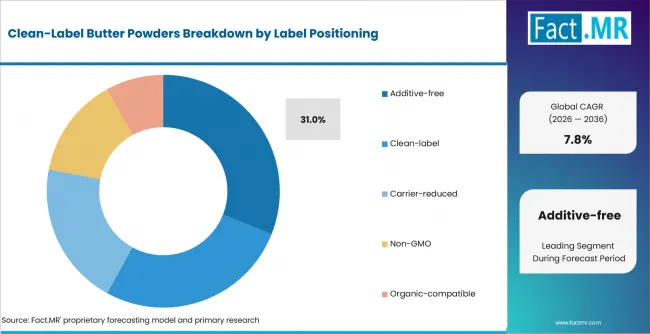
Clean Label Butter Powders Analysis By Label Positioning | Source: Fact.MR
Additive-free label claim is projected to lead when brands want shorter ingredient statements. Clean-label products form a wider group built around familiar inputs and clear sourcing. Carrier-reduced powders raise the share of butter-derived material. Non-GMO and organic-compatible grades rely on clear records. The claim is simple for shoppers to read and for brands to explain. Food makers still need a clear list of all carriers and aids.
How does Application shape demand?
Bakery is anticipated to lead with 36.0% share in 2026.
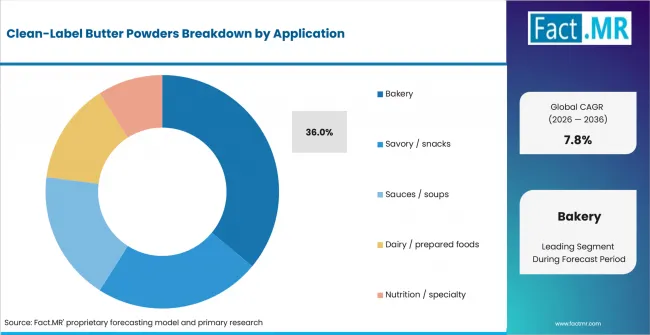
Clean Label Butter Powders Analysis By Application | Source: Fact.MR
Bakery is anticipated to lead because butter flavor is central to many baked foods. Destatis reported in January 2026 that Germany produced 1.7 million tonnes of ready meals in 2024. Bakers can add the powder with flour and other dry goods. The same powder can serve more than one cake or biscuit line when the butter note stays stable after heat.
What supports demand within Fat Content?
Less than 40% fat is estimated to represent 29.0% share in 2026.
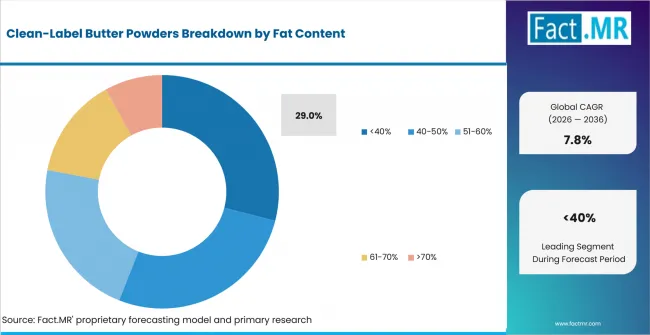
Clean Label Butter Powders Analysis By Fat Content | Source: Fact.MR
Powders below 40% fat are estimated to lead because they balance butter taste with dry handling. The 40-50% and 51-60% ranges add more dairy fat. Grades above 60% suit recipes that need a richer butter note. Lower-fat grades can be easier to blend into mixes that already contain oil. They give product teams more room to tune the final fat level.
What is accelerating Clean-Label Butter Powders Market adoption, and what is holding it back?
Shelf-stable butter flavor and label simplicity support adoption. Dairy-fat price exposure, carrier trade-offs and certification requirements constrain recipe choices.
Drivers Impact Analysis
| DRIVER | (~) % IMPACT ON CAGR | GEOGRAPHIC RELEVANCE | IMPACT TIMELINE |
|---|---|---|---|
| Bakery use of dry butter ingredients | +1.3% | Global | Short term (<= 2 years) |
| Clean-label formulation programs | +1.0% | North America, Europe, East Asia | Medium term (2-4 years) |
| Shelf-stable dairy ingredient handling | +0.8% | Global | Medium term (2-4 years) |
| Expansion of butter and dairy processing | +0.6% | North America, Europe, East Asia | Long term (>= 4 years) |
Source: Fact.MR analysis. Updated Sep 23, 2026
Opportunity Impact Analysis
| OPPORTUNITY | (~) % IMPACT ON CAGR | GEOGRAPHIC RELEVANCE | IMPACT TIMELINE |
|---|---|---|---|
| Carrier-reduced and higher-butter-solids formats | +0.9% | North America, Europe | Medium term (2-4 years) |
| Application-specific bakery and snack grades | +0.7% | Global | Short term (<= 2 years) |
| Documented non-GMO and organic-compatible products | +0.5% | North America, Europe | Long term (>= 4 years) |
Source: Fact.MR analysis. Updated Sep 23, 2026
Restraints Impact Analysis
| RESTRAINT | (~) % IMPACT ON CAGR | GEOGRAPHIC RELEVANCE | IMPACT TIMELINE |
|---|---|---|---|
| Butter and milk-fat price variability | -0.6% | Global | Short term (<= 2 years) |
| Carrier and label-positioning trade-offs | -0.4% | Global | Medium term (2-4 years) |
| Certification and claim-documentation burden | -0.3% | North America, Europe, East Asia | Long term (>= 4 years) |
Source: Fact.MR analysis. Updated Sep 23, 2026
Which countries are scaling the Clean-Label Butter Powders Market through 2036?
- The country comparison spans 1.3 percentage points across the forecast period.
- The USA and France remain level at 8.3% CAGR through commercial food production and dairy-processing depth.
- China and Germany remain 0.2 percentage point below the USA and France at 8.1% CAGR.
- Japan closes the displayed range at 7.0% CAGR as business-use butter demand supports industrial uses.
- Comparable CAGRs can create different entry conditions because dairy supply and food-production scale vary by country.
Full report coverage includes North America and Latin America. It also covers Western Europe and Eastern Europe. East Asia and South Asia & Pacific are included together with Middle East & Africa.
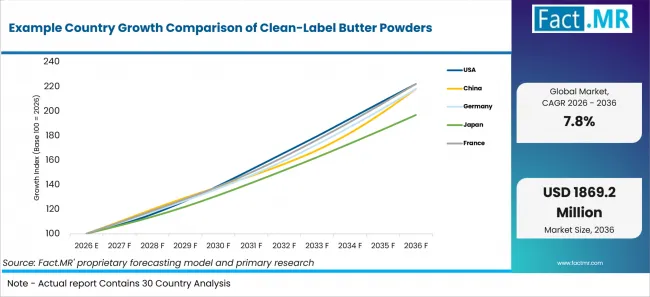
Example Country Growth Comparison Of Clean Label Butter Powders | Source: Fact.MR
| Country | CAGR (2026-2036) |
|---|---|
| United States | 8.3% |
| France | 8.3% |
| China | 8.1% |
| Germany | 8.1% |
| Japan | 7.0% |
Source: Fact.MR analysis. Updated Sep 23, 2026
What supports USA adoption?
8.3% CAGR, supported by a large butter-plant base and extensive bakery production.
The United States has a large commercial bakery base. The U.S. Bureau of Labor Statistics reported in January 2026 that bakeries and tortilla manufacturing employed about 346,600 people in the latest 2025 observation shown in its seasonally adjusted table. That scale supports steady ingredient use across bread and pastry production. Dry butter formats help plants standardize flavor across production runs. Large plants need a steady taste from batch to batch. Dry butter inputs can help teams keep a set dose in premixes. They can cut the need for cold space where dry goods are staged. That can make plant planning more direct.
How is China scaling demand?
8.1% CAGR, shaped by domestic milk production and a large processed-food plant base.
China has a large domestic milk base for dairy ingredient production. The National Bureau of Statistics reported in February 2026 that milk output reached 40.91 million tonnes in 2025. Clean-label powders still compete on flavor and label fit. The size of the milk pool gives local plants a broad raw material base. Food makers still compare local and imported dairy inputs on taste and price. A clear label claim can help a powder stand out when several products meet the same basic spec.
What supports Germany’s adoption?
8.1% CAGR, supported by substantial butter production within the European dairy system.
Germany has a deep dairy-plant base. Eurostat reported in November 2025 that Germany accounted for 20.6% of EU butter production in 2024. Germany's 20.6% share shows the scale of its butter-production base within the EU. Bakery and savory makers can use dry butter ingredients where stable dosing is valuable. Germany also has a large base of food plants that use dairy inputs. Bakery and ready-food lines often need set specs for each batch. Dry butter can fit these systems because it is weighed with other dry goods and stored in a stable pack.
How does Japan perform?
7.0% CAGR, influenced by business-use butter demand and managed dairy import conditions.
Japan combines business-use butter demand with managed dairy imports. Japan's Ministry of Agriculture, Forestry and Fisheries reported on January 30, 2026 that the FY2026 import quota for butter and skim milk powder would remain at the WTO minimum current-access commitment, equivalent to 137,000 tonnes of raw milk. Stable supply planning matters for plants that use butter-derived inputs. Dry formats support storage and recipe consistency. A clear spec sheet helps food makers plan repeat orders. Food makers in Japan tend to value stable supply and clear specs. Dry butter products can help with both needs when storage space is tight. The format can make small recipe changes easier because the dose is measured as a dry input.
What supports France adoption?
8.3% CAGR, backed by a large butter sector and active dairy-powder processing.
France combines butter production with active dairy-powder processing. Agreste reported in September 2026 that butter production reached 28,693 tonnes in July 2026. That plant base supports dry dairy ingredients for bakery and ready foods. Formulators still compare butter taste with fat level and label requirements. France has a long dairy base and many food plants that use milk fat. Powder formats can link these two parts of the value chain. Bakery teams can use them for a set butter note. Ready-food teams can use them in dry sauce bases.
Who leads the Clean-Label Butter Powders Market?
Kerry Group supplies dairy-taste systems and butter-related flavor solutions for food manufacturers. In September 2025, Kerry launched Smart Taste™, a range designed to preserve taste while addressing cost, supply-chain, nutrition, regulatory, and sustainability pressures.
The portfolio includes Dairy Taste capabilities and can support cleaner-label formulation goals. Bluegrass Ingredients and Kanegrade provide specialty dairy powders, including butter-powder products. Butter Buds supplies concentrated butter ingredients and powdered butter-flavor systems for applications such as bakery, ready meals, sauces, seasonings, and snacks. Supplier differentiation is expected to reflect butter-profile accuracy, application fit, ease of use, and formulation support.
Dairy Farmers of America participates through commercial dairy-ingredient channels, including dairy powders, specialty powders, concentrates, and butter. Buyers can compare these suppliers according to the required butter profile, fat level, application format, ingredient declaration, specification consistency, and technical support.
Which companies are the key providers?
Companies profiled include Kerry Group; Kanegrade; Bluegrass Ingredients; Butter Buds; and Dairy Farmers of America.
- Kerry Group
- Kanegrade
- Bluegrass Ingredients
- Butter Buds
- Dairy Farmers of America
Bibliography
- Zeballos, E., & Sinclair, W. (2026, June 11). Total U.S. food spending reached $2.51 trillion in 2025. U.S. Department of Agriculture, Economic Research Service.
- U.S. Department of Agriculture, National Agricultural Statistics Service. (2026, April 24). Dairy products 2025 summary.
- Statistisches Bundesamt (Destatis). (2026, January 14). Produktion von Fertiggerichten binnen fünf Jahren mengenmäßig um 25,6 % gestiegen [Production of ready meals increased by 25.6% in volume within five years].
- U.S. Bureau of Labor Statistics. (2026, February 11). Table B-1a. Employees on nonfarm payrolls by industry sector and selected industry detail, seasonally adjusted.
- National Bureau of Statistics of China. (2026, February 28). Statistical communiqué of the People’s Republic of China on the 2025 national economic and social development.
- Eurostat. (2025, November 20). Milk production reached 161.8 million tonnes in 2024.
- Agreste. (2026, September 15). Lait : Juillet 2026 - la collecte de lait quasi stable [Milk: July 2026—Milk collection nearly stable].
- Kerry Group. (2025, September 30). Kerry launches Smart Taste™ to help customers navigate market complexities without compromising on taste.
This Report Answers
- The report explains where clean-label butter powders are used by type and label claim. It also covers end use and fat level.
- Segment analysis identifies the main subsegments and explains why food makers use them.
- Country analysis reviews the five listed markets and the dairy or food-plant factors that support use.
- Competitive analysis reviews active providers across butter powder and dairy taste ranges.
- Use analysis reviews how butter taste and fat level affect product choice. Label wording is assessed at the same time.
What does the Clean-Label Butter Powders Market cover?
The Clean-Label Butter Powders Market covers dry butter-based inputs used in food production. The products deliver butter taste and dairy richness in a shelf-stable form. Coverage includes sweet cream and cultured formats. High-fat and low-fat grades are included.
The assessment covers additive-free and clean-label claims. Carrier-reduced and non-GMO products are included. Organic-compatible products are included as well. Uses span bakery and snacks. Sauces and ready foods form another use group. Fat level is reviewed because it changes taste and powder flow.
What is included in the scope?
The scope includes powdered butter inputs and concentrated dry butter systems for food makers. Uses cover dry mixes and bakery products. Snack seasonings and ready foods are included.
Products may use carriers or other permitted aids when they fit the stated label claim. The report separates additive-free and carrier-reduced products. Supplier records help food makers check whether a powder fits the recipe brief.
What is excluded from the scope?
The market boundary focuses on dry industrial inputs. Retail block butter and margarine fall outside that boundary. Ghee and liquid butter products are treated in other groups. General milk powder and whey powder remain separate when butter taste falls outside their main role.
Buttermilk powder remains an adjacent dairy powder unless it is sold within a butter-flavor recipe that fits the market definition. Non-dairy butter alternatives remain outside the core boundary when they lack a butter-derived ingredient.
How Was the Analysis Built?
The analysis draws on 120+ sources, 35+ company portfolios, 25+ countries, and more than 20 industry interviews.
- Primary Research: Primary research includes discussions with manufacturers, service providers, technology developers, distributors, end users, and subject-matter experts. These conversations examine purchasing priorities, product adoption, operational challenges, approval requirements, competitive positioning, and the factors that influence wider market acceptance.
- Desk Research: Desk research covers government statistics, regulatory publications, company filings, trade data, technical studies, industry associations, standards, public policy, and other authoritative sources. Every source used in the analysis is documented in the bibliography.
- Market Sizing and Forecasting: Market estimates combine historical performance, demand indicators, pricing and volume trends, segment shares, company participation, country-level growth, adoption patterns, investment activity, and barriers to market expansion.
- Data Validation and Update Cycle: Findings are validated by comparing primary interviews with public data, company activity, regulatory changes, trade patterns, and industry developments. Regular updates review new product launches, capacity changes, partnerships, approvals, and shifts in commercial adoption.
Segmentation
What is the report’s scope and coverage?
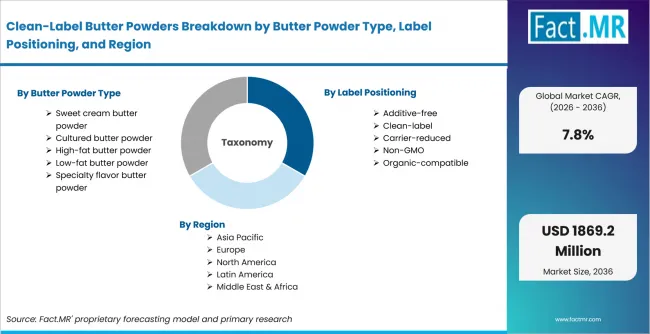
Clean Label Butter Powders Breakdown By Butter Powder Type, Label Positioning, And Region | Source: Fact.MR
| Attribute | Details |
|---|---|
| Quantitative Units | USD million |
| Market Definition | Shelf-stable powdered ingredients based on butter or concentrated butter character and positioned for clean-label food formulation, including products differentiated by butter type, label claim and fat level. |
| Butter Powder Type | Sweet cream butter powder; Cultured butter powder; High-fat butter powder; Low-fat butter powder; Specialty flavor butter powder |
| Label Positioning | Additive-free; Clean-label; Carrier-reduced; Non-GMO; Organic-compatible |
| Application | Bakery; Savory / snacks; Sauces / soups; Dairy / prepared foods; Nutrition / specialty |
| Fat Content | <40%; 40-50%; 51-60%; 61-70%; >70% |
| Regions Covered | North America; Latin America; Western Europe; Eastern Europe; East Asia; South Asia & Pacific; Middle East & Africa |
| Countries Covered | United States; China; Germany; Japan; France |
| Key Companies Profiled | Kerry Group; Kanegrade; Bluegrass Ingredients; Butter Buds; Dairy Farmers of America |
| Forecast Period | 2026 to 2036 |
| Approach | Hybrid top-down and bottom-up approach using butter and milk processing indicators, downstream food applications, supplied segment shares, country growth rates and verified provider portfolios. |
Source: Fact.MR analysis. Updated Sep 23, 2026
How is the market segmented?
-
By Butter Powder Type:
- Sweet cream butter powder
- Cultured butter powder
- High-fat butter powder
- Low-fat butter powder
- Specialty flavor butter powder
-
By Label Positioning:
- Additive-free
- Clean-label
- Carrier-reduced
- Non-GMO
- Organic-compatible
-
By Application:
- Bakery
- Savory / snacks
- Sauces / soups
- Dairy / prepared foods
- Nutrition / specialty
-
By Fat Content:
- <40%
- 40-50%
- 51-60%
- 61-70%
- >70%
-
By Region:
- North America
- Latin America
- Western Europe
- Eastern Europe
- East Asia
- South Asia & Pacific
- Middle East & Africa
Frequently Asked Questions
How big is the clean-label butter powders market in 2026?
What is the CAGR of the clean-label butter powders market from 2026 to 2036?
Which butter powder type leads the clean-label butter powders market?
Which application leads the clean-label butter powders market?
Who are the leading companies in the clean-label butter powders market?
Who worked on this report


Preview the report firsthand - request a free sample
Free SampleGet the brochure for pricing and purchase details
Download PDF