- Market Value (2025):USD 15.6 Bn
- Estimated Value (2026): USD 17.3 Bn
- Forecast Value (2036): USD 49.2 Bn
- CAGR (2026-2036): 11.0%
What is the Cloud FinOps Market forecast to be worth by 2036?
USD 17.3 billion in 2026 to USD 49.2 billion by 2036, at 11.0% CAGR.
- The Cloud FinOps Market crossed a valuation of USD 15.6 billion in 2025 across enterprise cost-governance and optimization programs.
- Demand is projected to increase from USD 17.3 billion in 2026 to USD 49.2 billion by 2036.
- The market is anticipated to record an 11.0% CAGR from 2026 to 2036 as engineering teams and finance leaders formalize shared cloud accountability.
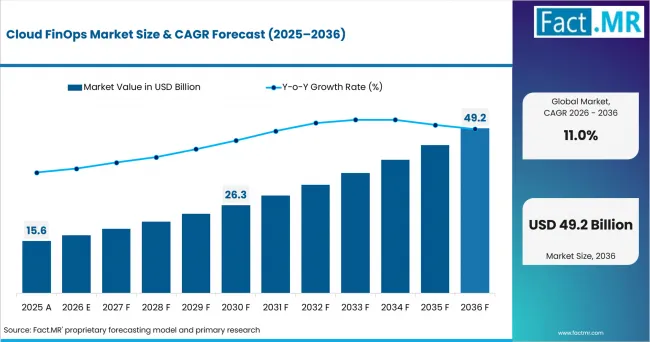
Cloud Finops Market Market Value Analysis | Source: Fact.MR
What are the defining numbers behind Cloud FinOps Market growth?
USD 31.9 billion absolute opportunity by 2036, led by Software, Cloud deployment and BFSI users.
- Demand Drivers in the Market
- FinOps practitioners need consistent allocation logic because shared services and untagged resources often obscure the business owner responsible for recurring cloud charges.
- Engineering teams need workflow-level cost feedback so architecture decisions are reviewed before resource changes appear inside the next billing cycle.
- Finance leaders need forecast controls owing to usage-based pricing models that move faster than annual budgeting and manual variance review processes.
- Platform teams need cross-provider normalization shaped by multicloud estates where billing dimensions and discount structures differ across individual cloud providers.
- Key Segments Analyzed
- By Component: Software is expected to account for 43.4% share in 2026, driven by allocation analytics and automated cost-governance workflows.
- By Deployment: Cloud is projected to garner 44.6% share in 2026, supported by rapid integration with cloud billing exports and usage telemetry.
- By Organization Size: SME is anticipated to record 48.0% share in 2026, attributable to self-service tools and lower implementation overhead.
- By Application: Workflow automation is estimated to hold 40.3% share in 2026, owing to recurring anomaly review and policy enforcement needs.
- By End Use: BFSI is forecast to capture 36.5% share in 2026, reinforced by cloud concentration risk and detailed cost-accountability requirements.
- Analyst Opinion at Fact.MR
- Shambhu Nath Jha, Senior Analyst at Fact.MR states, “Cloud FinOps is drawing attention because cost ownership breaks down when shared infrastructure cannot be mapped cleanly to products. Adoption is expected to favor platforms that connect allocation logic to engineering action and finance planning. Providers should combine normalized cost data with policy automation and clear unit measures for cloud and AI workloads.”
- Strategic Implications
- FinOps leaders should define allocation rules around products and services before expanding dashboards across additional cloud and AI cost sources.
- Platform engineering teams should place cost checks inside deployment workflows so waste signals reach resource owners while remediation remains technically simple.
- Finance teams should compare forecast accuracy and commitment coverage before approving platforms that promise savings without transparent allocation and variance logic.
- Software providers should document source normalization and policy behavior clearly before extending cost governance across public cloud and hybrid technology estates.
Organizations are increasingly adopting advanced FinOps tools to improve cost governance and optimize spending across cloud and on-premises infrastructure. Apptio introduced Conversational Insights and additional hybrid cost-management capabilities for technology finance teams in June 2026. Cloudability Intelligent Forecasting and Data Center TCO became generally available during the second quarter of 2026. The release reflects a shift toward conversational analysis while cost governance expands beyond public-cloud billing records into broader technology spending.
India is projected to record a 12.8% CAGR during the forecast period, supported by software-sector scaling and distributed cloud engineering across cloud computing deployments. China is estimated to post a 12.1% CAGR by 2036, driven by computing-capacity expansion and large cloud estates. Australia is anticipated to register a 10.8% CAGR over the assessment period, reinforced by public-service cloud policy and security review. The United Kingdom is forecast to achieve a 10.5% CAGR between 2026 and 2036, shaped by widespread cloud use and financial-services oversight. United States demand is expected to record a 10.3% CAGR across the forecast horizon, attributable to deep cloud usage and engineering cost ownership.
How does the Cloud FinOps Market break down by segment?
Software is projected to account for 43.4% share; Cloud deployment is estimated to garner 44.6% share.
Which Component dominates?
Software is set to lead with 43.4% share in 2026
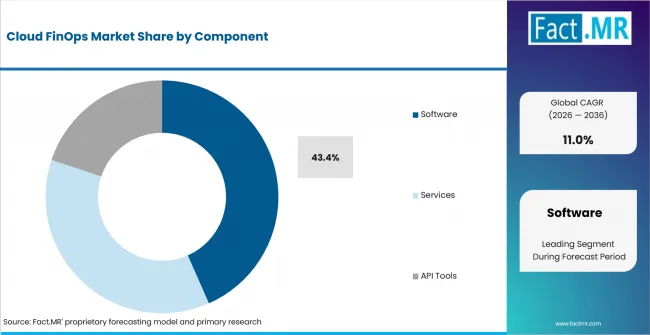
Cloud Finops Market Analysis By Component | Source: Fact.MR
Software is expected to represent 43.4% share in 2026 because enterprises need persistent allocation and optimization logic across recurring cloud consumption. Services remain relevant during operating-model design and complex implementation work that requires stakeholder alignment across finance and engineering teams. API Tools support internal integrations where engineering teams need cost data inside deployment and service-management systems. In February 2025, the FinOps Foundation reported a 20% increase in Investment and Tooling needs among surveyed practitioners. That shift supports software demand where teams need repeatable analysis and automation after implementation work is complete.
What leads the Deployment segment?
Cloud is estimated to garner 44.6% share in 2026.
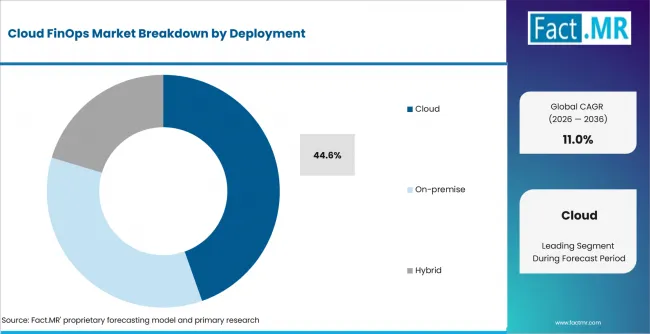
Cloud Finops Market Analysis By Deployment | Source: Fact.MR
Cloud deployment is anticipated to capture 44.6% share in 2026 owing to faster setup across managed billing data and cost telemetry. On-premise deployments serve organizations that keep financial data and governance workflows inside tightly controlled operating environments. Hybrid deployment supports multi-cloud management needs where teams compare public-cloud charges with internal infrastructure costs under one governance model. In January 2026, Eurostat reported that 28.18% of EU enterprises using paid cloud services purchased computing power for their own software. That usage pattern creates recurring cost records that cloud-native FinOps products can collect and analyze without separate data movement.
How does Organization Size shape demand?
SME is anticipated to record 48.0% share in 2026.
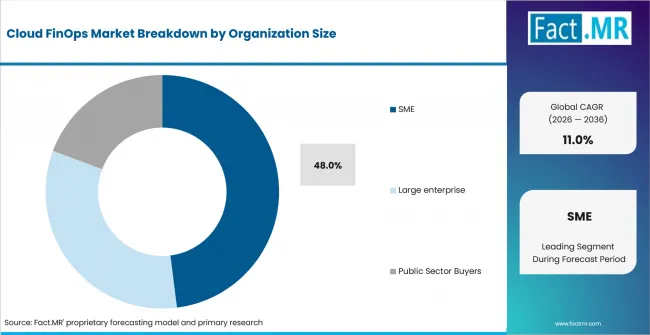
Cloud Finops Market Analysis By Organization Size | Source: Fact.MR
SMEs are forecast to hold 48.0% share in 2026 due to growing access to packaged cost dashboards and guided optimization workflows. Large enterprises require deeper chargeback structures and policy controls across many business units and shared platform teams. Public Sector Buyers need traceable allocation rules that support budget review and procurement oversight across regulated cloud programs. In January 2026, Eurostat reported that 49.3% of small EU enterprises used paid cloud computing services during 2025. The installed base gives self-service FinOps products a practical route into smaller organizations without large central cost-management teams.
What supports Workflow Automation within Application?
Workflow Automation is forecast to capture 40.3% share in 2026.
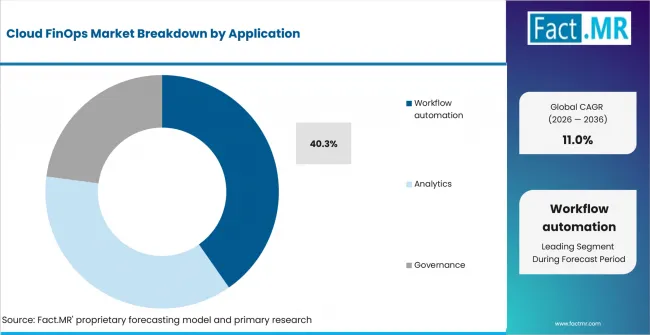
Cloud Finops Market Analysis By Application | Source: Fact.MR
Workflow automation is estimated to represent 40.3% share in 2026 due to the need for cost signals inside routine engineering decisions. Analytics remains relevant for budget trends and unit-cost interpretation across services where finance teams need consistent planning inputs. Governance supports policy enforcement when allocation rules and approval controls must stay consistent across many cloud accounts. In February 2025, the FinOps Foundation reported that 16% of practitioners planning FOCUS use expected manual data analysis. Related application transformation programs increase the value of repeatable cost checks during continuing architecture changes across services and development portfolios.
Why does BFSI stand out within End Use?
BFSI is expected to represent 36.5% share in 2026.
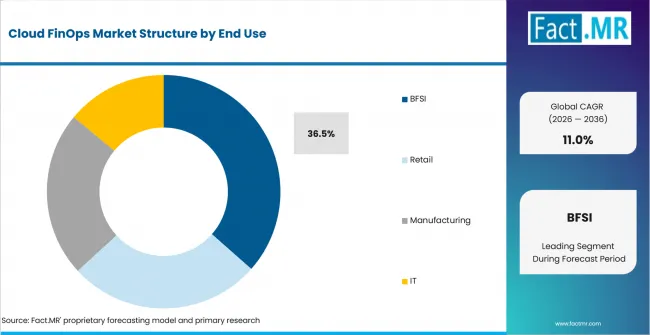
Cloud Finops Market Analysis By End Use | Source: Fact.MR
BFSI is projected to account for 36.5% share in 2026 because financial institutions need traceable cost ownership across regulated technology estates. Retail users focus on seasonal workload efficiency and unit economics across customer-facing platforms with changing transaction volumes. Manufacturing teams need allocation across plant systems and shared enterprise platforms while IT providers manage customer-specific service costs. In November 2024, the Bank of England reported that the three most common cloud providers represented 73% of named cloud providers. That concentration supports independent cost analysis where regulated firms need scenario planning across contractual and architecture commitments.
What is accelerating Cloud FinOps Market adoption, and what is holding it back?
Cost allocation automation drives it; inconsistent metadata restrains it.
Drivers Impact Analysis
| DRIVER | (~) % IMPACT ON CAGR | GEOGRAPHIC RELEVANCE | IMPACT TIMELINE |
|---|---|---|---|
| Multicloud cost allocation | +1.4% | Global enterprise estates | Medium term (2-4 years) |
| Workload optimization programs | +1.1% | North America and Europe | Short term (<= 2 years) |
| AI and SaaS spend extension | +0.9% | Global technology users | Medium term (2-4 years) |
| FOCUS data standardization | +0.7% | North America, Europe and Asia Pacific | Medium term (2-4 years) |
| Engineering workflow accountability | +0.6% | Cloud-native organizations | Long term (>= 4 years) |
Source: Fact.MR analysis. Updated Jul 9, 2026
- Multicloud cost allocation: Enterprises are extending FinOps beyond invoice review toward allocation across products and shared services. The mechanism depends on normalized billing data and clear ownership rules that remain consistent across accounts and shared infrastructure. In February 2025, the FinOps Foundation reported that workload optimization remained a priority for 50% of surveyed practitioners. Demand is expected to favor platforms that connect allocation accuracy with remediation workflows across engineering teams and financial planning cycles.
- Workload optimization programs: Engineering teams need cost signals that arrive while resource choices remain easy to change. Rightsizing and commitment decisions become more useful when cost data is connected to workload context and accountable service ownership. In February 2026, Eurostat reported that 52.7% of EU enterprises used paid cloud services during 2025. Adoption is projected to widen as more operating teams manage variable infrastructure bills through accountable service ownership models.
- AI and SaaS spend extension: FinOps teams are taking responsibility for technology costs that sit outside traditional cloud provider invoices. Usage-based AI services create new unit measures and shared-cost attribution problems across models and customer-facing products using common infrastructure. In February 2026, the FinOps Foundation reported that 98% of practitioners manage AI spend across their technology portfolios. Platform demand is anticipated to expand where cloud and AI cost controls share one allocation model.
- FOCUS data standardization: Common billing schemas reduce translation work when cost data comes from different technology providers. Standardization improves reporting consistency and lowers the burden on internal pipelines that combine billing exports from several providers. In February 2025, the FinOps Foundation reported that 57% of respondents planned to use FOCUS across cost-management data workflows. Platform integration is estimated to accelerate where normalized datasets reduce manual mapping work across provider and service billing structures.
- Engineering workflow accountability: Cloud-native teams need cost context inside deployment and operations workflows that already manage service reliability and release decisions. Cost ownership becomes actionable when engineers see anomalies and unit changes near the code or service involved. In April 2025, the Cloud Native Computing Foundation reported that one-quarter of surveyed organizations used cloud-native techniques for nearly all development and deployment. FinOps automation is forecast to move closer to engineering control points as that operating model spreads.
Opportunity Impact Analysis
| OPPORTUNITY | (~) % IMPACT ON CAGR | GEOGRAPHIC RELEVANCE | IMPACT TIMELINE |
|---|---|---|---|
| AI unit economics | +0.8% | United States and Asia Pacific | Medium term (2-4 years) |
| SaaS and licensing governance | +0.6% | North America and Europe | Medium term (2-4 years) |
| SME self-service FinOps | +0.5% | Europe and Asia Pacific | Long term (>= 4 years) |
| Hybrid technology allocation | +0.4% | Australia, UK and regulated users | Medium term (2-4 years) |
Source: Fact.MR analysis. Updated Jul 9, 2026
- AI unit economics: AI cost management creates room for FinOps platforms that attribute spend to models and business outcomes. Teams need a common view across infrastructure and inference charges before finance leaders compare product economics or budget performance. In April 2026, the International Energy Agency reported that global data-center electricity demand increased 17% during 2025. Opportunity is projected to expand where platforms connect technical consumption with product-level cost measures before teams scale new AI workloads.
- SaaS and licensing governance: Technology finance teams are broadening cost responsibility into software contracts and licensing portfolios. The commercial opening is strongest where one governance model tracks ownership and supports reliable commitment forecasts. In February 2026, the FinOps Foundation reported that 64% of practitioners manage licensing spend across broader technology cost responsibilities. Providers are anticipated to gain account depth when they support cost categories beyond infrastructure billing.
- SME self-service FinOps: Smaller organizations need fast setup and guided cost action without a large specialist team. Packaged workflows shorten the path from billing connection to usable accountability without requiring a large central FinOps function. In March 2025, the Office for National Statistics reported that 69% of UK firms had adopted cloud-based systems or applications in 2023. Self-service products are expected to address a broader installed base as cloud use becomes routine.
- Hybrid technology allocation: Organizations running mixed estates need cost views that compare public cloud services and internal infrastructure. Allocation rules must remain auditable while data sources use different accounting structures across cloud services and internally operated infrastructure. In September 2025, the U.S. Census Bureau reported that 59% of businesses rated cloud technology as very important to their processes or methods. Demand is estimated to expand for platforms that connect operational context with financial reporting across hybrid technology investment decisions.
Restraints Impact Analysis
| RESTRAINT | (~) % IMPACT ON CAGR | GEOGRAPHIC RELEVANCE | IMPACT TIMELINE |
|---|---|---|---|
| Metadata and allocation quality | -0.7% | Global multicloud estates | Medium term (2-4 years) |
| Skills and operating-model gaps | -0.6% | SME and federated teams | Medium term (2-4 years) |
| Provider concentration exposure | -0.5% | BFSI and regulated industries | Long term (>= 4 years) |
| Integration and security burden | -0.4% | Government and regulated users | Short term (<= 2 years) |
Source: Fact.MR analysis. Updated Jul 9, 2026
- Metadata and allocation quality: Cost dashboards lose credibility when tags and account structures do not map cleanly to business ownership. Shared resources create persistent disputes over chargeback and unit economics when platform costs serve several products or business units. In February 2025, the FinOps Foundation reported that practitioners planned to increase effort across almost 12 capabilities on average. Adoption is projected to remain slower where teams cannot establish dependable allocation rules before adding automation.
- Skills and operating-model gaps: FinOps software needs clear ownership across finance and engineering functions that share responsibility for cost decisions and remediation. Tools alone do not resolve approval rights when budget ownership and engineering control remain organizationally separate. In December 2025, the FinOps Foundation reported that HSBC had expanded its full-time FinOps team to 44 practitioners. Implementation is anticipated to remain demanding where organizations lack specialist capacity or clear decision rights.
- Provider concentration exposure: Enterprises need independent visibility across cloud and model providers while commercial dependence remains concentrated. Cost optimization decisions face switching limits created by architecture and contractual commitments that restrict near-term workload movement between providers. In November 2024, the Bank of England reported that the main model-provider group represented 44% of named third-party model providers. Platform uptake is expected to depend on credible cross-provider normalization and scenario analysis that supports commitment and architecture choices.
- Integration and security burden: FinOps tools require access to billing exports and operational metadata across technology estates. Regulated organizations must evaluate data handling before extending integrations and automation permissions across cost and operations data sources. In February 2026, the Australian Signals Directorate reported that 70% of government entities performed supply-chain risk assessments during 2025. Deployment is forecast to take longer where vendor review and access controls require additional approval stages.
Which countries are scaling Cloud FinOps Market fastest?
India 12.8%; China 12.1%; Australia 10.8%; United Kingdom 10.5%; United States 10.3%.
Cloud FinOps Market is segmented into North America, Europe, Asia Pacific, Latin America, and the Middle East and Africa.
| COUNTRY | CAGR |
|---|---|
| India | 12.8% |
| China | 12.1% |
| Australia | 10.8% |
| United Kingdom | 10.5% |
| United States | 10.3% |
| Germany | 10.0% |
| Japan | 9.7% |
Source: Fact.MR analysis. Updated Jul 9, 2026
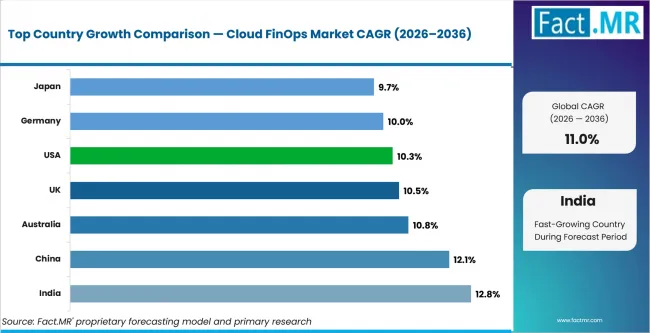
Cloud Finops Market Cagr Analysis By Country | Source: Fact.MR
Why is India building stronger Cloud FinOps demand?
12.8% CAGR, driven by software-sector scaling and distributed cloud engineering.
India’s expanding software delivery base is creating more fragmented cloud spending across enterprise technology teams and product engineering organizations. In January 2025, the Ministry of Electronics and Information Technology estimated 14.67 million digital-economy workers during 2022-23. Industry is projected to record a 12.8% CAGR during the forecast period as cost accountability expands across distributed engineering environments. FinOps providers gain stronger relevance when allocation controls help teams connect infrastructure consumption with service ownership and internal budget responsibility.
How is computing scale reshaping China's Cloud FinOps market?
12.1% CAGR, supported by computing-capacity expansion and large cloud operating environments.
Large computing estates are increasing the need for clearer cost attribution across China’s distributed technology infrastructure and enterprise workloads. In July 2024, the State Council reported that national plans targeted 300 EFLOPS of total computing power by 2025. Demand is estimated to post a 12.1% CAGR by 2036 as cost governance gains importance across expanding technology environments. Allocation platforms have a stronger commercial role where resource consumption records must connect with accountable business owners and operational teams.
Why is Australia creating new FinOps opportunities?
10.8% CAGR, reinforced by public-service technology maturity and cloud policy renewal.
Australia’s digital-service maturity is creating practical demand for transparent cloud spending controls across government agencies and enterprise technology operations. In December 2025, the Digital Transformation Agency reported a 98.5% score in the 2025 GovTech Maturity Index. Demand is anticipated to register a 10.8% CAGR over the assessment period as organizations require auditable cloud allocation practices. Providers can differentiate through governance tools that fit formal procurement structures and support recurring reviews across shared technology environments.
What is strengthening the United Kingdom FinOps outlook?
10.5% CAGR, shaped by widespread cloud use and regulated technology governance.
Cloud adoption across AI-using firms is giving United Kingdom organizations a broader foundation for connecting engineering ownership with financial control. In March 2025, the Office for National Statistics reported that 91% of AI-using firms also used cloud systems in its 2023 survey. Market in UK is forecast to record a 10.5% CAGR between 2026 and 2036 as FinOps practices connect budget controls with engineering accountability. AI workloads will deepen allocation requirements where shared platforms support multiple products and internal technology teams.
What gives the United States a strong FinOps foundation?
10.3% CAGR, attributable to deep cloud usage and engineering-led cost accountability.
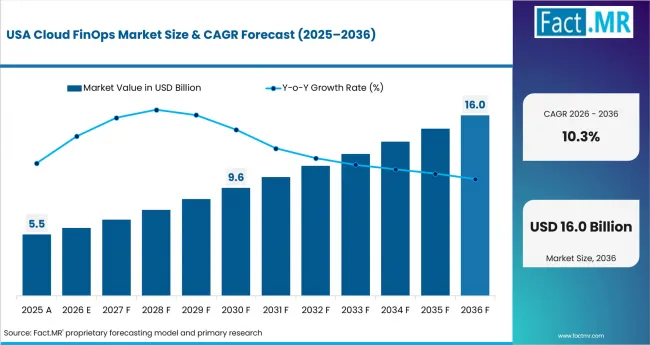
Cloud Finops Market Country Value Analysis | Source: Fact.MR
Enterprise cloud depth gives United States organizations a strong base for moving cost control closer to product and platform engineering teams. In September 2025, the U.S. Census Bureau reported that 51.8% of businesses adopting cloud technology cited improved process quality or reliability. Demand is expected to achieve a 10.3% CAGR across the forecast horizon as financial controls move closer to service ownership. Vendors gain account access when governance tools support engineering decisions without separating cost visibility from deployment and operating workflows.
Who leads the Cloud FinOps Market?
CloudHealth by Broadcom and Flexera / Spot also maintain active Cloud FinOps coverage.
IBM Apptio / IBM Cloudability connects cloud cost analysis with broader technology financial management through its current product portfolio. In June 2025, Broadcom announced a new CloudHealth experience that expanded reporting and AI-assisted features for enterprise FinOps teams. Flexera completed its acquisition of NetApp's Spot FinOps portfolio in March 2025 and began integrating those capabilities into Flexera One. These providers compete on allocation depth and automation across cloud managed services environments that require traceable cost ownership.
Harness introduced Cost Per Outcome analysis in May 2026 for agent runs and sessions alongside token-level cost measures. IBM documentation updated in February 2026 confirms that the former IBM Apptio Cloudability offering is now IBM Cloudability. AWS extended Cost Explorer forecasting to 18 months in November 2025 and added AI-powered forecast explanations in preview. Competition is expected to center on normalized allocation and workflow integration while native tools retain an advantage inside single-provider estates.
Which companies are the key providers?
IBM Apptio / IBM Cloudability, CloudHealth (Broadcom), Flexera / Spot, Harness, and AWS Cost Explorer.
- IBM Apptio / IBM Cloudability
- CloudHealth (Broadcom)
- Flexera / Spot
- Harness
- AWS Cost Explorer
Bibliography
- Amazon Web Services. (2025, November 19). AWS Cost Explorer now provides 18-month forecasting and AI-powered forecast explanations. Amazon Web Services.
- Australian Signals Directorate. (2026, February 12). The Commonwealth Cyber Security Posture in 2025. Australian Government.
- Bank of England. (2024, November 21). Artificial intelligence in UK financial services - 2024. Bank of England.
- Broadcom. (2025, June 2). Broadcom announces new CloudHealth user experience for greater cloud spend management across enterprise teams. Broadcom.
- Cloud Native Computing Foundation. (2025, April 1). Cloud Native 2024: Approaching a decade of code, cloud, and change. CNCF.
- Digital Transformation Agency. (2025, December 19). Australia earns global A-rank and Top 5 spot in digital transformation. Australian Government.
- Eurostat. (2026, January 13). Cloud computing - statistics on the use by enterprises. European Commission.
- FinOps Foundation. (2025, February). The State of FinOps Report 2025. FinOps Foundation.
- FinOps Foundation. (2026, February 19). A one-word change: How the FinOps community made our mission evolution inevitable. FinOps Foundation.
- Flexera. (2025, March 3). Flexera completes acquisition of NetApp’s Spot FinOps portfolio. Flexera.
- Google Cloud. (2026, June 29). Optimize costs with FinOps Hub. Google Cloud Documentation.
- Harness. (2026, May 28). Harness AI Cost Management May 28 release. Harness.
- IBM. (2026, February 16). IBM Cloudability SaaS. IBM Support.
- IBM. (2026, June 16). Apptio unveils Conversational Insights and new suite of AI-powered capabilities to translate complex technology spend into measurable business outcomes. IBM Newsroom.
- International Energy Agency. (2026, April 16). Data centre electricity use surged in 2025, even with tightening bottlenecks driving a scramble for solutions. IEA.
- Microsoft. (2025, June 27). Overview of Cost Management. Microsoft Learn.
- Ministry of Electronics and Information Technology. (2025, January). Estimation and Measurement of India’s Digital Economy. Government of India.
- Office for National Statistics. (2025, March 24). Management practices and the adoption of technology and artificial intelligence in UK firms: 2023. Office for National Statistics.
- State Council of the People’s Republic of China. (2024, July 7). China beefs up computing power as new economic catalyst. Government of China.
- U.S. Census Bureau. (2025, September 17). Census Bureau’s 2023 Annual Business Survey provides insight into technology adoption by businesses. U.S. Census Bureau.
This Report Addresses
- The report provides strategic intelligence across Component and Deployment choices that shape Cloud FinOps platform selection and operating-model design.
- Regional outlook evaluates India and China alongside Australia while the United Kingdom and United States complete the country comparison.
- Competitive analysis profiles IBM Apptio / IBM Cloudability and CloudHealth (Broadcom) alongside Flexera / Spot. The analysis also covers Harness alongside AWS Cost Explorer as active FinOps products or services in 2026.
- Component assessment covers Software and Services alongside API Tools that connect cost data to internal engineering and finance systems.
- Application assessment covers Workflow Automation and Analytics alongside Governance needs that shape recurring cost review and policy enforcement.
What does the Cloud FinOps Market cover?
Software, Services, API Tools, and workflow systems used for cloud cost allocation and governance.
The Cloud FinOps Market covers software and supporting services used to allocate and govern variable cloud spending across engineering and finance teams. Coverage includes workflow tools and APIs that connect billing data with ownership rules and optimization decisions.
General cloud management differs from this market because commercial value here is tied specifically to financial accountability and cost control. Observability or infrastructure-management products are excluded unless a defined module performs cloud cost allocation or governance functions.
What is included in the scope?
Cloud FinOps systems used in enterprise cost allocation, optimization, forecasting and policy workflows.
Scope includes Software and Services alongside API Tools that connect cloud billing data with internal operating systems. Deployment coverage spans Cloud and On-premise models together with Hybrid configurations used across different security and operating requirements. Organization Size analysis covers SME accounts and Large Enterprise users alongside Public Sector Buyers that apply distinct governance and procurement controls. Application coverage includes Workflow Automation and Analytics together with Governance functions used for recurring cost decisions and policy enforcement. End Use coverage evaluates BFSI and Retail users alongside Manufacturing and IT organizations with different accountability and workload patterns. The market boundary includes cloud cost visibility and allocation alongside forecasting and policy enforcement where these functions are sold as dedicated FinOps capabilities.
What is excluded from the scope?
General observability platforms and cloud infrastructure services without dedicated FinOps functions are outside the scope.
Monitoring products are excluded when they provide performance telemetry without cloud cost allocation or governance functions. Cloud hosting and managed infrastructure services are also excluded unless the commercial offering contains a separately defined FinOps capability used for cost control.
How was the analysis built?
120+ sources, 30+ company portfolios, 19+ countries, 40+ interviews.
- Primary Research: Primary research includes interviews with cloud FinOps practitioners, cloud operations managers, technology procurement leaders and enterprise IT decision-makers. It also includes input from cloud architects, managed service providers, FinOps consultants and cloud platform specialists involved in optimizing cloud spending, governance and resource utilization.
- Desk Research: Desk research reviews cloud adoption statistics, enterprise IT spending trends, cloud provider documentation, FinOps framework resources and company product portfolios. Industry publications, cloud cost management reports, technology announcements and provider capability updates are also assessed to evaluate market trends and competitive positioning.
- Market-Sizing and Forecasting: Forecasting uses cloud infrastructure spending, multi-cloud adoption trends, enterprise digital transformation activity, FinOps platform deployment rates and cloud cost optimization initiatives across major regions. Models consider consumption-based pricing, workload migration patterns, governance requirements, automation adoption and demand for cloud financial management solutions.
- Data Validation and Update Cycle: Forecasts are validated through provider checks and industry interviews that test assumptions on cloud spending behavior, FinOps adoption and enterprise optimization priorities. Portfolio mapping, end-user assessment and stakeholder feedback help confirm market direction, while ongoing reviews of cloud platform developments, pricing changes and enterprise investment activity support forecast updates.
Segmentation
What is the report’s scope and coverage?
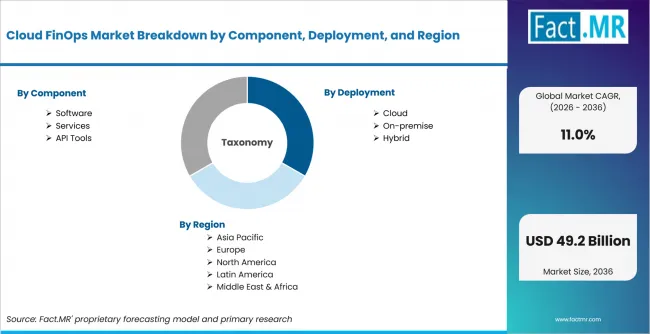
Cloud Finops Market Breakdown By Component, Deployment, And Region | Source: Fact.MR
| Attribute | Details |
|---|---|
| Quantitative Units | USD Billion |
| Market Definition | Software and services that allocate, analyze, forecast and govern cloud spending across engineering and finance workflows |
| Component | Software; Services; API Tools |
| Deployment | Cloud; On-premise; Hybrid |
| Organization Size | SME; Large Enterprise; Public Sector Buyers |
| Application | Workflow Automation; Analytics; Governance |
| End Use | BFSI; Retail; Manufacturing; IT |
| Regions Covered | North America; Europe; Asia Pacific; Latin America; Middle East and Africa |
| Countries Covered | United States; Canada; Germany; United Kingdom; France; Italy; Spain; India; China; Japan; South Korea; Australia; Brazil; Argentina; Mexico; Chile; UAE; Saudi Arabia; South Africa |
| Key Companies Profiled | IBM Apptio / IBM Cloudability; CloudHealth (Broadcom); Flexera / Spot; Harness; AWS Cost Explorer |
| Forecast Period | 2026 to 2036 |
| Approach | Hybrid top-down and bottom-up approach using cloud adoption activity; billing-data complexity; FinOps capability adoption; workload optimization cycles; deployment preferences; provider validation |
Source: Fact.MR analysis. Updated Jul 9, 2026
How is the market segmented?
-
By Component
- Software
- Services
- API Tools
-
By Deployment
- Cloud
- On-premise
- Hybrid
-
By Organization Size
- SME
- Large Enterprise
- Public Sector Buyers
-
By Application
- Workflow Automation
- Analytics
- Governance
-
By End Use
- BFSI
- Retail
- Manufacturing
- IT
-
By Region
- North America
- United States
- Canada
- Europe
- Germany
- United Kingdom
- France
- Italy
- Spain
- Asia Pacific
- India
- China
- Japan
- South Korea
- Australia
- Latin America
- Brazil
- Argentina
- Mexico
- Chile
- Middle East & Africa
- UAE
- Saudi Arabia
- South Africa
- North America
Frequently Asked Questions
What share is software expected to capture within component demand?
How is cloud positioned across deployment demand?
Which organization type is projected to hold the primary share?
What supports workflow automation within the application split?
How much share is BFSI estimated to capture in 2026?
How quickly is India expected to expand?
Which factor is shaping China’s growth pace?
What supports Australia’s projected outlook?
How is United Kingdom procurement demand developing?
What underpins United States market expansion?
What is the primary adoption driver?
Which issue most constrains platform deployment?
Why does Workflow Automation carry commercial weight?
What makes Banking, Financial Services, and Insurance (BFSI) a commercially relevant buyer group?
Who worked on this report


Preview the report firsthand - request a free sample
Free SampleGet the brochure for pricing and purchase details
Download PDF