- Market Value (2025): USD 28.4 Bn
- Estimated Value (2026): USD 29.8 Bn
- Forecast Value (2036): USD 48.5 Bn
- CAGR (2026-2036): 5.0%
What is the Connective Tissue Disease Market forecast to be worth by 2036?
USD 29.8 billion in 2026 to USD 48.5 billion by 2036 at 5.0% CAGR.
- The connective tissue disease market reached USD 28.4 billion in 2025 as treated autoimmune demand stayed concentrated in specialist care.
- Demand is projected to increase from USD 29.8 Billion in 2026 to USD 48.5 billion by 2036.
- The market is forecast to record 5.0% CAGR from 2026 to 2036 owing to earlier disease control and broader access to targeted therapy.
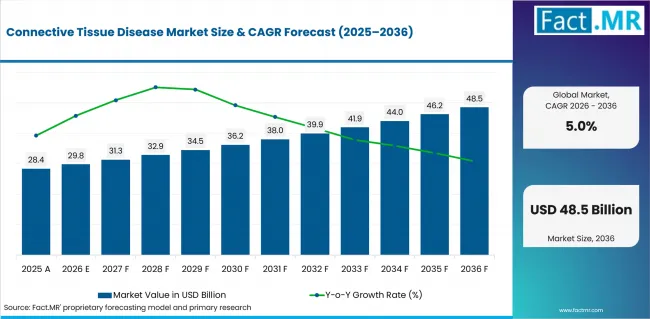
Connective Tissue Disease Market Value Analysis | Source: Fact.MR
What are the defining numbers behind Connective Tissue Disease Market growth?
USD 18.7 Billion absolute opportunity by 2036.
- Demand Drivers in the Market
- Rheumatologists are expected to treat earlier when persistent inflammation threatens joint or organ function.
- Biologics and targeted therapies support switching demand when conventional treatment fails to control symptoms.
- Hospital teams remain central because infusion and safety checks often need specialist oversight.
- Key Segments Analyzed
- By Disease Type: Rheumatoid Arthritis is expected to hold 36.0% share in 2026 because it has an established treatment pathway and recurring therapy needs.
- By Treatment Type: Biologics is projected to account for 34.0% share in 2026 as specialists use targeted mechanisms after inadequate control with conventional therapy.
- By End User: Hospitals are anticipated to capture 39.0% share in 2026 since complex autoimmune disease often requires infusion capacity and specialist review.
- By Distribution Channel: Hospital Pharmacies are estimated to hold 42.0% share in 2026 as institutional dispensing fits monitored therapy workflows.
- Analyst Opinion at Fact.MR
- Shambhu Nath Jha, Principal Consultantat Fact.MR, states, “Connective tissue disease suppliers must prove more than product availability. Evidence quality and access support decide whether therapies move from approval into sustained use across hospital and specialty settings.”
- Strategic Implications
- Hospitals should pair early disease control with monitoring capacity before expanding formularies.
- Manufacturers can reduce access friction through patient training and refill support.
- Investors should separate direct autoimmune therapy exposure from discovery-stage ideas.
Germany is expected to record a 5.9% CAGR from 2026 to 2036. Brazil follows at 5.6% through protocol-led access. Canada is forecast at 5.3% with specialist care and reimbursement review. The USA is projected to grow at 5.0% through broad therapy choice. Australia is estimated at 4.7% as organized specialist pathways support use. The UK is anticipated to reach 4.3% through guidance-led prescribing. Japan is forecast at 3.8% with regulated review and cautious post-approval use.
How does the Connective Tissue Disease Market break down by segment?
Rheumatoid Arthritis leads Disease Type at 36.0% share in 2026. Biologics lead Treatment Type at 34.0%.
Why does Rheumatoid Arthritis lead Disease Type?
Rheumatoid Arthritis is projected to account for 36.0% share in 2026.
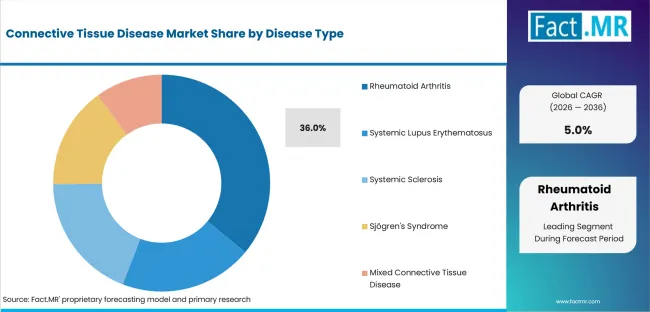
Connective Tissue Disease Market Analysis By Disease Type | Source: Fact.MR
Rheumatoid arthritis leads because patients often need long-term disease-modifying therapy and repeated response checks. Seropositive and seronegative forms support ongoing diagnosis and monitoring.
What makes Biologics the leading Treatment Type?
Biologics are expected to hold 34.0% share in 2026.
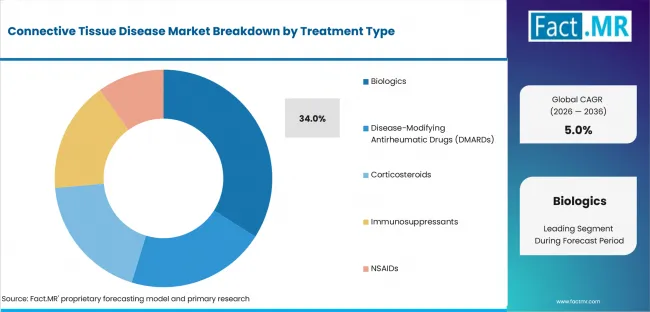
Connective Tissue Disease Market Analysis By Treatment Type | Source: Fact.MR
Biologics lead when conventional DMARDs do not deliver adequate control or cannot be tolerated. TNF and interleukin inhibitors give physicians defined immune targets.
How do Hospitals shape End User demand?
Hospitals are anticipated to represent 39.0% share in 2026.
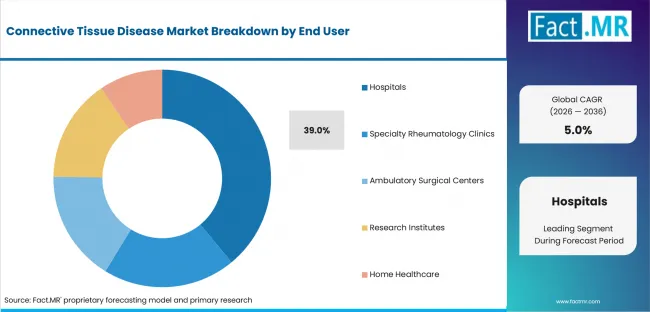
Connective Tissue Disease Market Analysis By End User | Source: Fact.MR
Hospitals anchor demand because infusion and organ assessment must be coordinated. Specialty clinics extend follow-up after complex treatment decisions are made.
Why do Hospital Pharmacies lead Distribution Channel?
Hospital Pharmacies are estimated to account for 42.0% share in 2026.
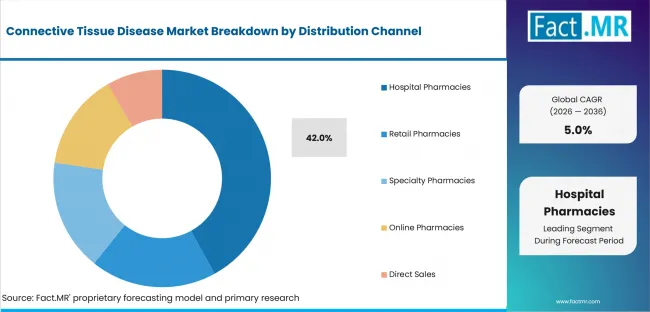
Connective Tissue Disease Market Analysis By Distribution Channel | Source: Fact.MR
Hospital pharmacies lead because many therapies require screening and safety documentation. Retail pharmacies remain relevant for oral and self-administered formats.
What supports Monoclonal Antibodies within Drug Class?
Monoclonal Antibodies remain the most commercially visible Drug Class.
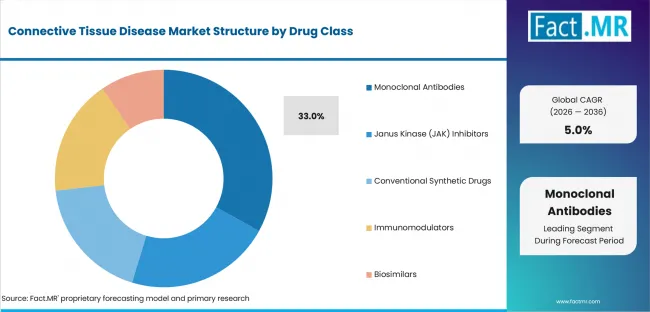
Connective Tissue Disease Market Analysis By Drug Class | Source: Fact.MR
Monoclonal antibodies are used when targeted immune pathway control is required. JAK inhibitors remain part of the universe but safety review can narrow use.
What is accelerating Connective Tissue Disease Market adoption, and what is holding it back?
Demand is expected to rise through earlier disease treatment and targeted therapies. Growth may be limited by safety checks and reimbursement delays.
Drivers Impact Analysis
| DRIVER | (~) % IMPACT ON CAGR | GEOGRAPHIC RELEVANCE | IMPACT TIMELINE |
|---|---|---|---|
| Early disease control and switching demand | +1.4% | Germany, USA, UK | Short term (<= 2 years) |
| Biologic and targeted therapy use | +1.1% | USA, Germany, Japan | Medium term (2-4 years) |
| Hospital-led infusion and monitoring | +0.9% | Brazil, Canada, Australia | Short term (<= 2 years) |
| Specialty access and authorization support | +0.7% | USA, UK, Canada | Medium term (2-4 years) |
| Biosimilar and administration-route options | +0.6% | Germany and Brazil | Long term (>= 4 years) |
Source: Fact.MR analysis. Updated Aug 4, 2026
- Early disease control and switching demand: Specialists are expected to escalate treatment when persistent inflammation threatens structural or organ damage.
- Biologic and targeted therapy use: Mechanism-specific therapy is likely to support treatment selection after conventional drugs fail to deliver control.
- Hospital-led infusion and monitoring: Institutional treatment settings are expected to remain important where screening affects safety.
Opportunity Impact Analysis
| OPPORTUNITY | (~) % IMPACT ON CAGR | GEOGRAPHIC RELEVANCE | IMPACT TIMELINE |
|---|---|---|---|
| Subcutaneous and self-administration formats | +0.8% | USA and Western Europe | Medium term (2-4 years) |
| Biosimilar switching frameworks | +0.6% | Germany and Brazil | Medium term (2-4 years) |
| Specialty-pharmacy training models | +0.5% | USA and Canada | Long term (>= 4 years) |
| Indication expansion in lupus and Sjogren disease | +0.4% | USA and Japan | Long term (>= 4 years) |
Source: Fact.MR analysis. Updated Aug 4, 2026
- Subcutaneous and self-administration formats: Home-use formats are expected to reduce infusion burden for selected maintenance patients.
- Biosimilar switching frameworks: Biosimilar contract manufacturing can support access when switching rules protect physician oversight.
- Specialty-pharmacy training models: Training support is likely to improve adherence when patients move from infusion to self-administered therapy.
Restraints Impact Analysis
| RESTRAINT | (~) % IMPACT ON CAGR | GEOGRAPHIC RELEVANCE | IMPACT TIMELINE |
|---|---|---|---|
| Safety screening and labeling review | -0.8% | USA, UK | Short term (<= 2 years) |
| Reimbursement and continuation criteria | -0.7% | Germany, Brazil, Canada | Medium term (2-4 years) |
| Infusion-capacity and monitoring burden | -0.5% | Hospitals and specialty clinics | Medium term (2-4 years) |
| Diagnostic delay and referral friction | -0.4% | Brazil and Australia | Long term (>= 4 years) |
Source: Fact.MR analysis. Updated Aug 4, 2026
- Safety screening and labeling review: Physicians must weigh infection risk and patient history before escalating therapy.
- Reimbursement and continuation criteria: Payer rules can slow escalation when inadequate response must be documented first.
- Infusion-capacity and monitoring burden: Hospitals may delay wider use when staffing and observation capacity are stretched.
Which countries are scaling Connective Tissue Disease Market fastest?
- Germany leads the country comparison, supported by biosimilar review and specialist prescribing. Brazil follows through public access and institutional purchasing, while Canada benefits from steady specialist care and reimbursement review.
- The USA holds the middle position through broad therapy choice and specialty channels. Australia and the UK grow through controlled reimbursement and guidance-led prescribing.
- Japan records the lowest CAGR because local review and post-approval use create a more cautious commercial path.
The full report provides country-level CAGR analysis across North America and Latin America. It also covers Western Europe and Eastern Europe. East Asia and South Asia and Pacific are included. The Middle East and Africa completes the regional view.
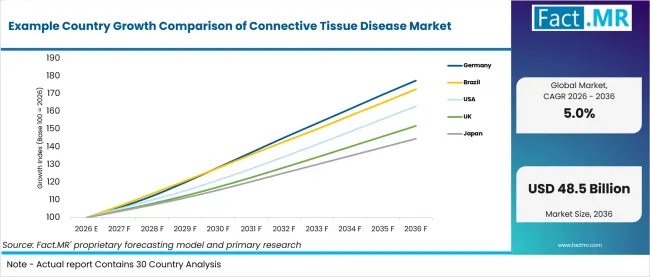
Example Country Growth Comparison Of Connective Tissue Disease Market | Source: Fact.MR
| Country | CAGR (2026-2036) |
|---|---|
| Germany | 5.9% |
| Brazil | 5.6% |
| Canada | 5.3% |
| USA | 5.0% |
| Australia | 4.7% |
| UK | 4.3% |
| Japan | 3.8% |
Source: Fact.MR analysis. Updated Aug 4, 2026
What supports Germany adoption?
5.9% CAGR, supported by biosimilar review and specialist-prescribing discipline.
German uptake is expected to move through specialist practices and payer review around originator and biosimilar therapy. Suppliers need clear continuity support before wider switching gains acceptance.
How is Brazil scaling demand?
5.6% CAGR, driven by protocol-led access and institutional purchasing.
Brazilian demand is shaped by public-sector protocols and institutional purchasing. Providers that support tender supply and patient follow-up are better placed in hospital-led channels.
What supports Canada outlook?
5.3% CAGR, backed by specialist care and reimbursement review.
Canada is expected to build demand through specialist prescribing and provincial reimbursement review. Specialty pharmacies improve continuity when patients need training and benefit coordination.
How is USA demand developing?
5.0% CAGR, led by broad therapy choice and specialty-channel management.
The USA offers broad therapy choice but requires careful navigation of labeling and prior authorization. Access support is expected to influence account retention.
What shapes Australia growth route?
4.7% CAGR, supported by organized specialist pathways and reimbursement fit.
Australia is expected to grow through a smaller but organized treatment environment. Adoption depends on specialist assessment and practical access after approval.
How does the UK market perform?
4.3% CAGR, tied to guidance-led prescribing and local commissioning.
The UK market is shaped by specialist services and national recommendations. Hospital pharmacies remain important because complex therapy requires screening and continuation evidence.
What explains Japan measured growth?
3.8% CAGR, guided by regulated review and cautious post-approval use.
Japan follows a careful adoption path through local review and physician experience with new autoimmune therapies. Companies need dependable medical support before broader specialist use develops.
Who leads the Connective Tissue Disease Market?
F. Hoffmann-La Roche Ltd. and Pfizer show strong relevance through autoimmune and rheumatoid arthritis franchises. AbbVie and Johnson & Johnson strengthen the same treated-population base. AstraZeneca and Amgen extend the field through targeted assets. Sanofi supports immunology coverage. Novartis, Bristol Myers Squibb and Eli Lilly and Company add further autoimmune positions.
F. Hoffmann-La Roche Ltd. supports demand through lupus nephritis and biologic experience. Pfizer and AbbVie maintain autoimmune portfolio depth. Johnson & Johnson adds specialist-channel reach. AstraZeneca and Sanofi broaden the field through targeted immunology positions. Novartis and Bristol Myers Squibb add further autoimmune coverage. Amgen and Eli Lilly and Company complete the provider view.
From 2026 to 2036, competition is expected to depend on evidence quality and reimbursement fit. Providers that combine clinical evidence with patient training may gain stronger demand from hospitals and specialty rheumatology clinics.
Which companies are the key providers?
Key companies include F. Hoffmann-La Roche Ltd.; Pfizer; Johnson & Johnson; AbbVie; Eli Lilly and Company; Novartis; Bristol Myers Squibb; AstraZeneca; Amgen; Sanofi.
- F. Hoffmann-La Roche Ltd.
- Pfizer
- Johnson & Johnson
- AbbVie
- Eli Lilly and Company
- Novartis
- Bristol Myers Squibb
- AstraZeneca
- Amgen
- Sanofi
Bibliography
- Centers for Disease Control and Prevention. (2025, June 25). Arthritis. National Center for Health Statistics.
- F. Hoffmann-La Roche Ltd. (2025, October 20). FDA approves Roche’s Gazyva/Gazyvaro for the treatment of lupus nephritis.
- Johnson & Johnson. (2025, August 28). Phase 2a DAISY proof-of-concept combination study update.
- Novartis AG. (2026, January 16). Novartis ianalumab receives FDA Breakthrough Therapy designation for Sjögren’s disease.
This Report Answers
- The report provides strategic intelligence on Disease Type and Treatment Type choices that shape autoimmune therapy demand.
- Segment analysis covers Rheumatoid Arthritis and Biologics as the share leaders within the 2026 market.
- Country outlook evaluates Germany and Brazil alongside Canada and the USA. Australia, the UK and Japan complete the growth comparison.
- Competitive analysis profiles F. Hoffmann-La Roche Ltd. and Pfizer alongside Johnson & Johnson and AbbVie. Eli Lilly and Company and Novartis complete the provider set. Bristol Myers Squibb and AstraZeneca appear alongside Amgen and Sanofi.
- Channel assessment covers Hospitals and Hospital Pharmacies alongside specialty rheumatology clinics and retail pharmacies.
What does the Connective Tissue Disease Market cover?
Prescription therapies are used to manage autoimmune and inflammatory conditions where connective tissue involvement can affect joints and skin as well as blood vessels or organs.
The Connective Tissue Disease Market covers therapies used across rheumatoid arthritis and systemic lupus erythematosus treatment. Coverage extends to seropositive and seronegative rheumatoid arthritis where treatment response guides long-term medication use.
What is included in the scope?
Connective tissue disease therapies are used across hospitals, specialty rheumatology clinics and pharmacies.
The scope includes Disease Type and Treatment Type alongside End User, Distribution Channel and Drug Class. Coverage spans Rheumatoid Arthritis and Biologics. Hospital Pharmacies and monoclonal antibodies complete the main commercial view.
What is excluded from the scope?
Diagnostic testing, surgical intervention and rehabilitation services remain outside the scope of this market.
The scope excludes imaging and laboratory tests. Consultation fees, surgery and devices are excluded. General wellness products are not counted. Adjacent rare-disease therapy access remains outside the revenue boundary.
How Was the Analysis Built?
The analysis draws on 120+ sources, 35+ company portfolios, 25+ countries, and more than 20 industry interviews.
- Primary Research: Primary research includes discussions with manufacturers, service providers, technology developers, distributors, end users, procurement teams, and subject-matter experts. These conversations examine purchasing priorities, product adoption, operational challenges, approval requirements, competitive positioning, and the factors that influence wider market acceptance.
- Desk Research: Desk research covers government statistics, regulatory publications, company filings, trade data, technical studies, industry associations, standards, public policy, and other authoritative sources. Every source used in the analysis is documented in the bibliography.
- Market Sizing and Forecasting: Market estimates combine historical performance, demand indicators, pricing and volume trends, segment shares, company participation, country-level growth, adoption patterns, investment activity, and barriers to market expansion.
- Data Validation and Update Cycle: Findings are validated by comparing primary interviews with public data, company activity, regulatory changes, trade patterns, and industry developments. Regular updates review new product launches, capacity changes, partnerships, approvals, procurement trends, and shifts in commercial adoption.
Segmentation
What is the report’s scope and coverage?
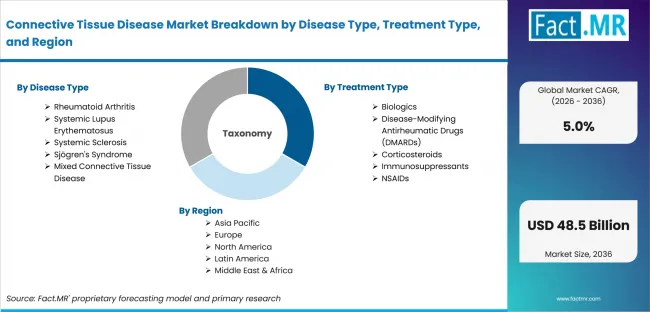
Connective Tissue Disease Market Breakdown By Disease Type, Treatment Type, And Region | Source: Fact.MR
| Attribute | Details |
|---|---|
| Quantitative Units | USD billion |
| Market Definition | Prescription therapy revenue for connective tissue diseases across the defined disease, treatment, end-user, channel and drug-class universe. Diagnostics, surgery, rehabilitation and devices are excluded. |
| Disease Type | Rheumatoid Arthritis; Seropositive Rheumatoid Arthritis; Seronegative Rheumatoid Arthritis; Systemic Lupus Erythematosus |
| Treatment Type | Biologics; TNF Inhibitors; IL Inhibitors; Disease-Modifying Antirheumatic Drugs (DMARDs) |
| End User | Hospitals; Public Hospitals; Private Hospitals; Specialty Rheumatology Clinics |
| Distribution Channel | Hospital Pharmacies; Inpatient Pharmacies; Outpatient Hospital Pharmacies; Retail Pharmacies |
| Drug Class | Monoclonal Antibodies; Anti-TNF Antibodies; Anti-IL Antibodies; Janus Kinase (JAK) Inhibitors |
| Regions Covered | North America; Latin America; Western Europe; Eastern Europe; East Asia; South Asia and Pacific; Middle East and Africa |
| Countries Covered | Germany; Brazil; Canada; USA; Australia; UK; Japan |
| Key Companies Profiled | F. Hoffmann-La Roche Ltd.; Pfizer; Johnson & Johnson; AbbVie; Eli Lilly and Company; Novartis; Bristol Myers Squibb; AstraZeneca; Amgen; Sanofi |
| Forecast Period | 2026 to 2036 |
| Approach | Hybrid top-down and bottom-up approach using treated populations, therapy mix, dosing, net sales, channel allocation, reimbursement conditions, safety review, adoption patterns and company portfolios |
Source: Fact.MR analysis. Updated Aug 4, 2026
How is the market segmented?
-
By Disease Type:
- Rheumatoid Arthritis
- Seropositive Rheumatoid Arthritis
- Seronegative Rheumatoid Arthritis
- Systemic Lupus Erythematosus
- Cutaneous Lupus
- Systemic Lupus
- Systemic Sclerosis
- Limited Cutaneous Systemic Sclerosis
- Diffuse Cutaneous Systemic Sclerosis
- Sjögren's Syndrome
- Primary Sjögren's Syndrome
- Secondary Sjögren's Syndrome
- Mixed Connective Tissue Disease
- Anti-U1 RNP Positive
- Overlap Syndrome
- Rheumatoid Arthritis
-
By Treatment Type:
- Biologics
- TNF Inhibitors
- IL Inhibitors
- Disease-Modifying Antirheumatic Drugs (DMARDs)
- Conventional DMARDs
- Targeted Synthetic DMARDs
- Corticosteroids
- Oral Corticosteroids
- Injectable Corticosteroids
- Immunosuppressants
- Calcineurin Inhibitors
- Antimetabolites
- NSAIDs
- Selective NSAIDs
- Non-Selective NSAIDs
- Biologics
-
By End User:
- Hospitals
- Public Hospitals
- Private Hospitals
- Specialty Rheumatology Clinics
- Outpatient Rheumatology Clinics
- Autoimmune Disease Centers
- Ambulatory Surgical Centers
- Day Care Centers
- Specialty Infusion Centers
- Research Institutes
- Academic Research Centers
- Clinical Research Organizations
- Home Healthcare
- Home Infusion Services
- Remote Patient Care
- Hospitals
-
By Distribution Channel:
- Hospital Pharmacies
- Inpatient Pharmacies
- Outpatient Hospital Pharmacies
- Retail Pharmacies
- Chain Pharmacies
- Independent Pharmacies
- Specialty Pharmacies
- Biologic Drug Pharmacies
- Rare Disease Pharmacies
- Online Pharmacies
- E-Commerce Pharmacies
- Digital Prescription Platforms
- Direct Sales
- Manufacturer Supply Agreements
- Institutional Procurement
- Hospital Pharmacies
-
By Drug Class:
- Monoclonal Antibodies
- Anti-TNF Antibodies
- Anti-IL Antibodies
- Janus Kinase (JAK) Inhibitors
- JAK1 Inhibitors
- Pan-JAK Inhibitors
- Conventional Synthetic Drugs
- Methotrexate
- Hydroxychloroquine
- Immunomodulators
- B-Cell Modulators
- T-Cell Modulators
- Biosimilars
- Biosimilar Monoclonal Antibodies
- Biosimilar Fusion Proteins
- Monoclonal Antibodies
-
By Region:
- North America
- Latin America
- Western Europe
- Eastern Europe
- East Asia
- South Asia and Pacific
- Middle East and Africa
Frequently Asked Questions
Which Disease Type leads the market?
Which Treatment Type leads the market?
Which End User leads the market?
Which Distribution Channel leads the market?
Which Drug Class is most commercially visible?
Which country records the highest listed CAGR?
What is the primary driver in this market?
What is the main restraint?
Why do hospitals lead demand?
Who worked on this report


Preview the report firsthand - request a free sample
Free SampleGet the brochure for pricing and purchase details
Download PDF