- Market Value (2025): USD 459.0 Mn
- Estimated Value (2026): USD 482.2 Mn
- Forecast Value (2036): USD 782.0 Mn
- CAGR (2026-2036): 5.2%
What is the Creamed Honey Market forecast to be worth by 2036?
USD 482.2 million in 2026 to USD 782.0 million by 2036, at a 5.2% CAGR.
- The market reached USD 458.4million in 2025.
- Demand is projected to increase from USD 482.2 million in 2026 to USD 782.0 million by 2036.
- The market is forecast to record a 5.2% CAGR from 2026 to 2036, creating an absolute opportunity of USD 299.9 million.
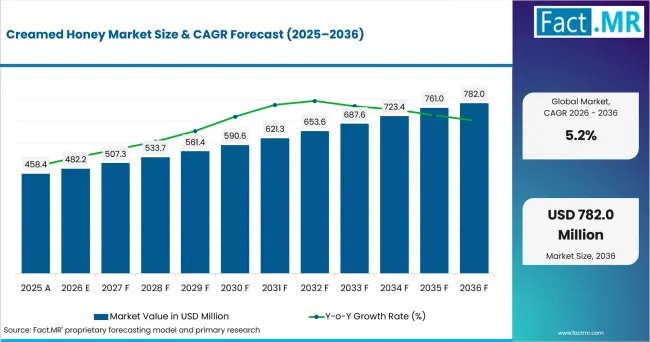
Creamed Honey Market Value Analysis | Source: Fact.MR
What are the defining numbers behind Creamed Honey Market growth?
USD 299.9 million absolute opportunity is expected between 2026 and 2036.
- Demand Drivers in the Market
- Creamed honey demand is supported by spreadable texture, controlled crystallization, and easier use on bread as well as breakfast foods as well as desserts and hot drinks.
- Packaging matters because retail buyers need containers that protect texture, reduce leakage, show origin information and fit supermarket shelves.
- Supermarkets and hypermarkets help the category by giving shoppers space to compare regular honey, creamed honey, manuka-style products as well as local honey and premium imported varieties.
- Supply is affected by honey harvest variability, bee health, imports as well as authenticity concerns and country-of-origin labelling expectations.
- Key Segments Analyzed
- By Type: Bottle is the leading type, accounting for 29.4% share in 2026.
- By Application: Hypermarkets and Supermarkets leads with 47.4% share in 2026.
- Analyst Opinion at Fact.MR
- Creamed honey is not bought only on sweetness. The advantage is its spreadable texture, clean use, and premium feel. Retail buyers want packaging that protects texture and communicates origin clearly, while consumers want a honey format that behaves more predictably than runny honey. Suppliers gain preference when they combine source transparency, texture consistency, and shelf-ready packaging rather than relying only on broad natural-sweetener claims. Shambhu Nath Jha, Principal Consultant, Fact.MR.
- Strategic Implications
- Buyers should match packaging to use occasion, since bottle, jar as well as tube and tub formats serve different retail and foodservice needs.
- Suppliers can differentiate with source transparency, crystallization control, and clear origin or floral-type communication.
- Retail planning should reflect the role of supermarkets in comparison shopping and premium honey discovery.
The UK records the highest country CAGR at 7.3%, followed by Australia at 6.0%. The USA is projected at 5.7%, while Canada advances at 5.5%. Germany is forecast to expand at 5.0% through 2036.
How does the Creamed Honey Market break down by segment?
Bottle leads Type with 29.4% share and Hypermarkets and Supermarkets leads Application with 47.4% share in 2026.
Why does Bottle lead Type?
Bottle is projected to account for 29.4% share in 2026.
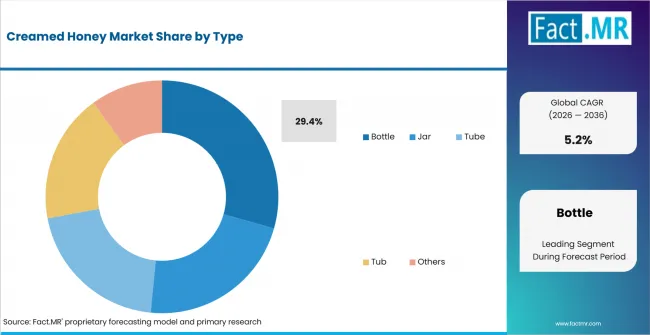
Creamed Honey Market Analysis By Type | Source: Fact.MR
Bottle leads because creamed honey needs packaging that protects texture and supports easy use. The format gives brands more room for origin, floral source, and quality cues than small single-serve packs. In contrast, remaining practical for everyday use. For a product where texture is the selling point, the container has to reduce mess, support portion control and preserve the spreadable structure through retail storage.
Why does Hypermarkets and Supermarkets lead Application?
Hypermarkets and Supermarkets is projected to account for 47.4% share in 2026.
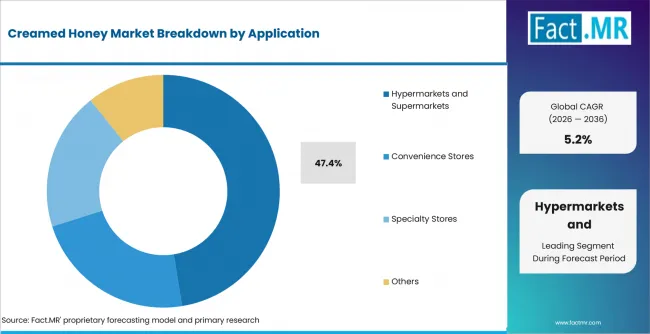
Creamed Honey Market Analysis By Application | Source: Fact.MR
Hypermarkets and supermarkets lead because creamed honey depends on visible comparison. Shoppers compare regular honey, creamed honey, local jars as well as imported honey as well as manuka-style products and private-label alternatives side by side. Large-format retail also supports premium packaging and origin-led positioning, which matter more for creamed honey than for commodity sweeteners.
What is accelerating Creamed Honey Market adoption, and what is holding it back?
Adoption is helped by the move from commodity honey toward texture, origin, and pack convenience. Restraints come from supply variability, price sensitivity, authenticity concerns and the need to keep crystallization controlled after packing.
Drivers Impact Analysis
| DRIVER | (~) % IMPACT ON CAGR | GEOGRAPHIC RELEVANCE | IMPACT TIMELINE |
|---|---|---|---|
| Texture-led differentiation | +1.3% | UK, Australia and USA | Short term (<= 2 years) |
| Retail visibility | +1.0% | UK, Australia and USA | Short term (<= 2 years) |
| Premium positioning | +0.8% | USA, Canada and Germany | Medium term (2-4 years) |
| Breakfast and bakery use | +0.6% | Canada, Germany and UK | Medium term (2-4 years) |
Source: Fact.MR analysis. Updated Aug 5, 2026
- Texture-led differentiation: Creamed honey offers a spreadable format that can justify shelf distinction from liquid honey.
- Retail visibility: Supermarkets let consumers compare source, price, and pack format at the point of purchase.
- Premium positioning: Local, floral, and origin-linked claims create room for higher-value products.
- Breakfast and bakery use: Creamed honey works well as a spread, topping, and ingredient where drip control matters.
Opportunity Impact Analysis
| OPPORTUNITY | (~) % IMPACT ON CAGR | GEOGRAPHIC RELEVANCE | IMPACT TIMELINE |
|---|---|---|---|
| Origin and sourcing differentiation | +0.9% | Global sourcing and import-dependent markets | Medium term (2-4 years) |
| Premium retail shelf expansion | +0.7% | UK, Australia and USA | Medium term (2-4 years) |
| Foodservice bulk formats | +0.5% | UK, Australia and USA | Long term (>= 4 years) |
Source: Fact.MR analysis. Updated Aug 5, 2026
- Suppliers can build stronger packs around origin, floral source, texture and responsible sourcing.
- Retailers can use creamed honey to widen premium spread and breakfast shelves.
- Foodservice tubs and larger jars can serve bakeries, cafes, and breakfast operators.
Restraints Impact Analysis
| RESTRAINT | (~) % IMPACT ON CAGR | GEOGRAPHIC RELEVANCE | IMPACT TIMELINE |
|---|---|---|---|
| Harvest variability | -0.9% | UK, Australia and USA | Short term (<= 2 years) |
| Authenticity and origin concerns | -0.7% | Australia, USA and Canada | Short term (<= 2 years) |
| Crystallization-control risk | -0.6% | Established and price-sensitive markets | Medium term (2-4 years) |
Source: Fact.MR analysis. Updated Aug 5, 2026
- Honey harvests vary with weather, forage conditions, pests and bee health.
- Authenticity and origin concerns can make buyers cautious, especially in import-heavy markets.
- Poor crystallization control can damage the product experience and reduce repeat purchase.
Which countries are scaling the Creamed Honey Market fastest?
Country growth rates differ from the global 5.2% CAGR. The UK, Australia, USA and Canada sit above the global rate. In contrast, Germany is slightly below it. These rates describe forecast pace; they do not make every country’s honey supply or retail structure identical.
- The UK leads the country set at 7.3% CAGR.
- Australia follows at 6.0% CAGR.
- The USA records 5.7% CAGR.
- Canada advances at 5.5% CAGR.
- Germany expands at 5.0% CAGR.
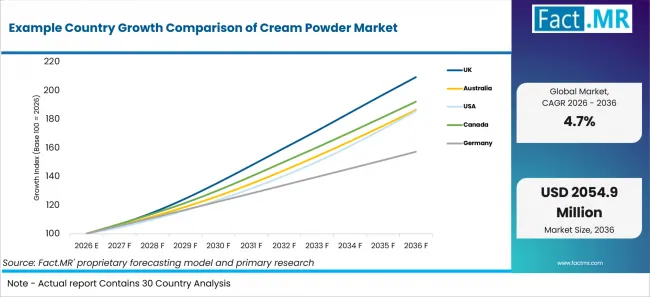
Example Country Growth Comparison Of Cream Powder Market | Source: Fact.MR
| COUNTRY | CAGR, 2026 to 2036 |
|---|---|
| UK | 7.3% |
| Australia | 6.0% |
| USA | 5.7% |
| Canada | 5.5% |
| Germany | 5.0% |
Source: Fact.MR analysis. Updated Aug 5, 2026
What is driving the UK's growth through 2036?
7.3% CAGR through 2036.
The UK grows fastest because creamed honey fits a retail environment where shoppers pay attention to origin, authenticity, and convenient spread formats. GOV.UK import guidance for honey and apiculture products shows the product sits within a controlled food-import route, while Defra’s food statistics show the importance of organised grocery and food retail in UK food purchasing. For creamed honey, this creates room for supermarket-led differentiation around source, texture and bottle or jar convenience.
What is driving Australia's growth through 2036?
6.0% CAGR through 2036.
Australia’s growth is supported by an established honey-bee sector and consumer familiarity with local honey. AHBIC reported registered hive numbers of 823,291 as of December 2024, despite pressure from varroa in some regions. That supply backdrop matters because creamed honey benefits from local and regional origin stories. The format also works for breakfast spreads and pantry use, where controlled texture and simple packaging can encourage repeat purchase.
What is driving the USA's growth through 2036?
5.7% CAGR through 2036.
The USA grows above the global rate, but supply pressure shapes the market. USDA NASS reported that U.S. honey production fell to 116 million pounds in 2025, down 14% from 2024, with fewer colonies producing honey. That creates pressure on commodity supply but also supports value-added formats such as creamed honey, where brands can compete on texture, source story and premium retail presentation rather than only on volume.
What is driving Canada's growth through 2036?
5.5% CAGR through 2036.
Canada’s growth is supported by a sizeable domestic honey base. Agriculture and Agri-Food Canada reported that the national number of honey bee colonies reached a record 854,653 in 2025, while honey production rose to 84.1 million pounds. This helps creamed honey suppliers build around domestic supply, regional identity, and supermarket packs. Growth is steadier than the UK because the category is closer to established honey consumption than a new retail discovery.
What is driving Germany's growth through 2036?
5.0% CAGR through 2036.
Germany grows close to the global rate because it is already part of a mature European honey market. The European Commission describes the EU as the second-largest honey producer after China and also a large net importer, with Germany among the leading EU producing countries. Creamed honey therefore has a clear base in retail and specialty stores, but growth is moderated by mature consumption habits, import competition and stronger scrutiny of honey origin and quality.
Who leads the Creamed Honey Market?
Capilano Honey is the largest named company in the assessed set, with 8.4% share. Other listed participants are Comvita, Dabur, Dutch Gold and Manuka Health.
Competition is shaped by source transparency, texture control, pack format as well as retailer access and trust. Buyers are likely to compare origin and consistency rather than rely only on broad honey branding.
Which companies are the key providers?
Key companies include Capilano Honey; Comvita; Dabur; Dutch Gold; Manuka Health; Bee Maid Honey; Anhui Mizhiyuan Group; Langnese; Barkman Honey; New Zealand Honey Co.; Nature Nate's; Rowse; Billy Bee Honey Products; Little Bee Impex; Heavenly Organics; Beeyond the Hive; Madhava Honey; Dalian Sangdi Honeybee; Hi-Tech Natural Products; Y.S. Organic Bee Farms.
- Capilano Honey
- Comvita
- Dabur
- Dutch Gold
- Manuka Health
- Bee Maid Honey
- Anhui Mizhiyuan Group
- Langnese
- Barkman Honey
- New Zealand Honey Co.
- Nature Nate's
- Rowse
- Billy Bee Honey Products
- Little Bee Impex
- Heavenly Organics
- Beeyond the Hive
- Madhava Honey
- Dalian Sangdi Honeybee
- Hi-Tech Natural Products
- Y.S. Organic Bee Farms
Bibliography
- Codex Alimentarius Commission. (1981). Standard for Honey (CXS 12-1981). FAO/WHO Codex Alimentarius.
- U.S. Department of Agriculture, National Agricultural Statistics Service. (2026, March 13). Honey. USDA NASS.
- Agriculture and Agri-Food Canada. (2026, May 4). Statistical overview of the Canadian honey and bee industry, 2025. Government of Canada.
- European Commission. (2026). Honey. Agriculture and Rural Development.
- European Commission. (2026). Honey market presentation. Agriculture and Rural Development.
- Department for Environment, Food & Rural Affairs. (2026). Food statistics in your pocket. GOV.UK.
- Department for Environment, Food & Rural Affairs and Animal and Plant Health Agency. (2025, April 25). Import of honey, royal jelly and other apiculture products for human consumption. GOV.UK.
- Australian Honey Bee Industry Council. (2025). 2025 Annual Report. AHBIC.
This Report Answers
- The report provides strategic intelligence on the Creamed Honey Market across Type and Application choices that shape pack-format selection and retail placement.
- Segment analysis identifies Bottle as the Type leader. The Hypermarkets and Supermarkets channel holds the leading Application share in 2026.
- Country outlook evaluates the UK and Australia alongside the USA and Canada. Germany completes the growth comparison across the profiled markets.
- Competitive analysis profiles Capilano Honey and Comvita alongside Dabur and Dutch Gold. Manuka Health completes the provider view.
- Channel assessment covers Hypermarkets and Supermarkets alongside Convenience Stores. Specialty Stores and other routes complete the view.
What does the Creamed Honey Market cover?
The market covers creamed honey products and related offerings across the defined type, application, and region categories. It includes spreadable honey formats made for retail, specialty, convenience and foodservice channels.
What is included in the scope?
The scope includes Bottle, Jar, Tube as well as Tub and other creamed honey formats across Hypermarkets and Supermarkets as well as Convenience Stores as well as Specialty Stores and other assessed channels.
What is excluded from the scope?
Products outside the defined creamed honey categories are excluded. Liquid honey, honey blends not positioned as creamed honey, syrups as well as artificial sweeteners and unrelated spreads are not counted within this scope.
How Was the Analysis Built?
The analysis combines structured desk research, company and product mapping, expert validation. Demand-side checks across major regions.
- Primary Research: Interviews with buyers, suppliers, beekeeping-sector participants as well as retailers and channel specialists test purchasing criteria as well as origin expectations as well as adoption barriers and repeat-purchase behavior.
- Desk Research: Public honey production data, import rules, quality standards as well as retail evidence as well as company literature and trade information establish market boundaries and demand context.
- Market Sizing and Forecasting: Demand indicators, channel intensity, pack participation and supplier mapping are reconciled across top-down and bottom-up views.
- Data Validation and Update Cycle: Findings are cross-checked across independent evidence routes and reviewed when material market, regulatory, or company changes occur.
Segmentation
What is the report's scope and coverage?
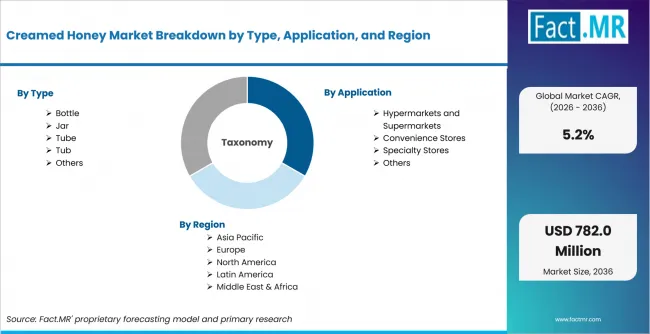
Creamed Honey Market Breakdown By Type, Application, And Region | Source: Fact.MR
| Attribute | Details |
|---|---|
| Quantitative Units | USD million in 2026 to USD million by 2036, at a CAGR |
| Market Definition | Creamed Honey products and related offerings across the assessed categories |
| Type | Bottle; Jar; Tube; Tub; Others |
| Application | Hypermarkets and Supermarkets; Convenience Stores; Specialty Stores; Others |
| Regions Covered | North America; Latin America; Europe; East Asia; South Asia & Oceania; Middle East & Africa |
| Countries Covered | UK; Australia; USA; Canada; Germany |
| Key Companies Profiled | Capilano Honey; Comvita; Dabur; Dutch Gold; Manuka Health; Bee Maid Honey; and others |
| Forecast Period | 2026 to 2036 |
| Approach | Hybrid top-down and bottom-up market assessment |
Source: Fact.MR analysis. Updated Aug 5, 2026
How is the market segmented?
-
By Type:
- Bottle
- Jar
- Tube
- Tub
- Others
-
By Application:
- Hypermarkets and Supermarkets
- Convenience Stores
- Specialty Stores
- Others
-
By Region:
- North America
- USA
- Canada
- Latin America
- Europe
- Germany
- UK
- East Asia
- South Asia & Oceania
- Australia
- Middle East & Africa
- North America
Frequently Asked Questions
How big is the Creamed Honey Market in 2026?
What is the CAGR of the Creamed Honey Market from 2026 to 2036?
Which type leads the Creamed Honey Market?
How much will the Creamed Honey Market add between 2026 and 2036?
Who are the leading companies in the Creamed Honey Market?
Who worked on this report


Preview the report firsthand - request a free sample
Free SampleGet the brochure for pricing and purchase details
Download PDF