- Market Value (2025): USD 13.6 Bn
- Estimated Value (2026): USD 15.8 Bn
- Forecast Value (2036): USD 72.1 Bn
- CAGR (2026-2036): 16.4%
What is the DC Fast Charging Market forecast to be worth by 2036?
USD 15.8 billion in 2026 to USD 72.1 billion by 2036 at 16.4% CAGR.
- The DC fast charging market crossed USD 13.6 billion in 2025 as charging networks and fleet operators expanded high-power sites.
- Demand is projected to increase from USD 15.8 billion in 2026 to USD 72.1 billion by 2036.
- The market is forecast to record 16.4% CAGR from 2026 to 2036 due to public charging expansion and higher-power charger specifications.
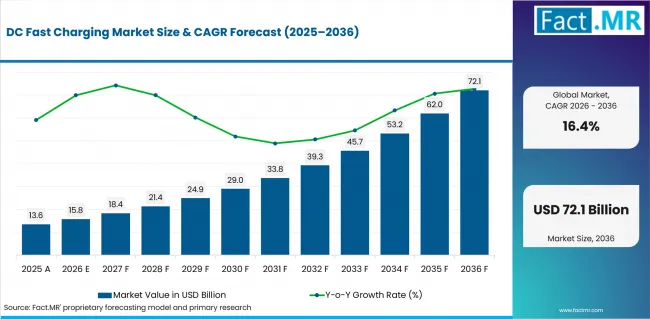
Dc Fast Charging Market Value Analysis | Source: Fact.MR
What are the defining numbers behind DC Fast Charging Market growth?
USD 56.3 billion absolute opportunity by 2036, led by Ultra-Fast DC Chargers and Public Charging Stations. Charging Network Operators and CCS connectors complete the main share view.
- Demand Drivers in the Market
- Ultra-fast charger specifications are expected to guide site approvals where operators need shorter stops and higher daily charger turnover.
- Public charging stations remain the clearest deployment case since highway and urban users need visible fast-charging access.
- Fleet electrification is anticipated to raise demand for depot and corridor charging that fits buses and commercial vans.
- Network operators are expected to prioritize uptime proof and payment reliability before expanding charger orders across more sites.
- Key Segments Analyzed
- By Product Type: Ultra-Fast DC Chargers (150 kW & Above) are expected to hold 37.5% share in 2026 since charging speed directly affects site productivity.
- By Application: Public Charging Stations are projected to account for 30.3% share in 2026 where broad user access is the main deployment need.
- By End User: Charging Network Operators are anticipated to capture 30.6% share in 2026 through control over station placement and maintenance response.
- By Distribution Channel: Direct Sales are estimated to represent 30.8% share in 2026 as large buyers prefer direct technical review before rollout.
- By Connector Type: CCS (Combined Charging System) is forecast to hold 36.4% share in 2026 as public and fleet sites need broad vehicle compatibility.
- Analyst Opinion at Fact.MR
- Shambhu Nath Jha, Senior Analyst at Fact.MR, states, “DC fast charging suppliers are being judged less on peak charger rating alone and more on how each site performs after installation. Buyers want power delivery and service coverage to be clear before they approve wider network deployment.”
- Strategic Implications
- Charging network teams can focus on sites with clear grid access and suitable connectors. This supports wider electric vehicle charging deployment.
- Suppliers need to explain installation risks clearly. This helps buyers assess smart grid equipment used to manage charging loads.
- Investors need to separate charger hardware from battery and storage businesses. Energy storage adds value when it improves uptime or lowers power costs.
The USA is expected to record a 21.4% CAGR from 2026 to 2036 through charging-network depth and direct procurement activity. Japan is projected to post 19.7% CAGR as public charging reliability shapes demand. Germany is anticipated to grow at 18.1% through network expansion and industrial charging needs. The UK is estimated to reach 16.4% through uptime review and life-cycle cost checks. Canada is forecast at 14.8%. Australia is projected to reach 13.1% and Brazil is expected to post 11.5% during the same period.
How does the DC Fast Charging Market break down by segment?
Ultra-Fast DC Chargers (150 kW & Above) are expected to lead Product Type at 37.5% share in 2026. Public Charging Stations are projected to lead Application at 30.3% share in 2026.
Why do Ultra-Fast DC Chargers (150 kW & Above) lead Product Type?
Ultra-Fast DC Chargers (150 kW & Above) are projected to account for 37.5% share in 2026
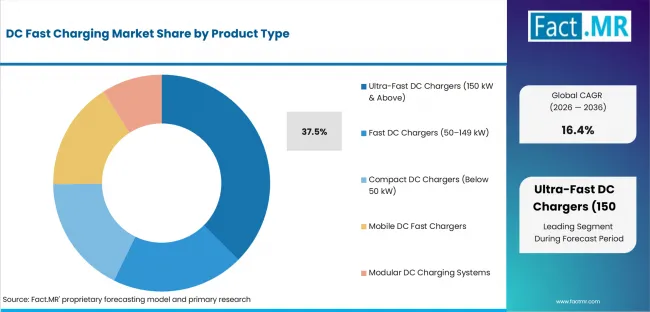
Dc Fast Charging Market Analysis By Product Type | Source: Fact.MR
These chargers are favored where site owners need more completed sessions from limited space. 150-250 kW Chargers and Above 250 kW Chargers remain important in higher-capacity corridors. Fast DC Chargers (50-149 kW) retain demand where connection cost limits higher-power rollout.
What keeps Public Charging Stations ahead in Application?
Public Charging Stations are expected to hold 30.3% share in 2026.
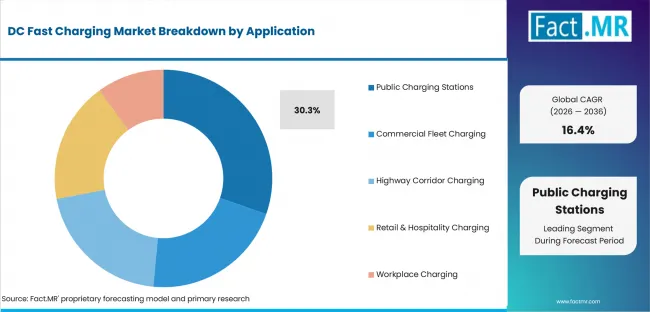
Dc Fast Charging Market Analysis By Application | Source: Fact.MR
Public charging stations carry the main access role for drivers who cannot rely only on home or depot charging. Highway Charging Stations support longer trips and route confidence. Urban Public Charging Hubs and Commercial Fleet Charging expand where operators can balance utilization with site power limits.
How do Charging Network Operators shape End User demand?
Charging Network Operators are anticipated to lead with 30.6% share in 2026.
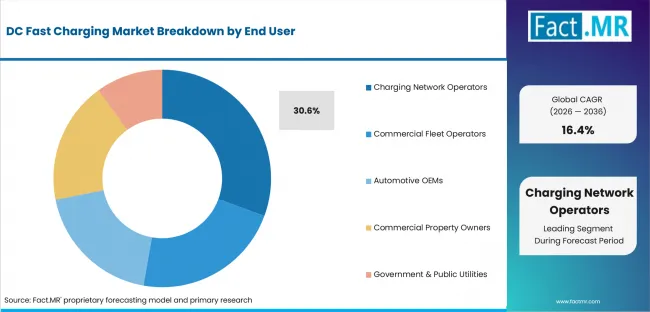
Dc Fast Charging Market Analysis By End User | Source: Fact.MR
Charging network operators control station placement and maintenance response across public charging assets. Public Charging Operators and Private Charging Operators compete where access models differ. Commercial Fleet Operators remain a clear demand base when depot schedules require predictable charging windows.
What supports Direct Sales within Distribution Channel?
Direct Sales are estimated to represent 30.8% share in 2026.
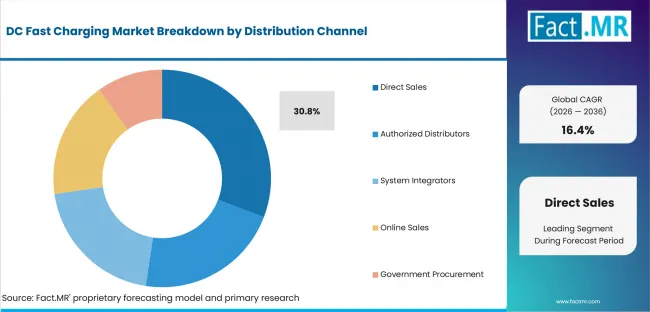
Dc Fast Charging Market Analysis By Distribution Channel | Source: Fact.MR
Direct sales help buyers review charger capacity and warranty responsibility with fewer handoffs. OEM Sales and Project-Based Sales remain useful for bundled infrastructure programs. Authorized Distributors retain demand where local stock and service access decide replacement timing.
Why does CCS (Combined Charging System) hold the Connector Type lead?
CCS (Combined Charging System) is forecast to account for 36.4% share in 2026.
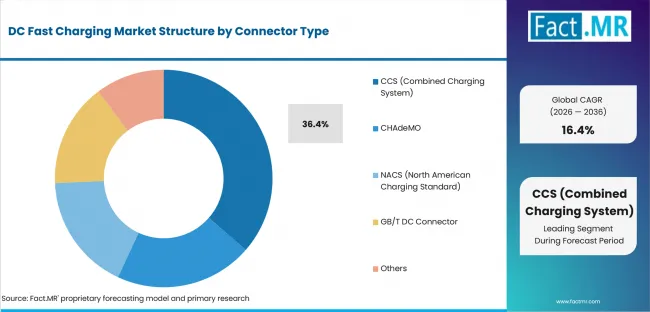
Dc Fast Charging Market Analysis By Connector Type | Source: Fact.MR
CCS is supported by broad use across public charging sites and many vehicle platforms. CCS1 and CCS2 address different regional specifications. CHAdeMO retains a place in selected legacy fleets as new sites review connectors through compatibility and upgrade needs.
What is accelerating DC Fast Charging Market adoption, and what is holding it back?
Demand will grow with ultra-fast chargers and wider public charging. High grid connection costs and charger reliability issues may slow adoption.
Drivers Impact Analysis
| DRIVER | QUALITATIVE RELEVANCE | GEOGRAPHIC RELEVANCE | IMPACT TIMELINE |
|---|---|---|---|
| Ultra-fast charger specification pull | High | USA, Japan, Germany | Short term (<= 2 years) |
| Public charging station duty expansion | High | USA, Japan, UK | Short term (<= 2 years) |
| Fleet and highway corridor buildout | High | USA, Canada, Australia | Medium term (2-4 years) |
| Connector standardization and interoperability | High | North America and Europe | Medium term (2-4 years) |
| Service uptime and payment reliability | High | Network-led charging markets | Long term (>= 4 years) |
Source: Fact.MR analysis. Updated Jul 29, 2026
- Ultra-fast charger specification pull: Higher charger ratings are expected to improve site throughput where drivers value shorter stops. Buyers still need clear power-delivery proof before they approve premium hardware.
- Public charging station duty expansion: Public sites create repeated charging occasions that support charger utilization. Operators are likely to favor systems that combine fast sessions with dependable service response.
- Fleet and highway corridor buildout: Fleet depots and corridor sites require charging plans that match vehicle schedules. Suppliers can gain preference when they show how equipment fits dwell time and route planning.
- Connector standardization and interoperability: Connector clarity lowers the risk that public sites become difficult to use across vehicle types. This improves buyer confidence when station owners plan multi-brand access.
- Service uptime and payment reliability: Uptime evidence is expected to matter more as networks scale. Poor recovery processes can reduce repeat usage even when charger power ratings look attractive.
Opportunity Impact Analysis
| OPPORTUNITY | QUALITATIVE RELEVANCE | GEOGRAPHIC RELEVANCE | IMPACT TIMELINE |
|---|---|---|---|
| Highway corridor charger upgrades | High | USA, Canada, Australia | Medium term (2-4 years) |
| Fleet depot charging packages | High | USA, UK, Germany | Medium term (2-4 years) |
| Service and inspection contracts | Moderate | Japan and Europe | Medium term (2-4 years) |
| Grid-ready modular cabinets | Moderate | Large public networks | Long term (>= 4 years) |
Source: Fact.MR analysis. Updated Jul 29, 2026
- Highway corridor charger upgrades: Corridor locations can convert demand when they reduce range anxiety and maintain reliable turnover. Operators need equipment packages that fit utility connection limits.
- Fleet depot charging packages: Depot charging creates a repeat-use opening where buyers control vehicle return times. Packaged chargers and maintenance support can shorten approval when responsibility is clear.
- Service and inspection contracts: Managed service models can make larger networks easier to operate. Buyers are likely to value planned maintenance when charger availability affects customer satisfaction.
- Grid-ready modular cabinets: Modular cabinets can support staged capacity additions at growing sites. This opportunity is strongest when buyers can add power without rebuilding the full station layout.
Restraints Impact Analysis
| RESTRAINT | QUALITATIVE RELEVANCE | GEOGRAPHIC RELEVANCE | IMPACT TIMELINE |
|---|---|---|---|
| Grid connection and site power cost | High | Global | Short term (<= 2 years) |
| Site engineering and permitting cycles | High | USA, Germany, UK | Short term (<= 2 years) |
| Payment reliability and uptime risk | Moderate | Public charging networks | Medium term (2-4 years) |
| Connector transition uncertainty | Selective | North America and East Asia | Long term (>= 4 years) |
Source: Fact.MR analysis. Updated Jul 29, 2026
- Grid connection and site power cost: High-power charging can require upgrades before equipment is installed. This raises approval time when operators cannot confirm power availability early.
- Site engineering and permitting cycles: Each location has its own civil work and electrical design needs. Smaller operators may delay orders until installation scope becomes clearer.
- Payment reliability and uptime risk: Public charging demand weakens when drivers cannot trust session starts. Network owners therefore compare support terms before expanding equipment orders.
- Connector transition uncertainty: Connector shifts can complicate asset planning. Buyers may stage purchases until vehicle mix and adapter availability become easier to evaluate.
Which countries are scaling DC Fast Charging Market fastest?
The country comparison is shaped by how quickly charging networks can move from site approval to dependable daily operation. The USA and Japan form the upper pair. Germany and the UK remain close behind them. Canada and Australia are slightly lower because distance and service coverage add execution pressure. Brazil shows a gradual route as operators balance charging access with financing and local support.
- The USA records the highest CAGR since network operators can combine corridor charging with fleet demand and direct supplier engagement.
- Japan remains close to the USA where public charging reliability and compact site execution carry more weight in buyer approval.
- Germany follows through network planning and industrial charging needs where buyers expect clear technical documentation.
- The UK stays near the global rate as charging providers compare installation cost and life-cycle value.
- Canada and Australia develop through long-distance charging needs where service coverage can decide supplier preference.
- Brazil grows from a lower base as regional distributors and financing comfort shape adoption timing.
Comparable CAGRs can still produce different market entry conditions across these countries. Deployment timing depends on grid access and service depth. The ability to keep public chargers available after installation shapes the final route.
The full report provides country-level CAGR analysis across North America and Latin America. Europe and East Asia are covered. South Asia and Oceania are reviewed alongside the Middle East and Africa.
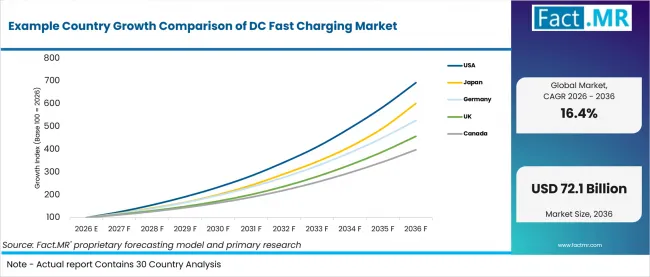
Example Country Growth Comparison Of Dc Fast Charging Market | Source: Fact.MR
| Country | CAGR (2026-2036) |
|---|---|
| USA | 21.4% |
| Japan | 19.7% |
| Germany | 18.1% |
| UK | 16.4% |
| Canada | 14.8% |
| Australia | 13.1% |
| Brazil | 11.5% |
Source: Fact.MR analysis. Updated Jul 29, 2026
What supports USA adoption?
21.4% CAGR, supported by charging-network depth and direct procurement activity.
Charging providers in the USA must prove power delivery and service coverage before wider deployment. Highway corridors create demand for ultra-fast chargers that support repeated daily use. Fleet operators add a second path because depot charging needs predictable session timing before equipment orders move forward.
How is Japan building demand?
19.7% CAGR, driven by public charging reliability and compact site execution.
Japan’s demand is shaped by dense mobility patterns and careful approval of public charging sites. Operators place weight on charger uptime and compact footprints. Suppliers with dependable local service are better placed to convert public station plans into recurring charger orders.
What keeps Germany above the global rate?
18.1% CAGR, backed by network planning and industrial charging needs.
Germany is expected to build demand where commercial users need documented charger performance before expanding sites. Industrial buyers compare site power and maintenance support. Providers that explain installation planning clearly can reduce approval friction for high-power charging projects.
How does the UK convert public charging demand?
16.4% CAGR, led by uptime review and life-cycle cost checks.
The UK market stays close to the global rate because buyers are selective about charger economics. Public charging providers need equipment that performs consistently across busy urban and corridor sites. Proposals gain ground when service response and total operating cost are explained in plain terms.
What supports Canada’s charger rollout?
14.8% CAGR, supported by long-distance charging needs and service coverage.
Canada’s growth reflects demand across large travel distances where charger placement matters. Network owners value hardware that can serve corridors and commercial fleets. Suppliers with clear maintenance coverage are likely to stand out across dispersed locations.
How is Australia developing demand?
13.1% CAGR, backed by corridor charging and dependable supplier support.
Australia’s outlook is shaped by distance and site power availability. Charging providers favor systems that can operate reliably in corridor and metropolitan settings. Adoption improves when suppliers show how installation planning and support coverage reduce downtime risk.
What is shaping Brazil’s adoption path?
11.5% CAGR, driven by regional distribution and financing comfort.
Brazil’s growth is expected to move through public sites and commercial fleet needs. Buyers need confidence that charger supply and after-sale service can be maintained beyond major urban centers. Regional channels are likely to matter where financing and service access remain central concerns.
Who leads the DC Fast Charging Market?
ABB E-mobility and Siemens AG show direct relevance in the DC fast charging market. Tesla Inc. and ChargePoint Holdings Inc. strengthen the network and site-operation landscape.
ABB E-mobility supports high-power charging through its charger hardware and infrastructure experience. Siemens AG adds charging systems and grid expertise. Tesla Inc. contributes a large charging network and NACS influence. ChargePoint Holdings Inc. provides charging hardware and network software. Tritium, an Exicom company, Delta Electronics Inc., SK Signet and Alpitronic GmbH expand the DC fast charger market.
From 2026 to 2036, competition will depend on charger uptime and power performance. Buyers will compare warranties, maintenance support and installation needs before placing larger orders. Providers with reliable chargers and strong local service may gain more demand from charging networks and commercial site operators.
Which companies are the key providers?
Key companies include ABB E-mobility; Siemens AG; Tesla Inc.; ChargePoint Holdings Inc.; Tritium, an Exicom company; Delta Electronics Inc.; SK Signet; and Alpitronic GmbH.
- ABB E-mobility
- Siemens AG
- Tesla Inc.
- ChargePoint Holdings Inc.
- Tritium, an Exicom company
- Delta Electronics Inc.
- SK Signet
- Alpitronic GmbH
Bibliography
- U.S. Department of Transportation. (2025, January 10). Biden-Harris Administration announces $635 million in awards to continue expanding zero-emission EV charging and refueling infrastructure.
- U.S. Department of Energy. (2025, January 15). DOE invests $68 million in innovative heavy-duty electric vehicle charging solutions.
- ABB E-mobility. (2025, April 24). Unified architecture meets segment-specific needs as ABB E-mobility launches trio of new EV chargers.
- Siemens AG. (2025, October 4). SICHARGE FLEX: Siemens unveils next-generation EV charging system for the megawatt era.
This Report Answers
- The report provides strategic intelligence on the DC Fast Charging Market across Product Type and Application choices that shape public and fleet charging programs.
- Segment analysis covers Ultra-Fast DC Chargers and Public Charging Stations as the 2026 share leaders within the market structure.
- Country outlook evaluates the USA and Japan alongside Germany and the UK. Canada, Australia and Brazil complete the growth comparison across profiled markets.
- Competitive analysis profiles ABB E-mobility and Siemens AG alongside Tesla Inc. and ChargePoint Holdings Inc. Tritium, an Exicom company and Delta Electronics Inc. complete the core provider set with SK Signet and Alpitronic GmbH.
- Connector assessment covers CCS and NACS-related planning. CHAdeMO and GB/T systems remain part of the connector view where regional vehicle fleets require support.
What does the DC Fast Charging Market cover?
DC fast charging systems deliver high-power direct current to electric vehicle batteries where shorter charging time and reliable station performance support commercial use.
The DC Fast Charging Market covers the commercial supply and installation of high-power DC chargers across public stations, highway locations, fleet depots and commercial charging sites. Coverage includes ultra-fast chargers, compact DC chargers, mobile charging units and modular charging systems. It also includes power-sharing cabinets and expandable charging platforms. Connector coverage spans CCS, CHAdeMO, NACS, GB/T and other regional or proprietary formats.
The market differs from general electric vehicle charging because commercial value comes from faster charging sessions, higher site turnover and dependable charger uptime. Standard AC chargers remain outside the boundary. Home charging equipment is excluded unless it forms part of a commercial DC fast charging project. General grid equipment, battery systems and energy storage products are excluded unless they directly support charger installation, power delivery or site operation.
What is included in the scope?
DC fast charging systems are used by charging network operators, fleet companies, automotive manufacturers, property owners, public agencies and utilities.
The scope includes Product Type and Application alongside End User, Distribution Channel and Connector Type. Coverage spans ultra-fast, fast, compact, mobile and modular DC chargers. Applications include public stations, highway corridors, urban hubs, fleet depots, retail sites, hotels, workplaces and industrial campuses. Direct sales, distributors, system integrators, public tenders and utility contracts are included.
What is excluded from the scope?
AC charging equipment and unrelated electric vehicle infrastructure remain outside the scope of this market.
The scope excludes home AC chargers and low-power charging systems that do not deliver direct current to vehicle batteries. General electrical equipment, grid modernization projects and energy storage systems are excluded unless they directly support a DC fast charging site. Vehicle manufacturing revenue is not included unless it comes from charger hardware or charging-network operations. Unrelated civil construction, battery sales and payment software are also excluded unless they are bundled with charger deployment or site management.
How Was the Analysis Built?
The analysis draws on 120+ sources, 35+ company portfolios, 25+ countries, and more than 20 industry interviews.
- Primary Research: Primary research includes discussions with manufacturers, service providers, technology developers, distributors, end users, procurement teams, and subject-matter experts. These conversations examine purchasing priorities, product adoption, operational challenges, approval requirements, competitive positioning, and the factors that influence wider market acceptance.
- Desk Research: Desk research covers government statistics, regulatory publications, company filings, trade data, technical studies, industry associations, standards, public policy, and other authoritative sources. Every source used in the analysis is documented in the bibliography.
- Market Sizing and Forecasting: Market estimates combine historical performance, demand indicators, pricing and volume trends, segment shares, company participation, country-level growth, adoption patterns, investment activity, and barriers to market expansion.
- Data Validation and Update Cycle: Findings are validated by comparing primary interviews with public data, company activity, regulatory changes, trade patterns, and industry developments. Regular updates review new product launches, capacity changes, partnerships, approvals, procurement trends, and shifts in commercial adoption.
Segmentation
What is the report's scope and coverage?
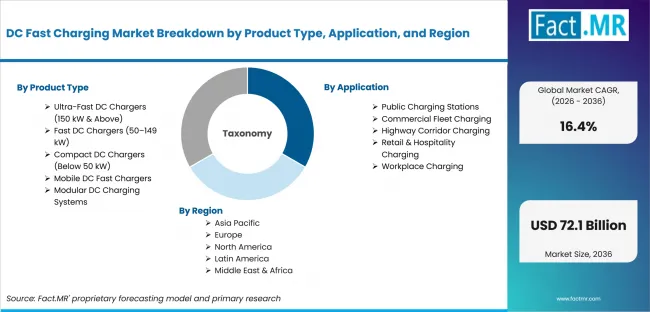
Dc Fast Charging Market Breakdown By Product Type, Application, And Region | Source: Fact.MR
| Attribute | Details |
|---|---|
| Quantitative Units | USD billion in 2026 to USD billion by 2036 at CAGR |
| Market Definition | DC Fast Charging covers commercial supply and installation of high-power DC chargers for electric vehicles across public, highway, fleet and commercial charging locations. |
| Product Type | Ultra-Fast DC Chargers (150 kW & Above); 150-250 kW Chargers; Above 250 kW Chargers; Fast DC Chargers (50-149 kW); 50-99 kW Chargers; 100-149 kW Chargers; Compact DC Chargers (Below 50 kW); 20-30 kW Chargers; 30-49 kW Chargers; Mobile DC Fast Chargers; Portable Chargers; Emergency Charging Units; Modular DC Charging Systems; Expandable Charging Cabinets; Power Sharing Systems |
| Application | Public Charging Stations; Highway Charging Stations; Urban Public Charging Hubs; Commercial Fleet Charging; Logistics Fleets; Public Transport Fleets; Highway Corridor Charging; Expressway Charging; Intercity Charging; Retail & Hospitality Charging; Shopping Centers; Hotels & Restaurants; Workplace Charging; Corporate Offices; Industrial Campuses |
| End User | Charging Network Operators; Public Charging Operators; Private Charging Operators; Commercial Fleet Operators; Logistics Companies; Public Transit Agencies; Automotive OEMs; Passenger Vehicle OEMs; Commercial Vehicle OEMs; Commercial Property Owners; Retail Property Owners; Office Complexes; Government & Public Utilities; Municipal Authorities; State Utility Companies |
| Distribution Channel | Direct Sales; OEM Sales; Project-Based Sales; Authorized Distributors; National Distributors; Regional Distributors; System Integrators; EPC Contractors; EV Infrastructure Integrators; Online Sales; Manufacturer Websites; B2B E-Commerce Platforms; Government Procurement; Public Tenders; Utility Contracts |
| Connector Type | CCS (Combined Charging System); CCS1; CCS2; CHAdeMO; Standard CHAdeMO; High-Power CHAdeMO; NACS (North American Charging Standard); Tesla NACS; Universal NACS; GB/T DC Connector; GB/T 20234 Standard; Upgraded GB/T Systems; Others; Type 2 DC; Proprietary Connectors |
| Regions Covered | North America; Latin America; Europe; East Asia; South Asia and Oceania; Middle East and Africa |
| Countries Covered | USA; Japan; Germany; UK; Canada; Australia; Brazil |
| Key Companies Profiled | ABB E-mobility; Siemens AG; Tesla Inc.; ChargePoint Holdings Inc.; Tritium, an Exicom company; Delta Electronics Inc.; SK Signet; Alpitronic GmbH |
| Forecast Period | 2026 to 2036 |
| Approach | Hybrid top-down and bottom-up assessment using charger demand indicators; site deployment patterns; public and fleet charging use; connector adoption; country growth; company participation; service coverage; uptime requirements; and channel review. |
Source: Fact.MR analysis. Updated Jul 29, 2026
How is the market segmented?
-
By Product Type:
- Ultra-Fast DC Chargers (150 kW & Above)
- 150-250 kW Chargers
- Above 250 kW Chargers
- Fast DC Chargers (50-149 kW)
- 50-99 kW Chargers
- 100-149 kW Chargers
- Compact DC Chargers (Below 50 kW)
- 20-30 kW Chargers
- 30-49 kW Chargers
- Mobile DC Fast Chargers
- Portable Chargers
- Emergency Charging Units
- Modular DC Charging Systems
- Expandable Charging Cabinets
- Power Sharing Systems
-
By Application:
- Public Charging Stations
- Highway Charging Stations
- Urban Public Charging Hubs
- Commercial Fleet Charging
- Logistics Fleets
- Public Transport Fleets
- Highway Corridor Charging
- Expressway Charging
- Intercity Charging
- Retail & Hospitality Charging
- Shopping Centers
- Hotels & Restaurants
- Workplace Charging
- Corporate Offices
- Industrial Campuses
-
By End User:
- Charging Network Operators
- Public Charging Operators
- Private Charging Operators
- Commercial Fleet Operators
- Logistics Companies
- Public Transit Agencies
- Automotive OEMs
- Passenger Vehicle OEMs
- Commercial Vehicle OEMs
- Commercial Property Owners
- Retail Property Owners
- Office Complexes
- Government & Public Utilities
- Municipal Authorities
- State Utility Companies
-
By Distribution Channel:
- Direct Sales
- OEM Sales
- Project-Based Sales
- Authorized Distributors
- National Distributors
- Regional Distributors
- System Integrators
- EPC Contractors
- EV Infrastructure Integrators
- Online Sales
- Manufacturer Websites
- B2B E-Commerce Platforms
- Government Procurement
- Public Tenders
- Utility Contracts
-
By Connector Type:
- CCS (Combined Charging System)
- CCS1
- CCS2
- CHAdeMO
- Standard CHAdeMO
- High-Power CHAdeMO
- NACS (North American Charging Standard)
- Tesla NACS
- Universal NACS
- GB/T DC Connector
- GB/T 20234 Standard
- Upgraded GB/T Systems
- Others
- Type 2 DC
- Proprietary Connectors
-
By Region:
- North America
- Latin America
- Europe
- East Asia
- South Asia and Oceania
- Middle East and Africa
Frequently Asked Questions
Which Product Type leads the market?
Which Application leads the market?
Which End User leads the market?
Which Distribution Channel leads the market?
Which Connector Type leads the market?
Which country records the highest listed CAGR?
What is the primary driver in this market?
What is the main restraint?
Why do public charging stations lead demand?
Who worked on this report


Preview the report firsthand - request a free sample
Free SampleGet the brochure for pricing and purchase details
Download PDF