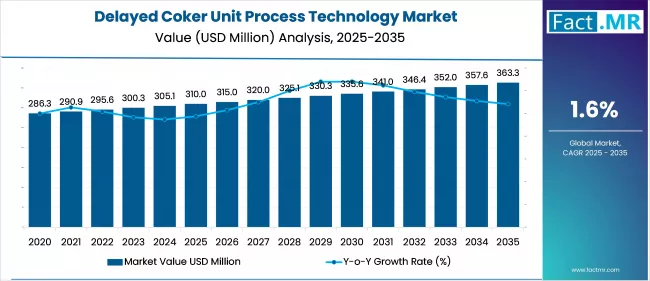
Delayed Coker Unit Process Technology Market

Delayed Coker Unit Process Technology Market Analysis, By Unit Type, By Furnace, By Application, By Process and Region - Market Insights 2025 to 2035

The Conventional Delayed Coking Unit (CDCU) segment is projected to grow at a CAGR of 1.7%, whereas another segment Flexicoking Unit based is likely to grow at 1.5%. In terms of countries China is projected to grow at 4.4%, followed by India at 3.3% and US to grow at 0.7%.

Delayed Coker Unit Process Technology Market (2025 to 2035)

The global delayed coker unit process technology market is expected to reach USD 363.3 million by 2035, up from USD 306.9 million in 2024. During the forecast period 2025 to 2035, the industry is projected to expand at a CAGR of 1.6%.

The market for delayed coker unit (DCU) process technology is driven by the increasing demand for upgrading heavy oil and converting residues, as well as the decreasing supply of light crude. DCUs are being increasingly utilized by refineries to maximize distillate product yields, minimize coke formation, and enhance economic margins.

Delayed Coker Unit Process Technology Market

Integration with downstream petrochemical routes and environmental compliance requirements also support the growing role of DCU adoption in contemporary refinery optimization and residue valorization solution.

What are the drivers of the Delayed Coker Unit Process Technology Market?

The delayed coker unit (DCU) process technology market is currently undergoing progressive development, as growth in demand for heavy residue regeneration and optimized distillate recovery has been observed across refineries. With light crude supplies declining and international fuel quality regulations becoming more stringent, DCU installations are expected to take priority in upgrading low-value feedstocks into lighter and compliant fuels.

The pressure of regulatory initiatives, including IMO 2020 and desulfurization requirements, is directing refiners towards deeper conversion technologies that are compatible with the green fuel standards. There is also the benefit of increased crude-to-chemicals integration, where DCUs enhance the yield of naphtha and aromatics in the market.

The growing demand for needle coke and anode-grade coke is creating additional revenue opportunities. Strategic expansions of refineries in the Asia-Pacific and the Middle East are strengthening the demand for DCU process technologies in the long term.

What are the regional trends of the Delayed Coker Unit Process Technology Market?

Varying levels of refinery modernization characterize the technology market for the delayed coker unit (DCU) process, the introduction of residue upgrade requirements, and evolving regional regulatory frameworks. North America is in a developed phase, with capacity additions primarily focused on increasing liquid yield flexibility and petrochemical integration, particularly on the Gulf Coast of the U.S.

The RepowerEU initiative is encouraging Europe to pursue selected DCU upgrades to support decarbonization efforts and reduce dependency on fuel oil sources. Significant development is taking place in the Asian-Pacific region as China, India, and Southeast Asian countries develop refineries to process heavier crudes and reduce the quantity of imported products.

Latin America is also expanding the use of DCU to improve conversion economics and diversify its downstream operations. Integrated refining-petrochemical hubs are enhancing delayed coking deployment in the Middle East through investments considered part of broader strategic development plans.

What are the challenges and restraining factors of the Delayed Coker Unit Process Technology Market?

The global process technology market for the delayed coker unit (DCU) faces several key issues, including process complexity, environmental compliance, and operational risk. A hindering factor is the high capital requirements and long commissioning schedules associated with DCU installation, which restrict its use in cost-sensitive refineries or facilities with limited space.

Operationally, the coke drum cycle is a bottleneck and it can often cause equipment stress, thermal fatigue and unplanned shutdowns. The disposal of waste petroleum coke, including high-sulfur varieties, is also a potentially landfill-filling byproduct of their management, which further introduces even stringent standards at the carbon and particulate levels.

In emerging regions, the lack of qualified technical specialists and sophisticated control systems limits the optimization of processes. Downstream value chain fragmentation, weak and uneven policy incentives differentiated across markets that benefit specific bases, also complicates investment decisions and the dissemination of DCU technologies.

Country-Wise Insights

U.S. boosts DCU adoption to process heavy crudes profitably

Delayed Coker Unit Process Technology Market Cagr Analysis By Country

The purchase of the delayed coker unit market in the U.S. has been driven by the actions required to upgrade heavy, sour crude blends in different complex refinery structures, particularly in the Gulf Coast. DCUs are purchased by the refinery for their ability to increase yields in light products and high-grade petroleum coke, which is used in the aluminum and steel sectors.

To meet emission requirements, refiners are upgrading their coke drum technology to low-emission systems and automating quenching processes. There is integrated downstream infrastructure for handling and valorizing coker products.

Such upgrades and retrofits are aided by the presence of licensors and experienced EPC companies. Cokers play a special role in enabling refinery profitability under changing fuel mix conditions and sulfur limits.

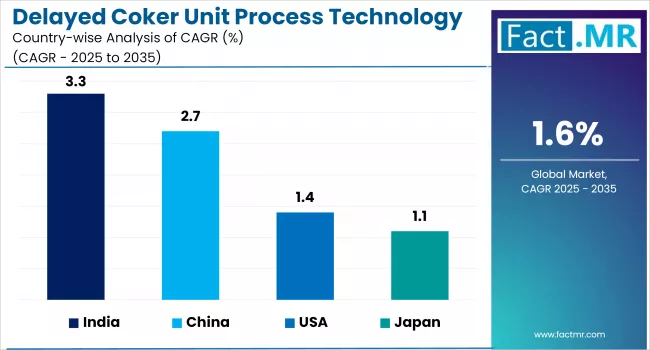
China expands DCUs for refining efficiency and petrochemical integration

The development of the DCU market in China is expanding due to state-organized refinery modernization. The upgrading of refineries aims to improve the efficiency of heavy crude processing and minimize dependence on imported refined products. Large DCUs are being commissioned by national oil companies, such as Sinopec and CNPC, to supply petroleum companies with light fuels and naphtha to petrochemical complexes.

The focus is also on digital automation, the heat recovery system, and environmental control, aligning with carbon neutrality targets. Regions with industrial clusters, such as Shandong and Guangdong, are key locations for coking investments. China continues to record capacity additions in DCUs globally, supported by government policy and increased demand for petcoke in the industrial sector.

India leverages DCUs for residue upgrading and fuel maximization

The DCU market in India is based on the presence of high-complexity refineries in the country, which are increasingly utilizing delayed coking to convert bottom-of-the-barrel residues into value-added transport fuels. The prominent refiners in India, Indian Oil and Reliance Industries, operate DCUs to manage feedstocks that are dependent on imports and to optimize liquid fuel output.

The growing domestic demand for petcoke as a fuel in the cement and power industries enhances downstream integration. The CPCB's environmental policies are encouraging refiners to implement cleaner quenching and vapor recovery systems. The investments in new grassroots plants and brownfield expansions, particularly in Gujarat and Maharashtra, position India as a regional leader in high-efficiency residue upgrading technologies, such as delayed coking.

Category-Wise Analysis

Conventional DCUs dominate for flexible, cost-effective residue conversion

Delayed Coker Unit Process Technology Market Analysis By Unit Type

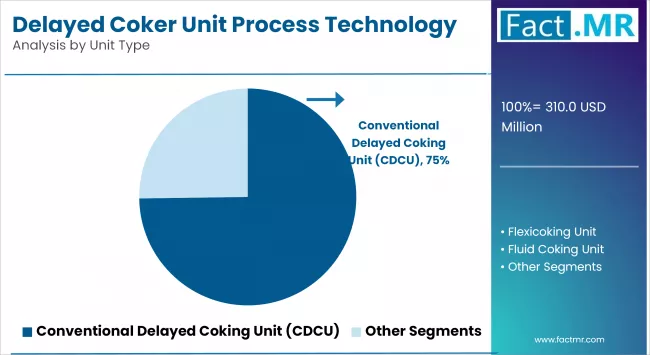
Conventional DCUs remain widely adopted because of their established technological base, flexibility in handling various feedstocks, and compatibility with large-scale refinery operations. These units are used to operate semi-continuous batch processes with the use of paired drums of coke. The refiners have access to control the timing of these cycles, vapor-liquid separation, and coking fouling.

Modular furnace designs and coke handling systems are increasingly tailored to specific applications and locations based on yield requirements and safety factors. Uptime is being improved by advanced metallurgy, predictive monitoring of drum integrity and optimized steam quenching. With the global trend toward more stringent fuel quality standards, conventional DCUs are being reconfigured to increase middle distillate output and produce petcoke suited to downstream industrial needs.

Single-fired furnaces dominate DCU for efficiency, simplicity, and reliability

Delayed Coker Unit Process Technology Market Analysis By Furnace

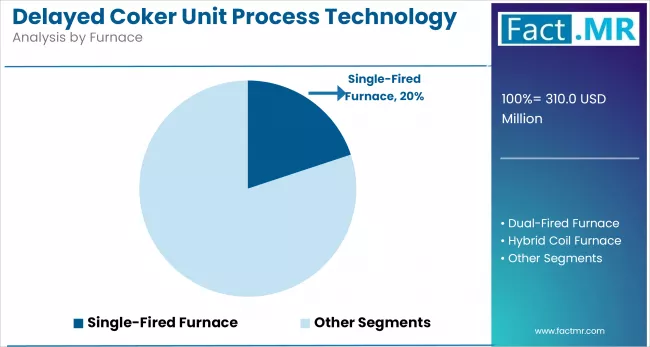
The Single-Fired Furnace segment remains dominant in delayed coking technology due to its simplified design, reduced capital investment requirements, and adaptability to conventional DCU plant designs. The key to maintaining thermal efficiency, reducing hot-spot formation, and maximizing run lengths in high-severity residue cracking processes lies in optimal heat flux management and coil metallurgy. Lining of furnace arrangements is more customized to accommodate feedstock variations, with any special temperature control systems saving energy without compromising the integrity of the coil.

To alleviate fouling and coke deposition, special refractory linings and improved burner designs are being installed. Single-fired furnaces will continue to be a part of the thermal backbone in integrated upgrading schemes as refineries increase the throughput.

Optimized cracking boosts liquid yields, supporting fuel-petrochemical integration

Light fuel fabrication has emerged as the most beneficial economic factor in delayed coking activities, as refiners concentrate on the abundance of transport fuel and petrochemical feedstock. New high-thermal cracking control methods are both increasing selectivity to higher-value naphtha and distillates (selectivity into high-value products) and limiting excessive coke formation (minimization of coke formation). Accurate drum temperature profile and quench run modelling improvements increase the liquid yield efficiency whilst not compromising unit stability.

This is integrated with both downstream hydro treaters and catalytic reforming to meet the ultra-low sulfur in fuels requirements. With refiner demand shifting to petrochemicals, the delayed coking severity is being adjusted by the refiner to produce naphtha with the optimum combination of olefin and aromatics recovery, creating a nexus between fuels and chemicals.

Competitive Analysis

Key players in the delayed coker unit process technology industry include Bechtel Corporation, Lummus Technology, Wood PLC, Honeywell UOP, WorleyParsons Limited, Sulzer, CNPC, SUPCON, MOGAS Industries, Technip Energies, and HPCL.

The market for delayed coker unit (DCU) process technology is expanding, with increasingly significant focus on residue valorization, compliance-based upgrades, and petrochemical integration, being the priority of refiners. Key technology licensors in the coker segment, including Bechtel, Wood, Lummus Technology, and CB&I, are investing in modular coker projects, automated drum-switching systems, and low-emission coke-handling technologies.

A new level of competition is emerging based on thermal efficiency, reduction of the cycle times, and compatibility with complex crude slates. Players are entering strategic collaborations with refinery operators to provide turnkey solutions and post-commissioning services. Demand in Asia and the Middle East has also grown sufficiently to create regional manufacturing hubs, supporting localized fabrication and service capabilities.

Recent Development

  • In March 2025, Honeywell acquired Sundyne to expand its Critical Equipment Portfolio and Aftermarket Services. With the addition of Sundyne's disposable package of products and equipment, combined with the process automation features of Honeywell Forge, we will be well-positioned to provide customers with a broader range of solutions.
  • In August 2023, Lummus Technology also licensed its Novolen polypropylene process reactors and high-performance catalysts to its polypropylene plants at the HPCL Rajasthan Refinery. This type of licensing agreement serves to highlight that Lummus Technology offers refining and petrochemical clients more enhanced and holistic process technologies that are used in large-scale projects, such as large-scale refinery and petrochemical plants, in order to aid in developing refining and petrochemical integration in the Indian sector.

Fact.MR has provided detailed information about the price points of key manufacturers in the Delayed Coker Unit Process Technology Market, positioned across regions, including sales growth, production capacity, and speculative technological expansion, in the recently published report.

Methodology and Industry Tracking Approach

The Fact.MR Global Delayed (DCU) Process Technology Market report 2025 carried out the insights of 9,800 stakeholders across 28 countries with refining-intensive, with a minimum of 300 respondents in each country. The respondent group was sized with refinery engineers, EPC contractors, process licensors, operations managers and regulators.

The research was conducted in July 2025 - June 2026, during which investment trends, technology preferences, limitation within operation and upgrade plans were retrieved. The replied responses were weighted based on regional complexity as well as the penetration of DCU at the refineries. More than 250 sources, including technical whitepapers, project tenders, patent filings, and emissions regulations, were also incorporated, based on sophisticated regression models and sensitivity analysis, to provide technology adoption forecasts.

With Fact.MR monitoring consumer behavior, product efficacy, industry trends, and market opportunities since 2018, this report is becoming an authoritative source of information that stakeholders can rely on.

Segmentation of Delayed Coker Unit Process Technology Market

  • By Unit Type :

    • Conventional Delayed Coking Unit (CDCU)
    • Flexicoking Unit
    • Fluid Coking Unit
    • Continuous Coking Unit
  • By Furnace Type :

    • Single-Fired Furnace
    • Dual-Fired Furnace
    • Hybrid Coil Furnace
  • By Application :

    • Light Fuel Production (Gasoline, Diesel, Naphtha)
    • Petroleum Coke Generation
    • Crude-to-Chemicals Integration
    • Residue Upgrading
    • Feedstock for Gasification Units
  • By End Use :

    • National Oil Companies (NOCs)
    • Independent Refiners
    • Integrated Oil & Gas Majors
    • Petrochemical Companies
    • Public Sector Refineries
  • By Region :

    • North America
    • Latin America
    • Western Europe
    • Eastern Europe
    • East Asia
    • South Asia & Pacific
    • Middle East & Africa

Table of Content

  1. Executive Summary
    • Global Market Outlook
    • Demand-side Trends
    • Supply-side Trends
    • Technology Roadmap Analysis
    • Analysis and Recommendations
  2. Market Overview
    • Market Coverage / Taxonomy
    • Market Definition / Scope / Limitations
  3. Market Background
    • Market Dynamics
      • Drivers
      • Restraints
      • Opportunity
      • Trends
    • Scenario Forecast
      • Demand in Optimistic Scenario
      • Demand in Likely Scenario
      • Demand in Conservative Scenario
    • Opportunity Map Analysis
    • Product Life Cycle Analysis
    • Supply Chain Analysis
      • Supply Side Participants and their Roles
        • Producers
        • Mid-Level Participants (Traders/ Agents/ Brokers)
        • Wholesalers and Distributors
      • Value Added and Value Created at Node in the Supply Chain
      • List of Component Suppliers
      • List of Existing and Potential Buyer’s
    • Investment Feasibility Matrix
    • Value Chain Analysis
      • Profit Margin Analysis
      • Wholesalers and Distributors
      • Retailers
    • PESTLE and Porter’s Analysis
    • Regulatory Landscape
      • By Key Regions
      • By Key Countries
    • Regional Parent Market Outlook
    • Production and Consumption Statistics
    • Import and Export Statistics
  4. Global Market Analysis 2020 to 2024 and Forecast, 2025 to 2035
    • Historical Market Size Value (USD Mn) Analysis, 2020 to 2024
    • Current and Future Market Size Value (USD Mn) Projections, 2025 to 2035
      • Y-o-Y Growth Trend Analysis
      • Absolute $ Opportunity Analysis
  5. Global Market Pricing Analysis 2020 to 2024 and Forecast 2025 to 2035
  6. Global Market Analysis 2020 to 2024 and Forecast 2025 to 2035, By Unit Type
    • Introduction / Key Findings
    • Historical Market Size Value (USD Mn) Analysis By Unit Type, 2020 to 2024
    • Current and Future Market Size Value (USD Mn) Analysis and Forecast By Unit Type, 2025 to 2035
      • Conventional Delayed Coking Unit (CDCU)
      • Flexicoking Unit
      • Fluid Coking Unit
      • Continuous Coking Unit
    • Y-o-Y Growth Trend Analysis By Unit Type, 2020 to 2024
    • Absolute $ Opportunity Analysis By Unit Type, 2025 to 2035
  7. Global Market Analysis 2020 to 2024 and Forecast 2025 to 2035, By Furnace
    • Introduction / Key Findings
    • Historical Market Size Value (USD Mn) Analysis By Furnace, 2020 to 2024
    • Current and Future Market Size Value (USD Mn) Analysis and Forecast By Furnace, 2025 to 2035
      • Single-Fired Furnace
      • Dual-Fired Furnace
      • Hybrid Coil Furnace
    • Y-o-Y Growth Trend Analysis By Furnace, 2020 to 2024
    • Absolute $ Opportunity Analysis By Furnace, 2025 to 2035
  8. Global Market Analysis 2020 to 2024 and Forecast 2025 to 2035, By Application
    • Introduction / Key Findings
    • Historical Market Size Value (USD Mn) Analysis By Application, 2020 to 2024
    • Current and Future Market Size Value (USD Mn) Analysis and Forecast By Application, 2025 to 2035
      • Light Fuel Production (Gasoline, Diesel, Naphtha)
      • Petroleum Coke Generation
      • Crude-to-Chemicals Integration
      • Residue Upgrading
      • Feedstock for Gasification Units
    • Y-o-Y Growth Trend Analysis By Application, 2020 to 2024
    • Absolute $ Opportunity Analysis By Application, 2025 to 2035
  9. Global Market Analysis 2020 to 2024 and Forecast 2025 to 2035, By Process
    • Introduction / Key Findings
    • Historical Market Size Value (USD Mn) Analysis By Process, 2020 to 2024
    • Current and Future Market Size Value (USD Mn) Analysis and Forecast By Process, 2025 to 2035
      • National Oil Companies (NOCs)
      • Independent Refiners
      • Integrated Oil & Gas Majors
      • Petrochemical Companies
      • Public Sector Refineries
    • Y-o-Y Growth Trend Analysis By Process, 2020 to 2024
    • Absolute $ Opportunity Analysis By Process, 2025 to 2035
  10. Global Market Analysis 2020 to 2024 and Forecast 2025 to 2035, By Region
    • Introduction
    • Historical Market Size Value (USD Mn) Analysis By Region, 2020 to 2024
    • Current Market Size Value (USD Mn) Analysis and Forecast By Region, 2025 to 2035
      • North America
      • Latin America
      • Western Europe
      • East Asia
      • South Asia Pacific
      • Eastern Europe
      • Middle East & Africa
    • Market Attractiveness Analysis By Region
  11. North America Market Analysis 2020 to 2024 and Forecast 2025 to 2035, By Country
    • Historical Market Size Value (USD Mn) Trend Analysis By Market Taxonomy, 2020 to 2024
    • Market Size Value (USD Mn) Forecast By Market Taxonomy, 2025 to 2035
      • By Country
        • U.S.
        • Canada
        • Mexico
      • By Unit Type
      • By Furnace
      • By Application
      • By Process
    • Market Attractiveness Analysis
      • By Country
      • By Unit Type
      • By Furnace
      • By Application
      • By Process
    • Key Takeaways
  12. Latin America Market Analysis 2020 to 2024 and Forecast 2025 to 2035, By Country
    • Historical Market Size Value (USD Mn) Trend Analysis By Market Taxonomy, 2020 to 2024
    • Market Size Value (USD Mn) Forecast By Market Taxonomy, 2025 to 2035
      • By Country
        • Brazil
        • Chile
        • Rest of Latin America
      • By Unit Type
      • By Furnace
      • By Application
      • By Process
    • Market Attractiveness Analysis
      • By Country
      • By Unit Type
      • By Furnace
      • By Application
      • By Process
    • Key Takeaways
  13. Western Europe Market Analysis 2020 to 2024 and Forecast 2025 to 2035, By Country
    • Historical Market Size Value (USD Mn) Trend Analysis By Market Taxonomy, 2020 to 2024
    • Market Size Value (USD Mn) Forecast By Market Taxonomy, 2025 to 2035
      • By Country
        • Germany
        • Italy
        • France
        • U.K.
        • Spain
        • Russia
        • BENELUX
        • Rest of Europe
      • By Unit Type
      • By Furnace
      • By Application
      • By Process
    • Market Attractiveness Analysis
      • By Country
      • By Unit Type
      • By Furnace
      • By Application
      • By Process
    • Key Takeaways
  14. East Asia Market Analysis 2020 to 2024 and Forecast 2025 to 2035, By Country
    • Historical Market Size Value (USD Mn) Trend Analysis By Market Taxonomy, 2020 to 2024
    • Market Size Value (USD Mn) Forecast By Market Taxonomy, 2025 to 2035
      • By Country
        • China
        • Japan
        • South Korea
      • By Unit Type
      • By Furnace
      • By Application
      • By Process
    • Market Attractiveness Analysis
      • By Country
      • By Unit Type
      • By Furnace
      • By Application
      • By Process
    • Key Takeaways
  15. South Asia Pacific Market Analysis 2020 to 2024 and Forecast 2025 to 2035, By Country
    • Historical Market Size Value (USD Mn) Trend Analysis By Market Taxonomy, 2020 to 2024
    • Market Size Value (USD Mn) Forecast By Market Taxonomy, 2025 to 2035
      • By Country
        • India
        • ASEAN Countries
        • Australia & New Zealand
        • Rest of South Asia Pacific
      • By Unit Type
      • By Furnace
      • By Application
      • By Process
    • Market Attractiveness Analysis
      • By Country
      • By Unit Type
      • By Furnace
      • By Application
      • By Process
    • Key Takeaways
  16. Eastern Europe Market Analysis 2020 to 2024 and Forecast 2025 to 2035, By Country
    • Historical Market Size Value (USD Mn) Trend Analysis By Market Taxonomy, 2020 to 2024
    • Market Size Value (USD Mn) Forecast By Market Taxonomy, 2025 to 2035
      • By Country
        • Russia
        • Poland
        • Hungary
        • Balkan & Baltics
        • Rest of Eastern Europe
      • By Unit Type
      • By Furnace
      • By Application
      • By Process
    • Market Attractiveness Analysis
      • By Country
      • By Unit Type
      • By Furnace
      • By Application
      • By Process
    • Key Takeaways
  17. Middle East & Africa Market Analysis 2020 to 2024 and Forecast 2025 to 2035, By Country
    • Historical Market Size Value (USD Mn) Trend Analysis By Market Taxonomy, 2020 to 2024
    • Market Size Value (USD Mn) Forecast By Market Taxonomy, 2025 to 2035
      • By Country
        • KSA
        • Other GCC Countries
        • Turkiye
        • South Africa
        • Rest of MEA
      • By Unit Type
      • By Furnace
      • By Application
      • By Process
    • Market Attractiveness Analysis
      • By Country
      • By Unit Type
      • By Furnace
      • By Application
      • By Process
    • Key Takeaways
  18. Key Countries Market Analysis
    • China
      • Pricing Analysis
      • Market Share Analysis, 2024
        • By Unit Type
        • By Furnace
        • By Application
        • By Process
    • India
      • Pricing Analysis
      • Market Share Analysis, 2024
        • By Unit Type
        • By Furnace
        • By Application
        • By Process
    • US
      • Pricing Analysis
      • Market Share Analysis, 2024
        • By Unit Type
        • By Furnace
        • By Application
        • By Process
    • Saudi Arabia
      • Pricing Analysis
      • Market Share Analysis, 2024
        • By Unit Type
        • By Furnace
        • By Application
        • By Process
    • Russia
      • Pricing Analysis
      • Market Share Analysis, 2024
        • By Unit Type
        • By Furnace
        • By Application
        • By Process
  19. Market Structure Analysis
    • Competition Dashboard
    • Competition Benchmarking
    • Market Share Analysis of Top Players
      • By Regional
      • By Unit Type
      • By Furnace
      • By Application
      • By Process
  20. Competition Analysis
    • Competition Deep Dive
      • Bechtel Corporation
        • Overview
        • Product Portfolio
        • Profitability by Market Segments (Product/Age /Sales Channel/Region)
        • Sales Footprint
        • Strategy Overview
          • Marketing Strategy
          • Product Strategy
          • Channel Strategy
      • Lummus Technology
        • Overview
        • Product Portfolio
        • Profitability by Market Segments (Product/Age /Sales Channel/Region)
        • Sales Footprint
        • Strategy Overview
          • Marketing Strategy
          • Product Strategy
          • Channel Strategy
      • Wood PLC
        • Overview
        • Product Portfolio
        • Profitability by Market Segments (Product/Age /Sales Channel/Region)
        • Sales Footprint
        • Strategy Overview
          • Marketing Strategy
          • Product Strategy
          • Channel Strategy
      • Honeywell UOP
        • Overview
        • Product Portfolio
        • Profitability by Market Segments (Product/Age /Sales Channel/Region)
        • Sales Footprint
        • Strategy Overview
          • Marketing Strategy
          • Product Strategy
          • Channel Strategy
      • Worley Parsons Limited
        • Overview
        • Product Portfolio
        • Profitability by Market Segments (Product/Age /Sales Channel/Region)
        • Sales Footprint
        • Strategy Overview
          • Marketing Strategy
          • Product Strategy
          • Channel Strategy
      • Sulzer
        • Overview
        • Product Portfolio
        • Profitability by Market Segments (Product/Age /Sales Channel/Region)
        • Sales Footprint
        • Strategy Overview
          • Marketing Strategy
          • Product Strategy
          • Channel Strategy
      • CNPC
        • Overview
        • Product Portfolio
        • Profitability by Market Segments (Product/Age /Sales Channel/Region)
        • Sales Footprint
        • Strategy Overview
          • Marketing Strategy
          • Product Strategy
          • Channel Strategy
      • SUPCON
        • Overview
        • Product Portfolio
        • Profitability by Market Segments (Product/Age /Sales Channel/Region)
        • Sales Footprint
        • Strategy Overview
          • Marketing Strategy
          • Product Strategy
          • Channel Strategy
      • MOGAS Industries
        • Overview
        • Product Portfolio
        • Profitability by Market Segments (Product/Age /Sales Channel/Region)
        • Sales Footprint
        • Strategy Overview
          • Marketing Strategy
          • Product Strategy
          • Channel Strategy
      • Technip Energies
        • Overview
        • Product Portfolio
        • Profitability by Market Segments (Product/Age /Sales Channel/Region)
        • Sales Footprint
        • Strategy Overview
          • Marketing Strategy
          • Product Strategy
          • Channel Strategy
      • HPCL
        • Overview
        • Product Portfolio
        • Profitability by Market Segments (Product/Age /Sales Channel/Region)
        • Sales Footprint
        • Strategy Overview
          • Marketing Strategy
          • Product Strategy
          • Channel Strategy
  21. Assumptions & Acronyms Used
  22. Research Methodology

List Of Table

  • Table 1: Global Market Value (USD Mn) Forecast by Region, 2020 to 2035
  • Table 2: Global Market Volume (Units) Forecast by Region, 2020 to 2035
  • Table 3: Global Market Value (USD Mn) Forecast by Unit Type, 2020 to 2035
  • Table 4: Global Market Volume (Units) Forecast by Unit Type, 2020 to 2035
  • Table 5: Global Market Value (USD Mn) Forecast by Furnace, 2020 to 2035
  • Table 6: Global Market Volume (Units) Forecast by Furnace, 2020 to 2035
  • Table 7: Global Market Value (USD Mn) Forecast by Application, 2020 to 2035
  • Table 8: Global Market Volume (Units) Forecast by Application, 2020 to 2035
  • Table 9: Global Market Value (USD Mn) Forecast by Process, 2020 to 2035
  • Table 10: Global Market Volume (Units) Forecast by Process, 2020 to 2035
  • Table 11: North America Market Value (USD Mn) Forecast by Country, 2020 to 2035
  • Table 12: North America Market Volume (Units) Forecast by Country, 2020 to 2035
  • Table 13: North America Market Value (USD Mn) Forecast by Unit Type, 2020 to 2035
  • Table 14: North America Market Volume (Units) Forecast by Unit Type, 2020 to 2035
  • Table 15: North America Market Value (USD Mn) Forecast by Furnace, 2020 to 2035
  • Table 16: North America Market Volume (Units) Forecast by Furnace, 2020 to 2035
  • Table 17: North America Market Value (USD Mn) Forecast by Application, 2020 to 2035
  • Table 18: North America Market Volume (Units) Forecast by Application, 2020 to 2035
  • Table 19: North America Market Value (USD Mn) Forecast by Process, 2020 to 2035
  • Table 20: North America Market Volume (Units) Forecast by Process, 2020 to 2035
  • Table 21: Latin America Market Value (USD Mn) Forecast by Country, 2020 to 2035
  • Table 22: Latin America Market Volume (Units) Forecast by Country, 2020 to 2035
  • Table 23: Latin America Market Value (USD Mn) Forecast by Unit Type, 2020 to 2035
  • Table 24: Latin America Market Volume (Units) Forecast by Unit Type, 2020 to 2035
  • Table 25: Latin America Market Value (USD Mn) Forecast by Furnace, 2020 to 2035
  • Table 26: Latin America Market Volume (Units) Forecast by Furnace, 2020 to 2035
  • Table 27: Latin America Market Value (USD Mn) Forecast by Application, 2020 to 2035
  • Table 28: Latin America Market Volume (Units) Forecast by Application, 2020 to 2035
  • Table 29: Latin America Market Value (USD Mn) Forecast by Process, 2020 to 2035
  • Table 30: Latin America Market Volume (Units) Forecast by Process, 2020 to 2035
  • Table 31: Western Europe Market Value (USD Mn) Forecast by Country, 2020 to 2035
  • Table 32: Western Europe Market Volume (Units) Forecast by Country, 2020 to 2035
  • Table 33: Western Europe Market Value (USD Mn) Forecast by Unit Type, 2020 to 2035
  • Table 34: Western Europe Market Volume (Units) Forecast by Unit Type, 2020 to 2035
  • Table 35: Western Europe Market Value (USD Mn) Forecast by Furnace, 2020 to 2035
  • Table 36: Western Europe Market Volume (Units) Forecast by Furnace, 2020 to 2035
  • Table 37: Western Europe Market Value (USD Mn) Forecast by Application, 2020 to 2035
  • Table 38: Western Europe Market Volume (Units) Forecast by Application, 2020 to 2035
  • Table 39: Western Europe Market Value (USD Mn) Forecast by Process, 2020 to 2035
  • Table 40: Western Europe Market Volume (Units) Forecast by Process, 2020 to 2035
  • Table 41: East Asia Market Value (USD Mn) Forecast by Country, 2020 to 2035
  • Table 42: East Asia Market Volume (Units) Forecast by Country, 2020 to 2035
  • Table 43: East Asia Market Value (USD Mn) Forecast by Unit Type, 2020 to 2035
  • Table 44: East Asia Market Volume (Units) Forecast by Unit Type, 2020 to 2035
  • Table 45: East Asia Market Value (USD Mn) Forecast by Furnace, 2020 to 2035
  • Table 46: East Asia Market Volume (Units) Forecast by Furnace, 2020 to 2035
  • Table 47: East Asia Market Value (USD Mn) Forecast by Application, 2020 to 2035
  • Table 48: East Asia Market Volume (Units) Forecast by Application, 2020 to 2035
  • Table 49: East Asia Market Value (USD Mn) Forecast by Process, 2020 to 2035
  • Table 50: East Asia Market Volume (Units) Forecast by Process, 2020 to 2035
  • Table 51: South Asia Pacific Market Value (USD Mn) Forecast by Country, 2020 to 2035
  • Table 52: South Asia Pacific Market Volume (Units) Forecast by Country, 2020 to 2035
  • Table 53: South Asia Pacific Market Value (USD Mn) Forecast by Unit Type, 2020 to 2035
  • Table 54: South Asia Pacific Market Volume (Units) Forecast by Unit Type, 2020 to 2035
  • Table 55: South Asia Pacific Market Value (USD Mn) Forecast by Furnace, 2020 to 2035
  • Table 56: South Asia Pacific Market Volume (Units) Forecast by Furnace, 2020 to 2035
  • Table 57: South Asia Pacific Market Value (USD Mn) Forecast by Application, 2020 to 2035
  • Table 58: South Asia Pacific Market Volume (Units) Forecast by Application, 2020 to 2035
  • Table 59: South Asia Pacific Market Value (USD Mn) Forecast by Process, 2020 to 2035
  • Table 60: South Asia Pacific Market Volume (Units) Forecast by Process, 2020 to 2035
  • Table 61: Eastern Europe Market Value (USD Mn) Forecast by Country, 2020 to 2035
  • Table 62: Eastern Europe Market Volume (Units) Forecast by Country, 2020 to 2035
  • Table 63: Eastern Europe Market Value (USD Mn) Forecast by Unit Type, 2020 to 2035
  • Table 64: Eastern Europe Market Volume (Units) Forecast by Unit Type, 2020 to 2035
  • Table 65: Eastern Europe Market Value (USD Mn) Forecast by Furnace, 2020 to 2035
  • Table 66: Eastern Europe Market Volume (Units) Forecast by Furnace, 2020 to 2035
  • Table 67: Eastern Europe Market Value (USD Mn) Forecast by Application, 2020 to 2035
  • Table 68: Eastern Europe Market Volume (Units) Forecast by Application, 2020 to 2035
  • Table 69: Eastern Europe Market Value (USD Mn) Forecast by Process, 2020 to 2035
  • Table 70: Eastern Europe Market Volume (Units) Forecast by Process, 2020 to 2035
  • Table 71: Middle East & Africa Market Value (USD Mn) Forecast by Country, 2020 to 2035
  • Table 72: Middle East & Africa Market Volume (Units) Forecast by Country, 2020 to 2035
  • Table 73: Middle East & Africa Market Value (USD Mn) Forecast by Unit Type, 2020 to 2035
  • Table 74: Middle East & Africa Market Volume (Units) Forecast by Unit Type, 2020 to 2035
  • Table 75: Middle East & Africa Market Value (USD Mn) Forecast by Furnace, 2020 to 2035
  • Table 76: Middle East & Africa Market Volume (Units) Forecast by Furnace, 2020 to 2035
  • Table 77: Middle East & Africa Market Value (USD Mn) Forecast by Application, 2020 to 2035
  • Table 78: Middle East & Africa Market Volume (Units) Forecast by Application, 2020 to 2035
  • Table 79: Middle East & Africa Market Value (USD Mn) Forecast by Process, 2020 to 2035
  • Table 80: Middle East & Africa Market Volume (Units) Forecast by Process, 2020 to 2035

List Of Figures

  • Figure 1: Global Market Volume (Units) Forecast 2020 to 2035
  • Figure 2: Global Market Pricing Analysis
  • Figure 3: Global Market Value (USD Mn) Forecast 2020 to 2035
  • Figure 4: Global Market Value Share and BPS Analysis by Unit Type, 2025 and 2035
  • Figure 5: Global Market Y-o-Y Growth Comparison by Unit Type, 2025 to 2035
  • Figure 6: Global Market Attractiveness Analysis by Unit Type
  • Figure 7: Global Market Value Share and BPS Analysis by Furnace, 2025 and 2035
  • Figure 8: Global Market Y-o-Y Growth Comparison by Furnace, 2025 to 2035
  • Figure 9: Global Market Attractiveness Analysis by Furnace
  • Figure 10: Global Market Value Share and BPS Analysis by Application, 2025 and 2035
  • Figure 11: Global Market Y-o-Y Growth Comparison by Application, 2025 to 2035
  • Figure 12: Global Market Attractiveness Analysis by Application
  • Figure 13: Global Market Value Share and BPS Analysis by Process, 2025 and 2035
  • Figure 14: Global Market Y-o-Y Growth Comparison by Process, 2025 to 2035
  • Figure 15: Global Market Attractiveness Analysis by Process
  • Figure 16: Global Market Value (USD Mn) Share and BPS Analysis by Region, 2025 and 2035
  • Figure 17: Global Market Y-o-Y Growth Comparison by Region, 2025 to 2035
  • Figure 18: Global Market Attractiveness Analysis by Region
  • Figure 19: North America Market Incremental $ Opportunity, 2025 to 2035
  • Figure 20: Latin America Market Incremental $ Opportunity, 2025 to 2035
  • Figure 21: Western Europe Market Incremental $ Opportunity, 2025 to 2035
  • Figure 22: East Asia Market Incremental $ Opportunity, 2025 to 2035
  • Figure 23: South Asia Pacific Market Incremental $ Opportunity, 2025 to 2035
  • Figure 24: Eastern Europe Market Incremental $ Opportunity, 2025 to 2035
  • Figure 25: Middle East & Africa Market Incremental $ Opportunity, 2025 to 2035
  • Figure 26: North America Market Value Share and BPS Analysis by Country, 2025 and 2035
  • Figure 27: North America Market Value Share and BPS Analysis by Unit Type, 2025 and 2035
  • Figure 28: North America Market Y-o-Y Growth Comparison by Unit Type, 2025 to 2035
  • Figure 29: North America Market Attractiveness Analysis by Unit Type
  • Figure 30: North America Market Value Share and BPS Analysis by Furnace, 2025 and 2035
  • Figure 31: North America Market Y-o-Y Growth Comparison by Furnace, 2025 to 2035
  • Figure 32: North America Market Attractiveness Analysis by Furnace
  • Figure 33: North America Market Value Share and BPS Analysis by Application, 2025 and 2035
  • Figure 34: North America Market Y-o-Y Growth Comparison by Application, 2025 to 2035
  • Figure 35: North America Market Attractiveness Analysis by Application
  • Figure 36: North America Market Value Share and BPS Analysis by Process, 2025 and 2035
  • Figure 37: North America Market Y-o-Y Growth Comparison by Process, 2025 to 2035
  • Figure 38: North America Market Attractiveness Analysis by Process
  • Figure 39: Latin America Market Value Share and BPS Analysis by Country, 2025 and 2035
  • Figure 40: Latin America Market Value Share and BPS Analysis by Unit Type, 2025 and 2035
  • Figure 41: Latin America Market Y-o-Y Growth Comparison by Unit Type, 2025 to 2035
  • Figure 42: Latin America Market Attractiveness Analysis by Unit Type
  • Figure 43: Latin America Market Value Share and BPS Analysis by Furnace, 2025 and 2035
  • Figure 44: Latin America Market Y-o-Y Growth Comparison by Furnace, 2025 to 2035
  • Figure 45: Latin America Market Attractiveness Analysis by Furnace
  • Figure 46: Latin America Market Value Share and BPS Analysis by Application, 2025 and 2035
  • Figure 47: Latin America Market Y-o-Y Growth Comparison by Application, 2025 to 2035
  • Figure 48: Latin America Market Attractiveness Analysis by Application
  • Figure 49: Latin America Market Value Share and BPS Analysis by Process, 2025 and 2035
  • Figure 50: Latin America Market Y-o-Y Growth Comparison by Process, 2025 to 2035
  • Figure 51: Latin America Market Attractiveness Analysis by Process
  • Figure 52: Western Europe Market Value Share and BPS Analysis by Country, 2025 and 2035
  • Figure 53: Western Europe Market Value Share and BPS Analysis by Unit Type, 2025 and 2035
  • Figure 54: Western Europe Market Y-o-Y Growth Comparison by Unit Type, 2025 to 2035
  • Figure 55: Western Europe Market Attractiveness Analysis by Unit Type
  • Figure 56: Western Europe Market Value Share and BPS Analysis by Furnace, 2025 and 2035
  • Figure 57: Western Europe Market Y-o-Y Growth Comparison by Furnace, 2025 to 2035
  • Figure 58: Western Europe Market Attractiveness Analysis by Furnace
  • Figure 59: Western Europe Market Value Share and BPS Analysis by Application, 2025 and 2035
  • Figure 60: Western Europe Market Y-o-Y Growth Comparison by Application, 2025 to 2035
  • Figure 61: Western Europe Market Attractiveness Analysis by Application
  • Figure 62: Western Europe Market Value Share and BPS Analysis by Process, 2025 and 2035
  • Figure 63: Western Europe Market Y-o-Y Growth Comparison by Process, 2025 to 2035
  • Figure 64: Western Europe Market Attractiveness Analysis by Process
  • Figure 65: East Asia Market Value Share and BPS Analysis by Country, 2025 and 2035
  • Figure 66: East Asia Market Value Share and BPS Analysis by Unit Type, 2025 and 2035
  • Figure 67: East Asia Market Y-o-Y Growth Comparison by Unit Type, 2025 to 2035
  • Figure 68: East Asia Market Attractiveness Analysis by Unit Type
  • Figure 69: East Asia Market Value Share and BPS Analysis by Furnace, 2025 and 2035
  • Figure 70: East Asia Market Y-o-Y Growth Comparison by Furnace, 2025 to 2035
  • Figure 71: East Asia Market Attractiveness Analysis by Furnace
  • Figure 72: East Asia Market Value Share and BPS Analysis by Application, 2025 and 2035
  • Figure 73: East Asia Market Y-o-Y Growth Comparison by Application, 2025 to 2035
  • Figure 74: East Asia Market Attractiveness Analysis by Application
  • Figure 75: East Asia Market Value Share and BPS Analysis by Process, 2025 and 2035
  • Figure 76: East Asia Market Y-o-Y Growth Comparison by Process, 2025 to 2035
  • Figure 77: East Asia Market Attractiveness Analysis by Process
  • Figure 78: South Asia Pacific Market Value Share and BPS Analysis by Country, 2025 and 2035
  • Figure 79: South Asia Pacific Market Value Share and BPS Analysis by Unit Type, 2025 and 2035
  • Figure 80: South Asia Pacific Market Y-o-Y Growth Comparison by Unit Type, 2025 to 2035
  • Figure 81: South Asia Pacific Market Attractiveness Analysis by Unit Type
  • Figure 82: South Asia Pacific Market Value Share and BPS Analysis by Furnace, 2025 and 2035
  • Figure 83: South Asia Pacific Market Y-o-Y Growth Comparison by Furnace, 2025 to 2035
  • Figure 84: South Asia Pacific Market Attractiveness Analysis by Furnace
  • Figure 85: South Asia Pacific Market Value Share and BPS Analysis by Application, 2025 and 2035
  • Figure 86: South Asia Pacific Market Y-o-Y Growth Comparison by Application, 2025 to 2035
  • Figure 87: South Asia Pacific Market Attractiveness Analysis by Application
  • Figure 88: South Asia Pacific Market Value Share and BPS Analysis by Process, 2025 and 2035
  • Figure 89: South Asia Pacific Market Y-o-Y Growth Comparison by Process, 2025 to 2035
  • Figure 90: South Asia Pacific Market Attractiveness Analysis by Process
  • Figure 91: Eastern Europe Market Value Share and BPS Analysis by Country, 2025 and 2035
  • Figure 92: Eastern Europe Market Value Share and BPS Analysis by Unit Type, 2025 and 2035
  • Figure 93: Eastern Europe Market Y-o-Y Growth Comparison by Unit Type, 2025 to 2035
  • Figure 94: Eastern Europe Market Attractiveness Analysis by Unit Type
  • Figure 95: Eastern Europe Market Value Share and BPS Analysis by Furnace, 2025 and 2035
  • Figure 96: Eastern Europe Market Y-o-Y Growth Comparison by Furnace, 2025 to 2035
  • Figure 97: Eastern Europe Market Attractiveness Analysis by Furnace
  • Figure 98: Eastern Europe Market Value Share and BPS Analysis by Application, 2025 and 2035
  • Figure 99: Eastern Europe Market Y-o-Y Growth Comparison by Application, 2025 to 2035
  • Figure 100: Eastern Europe Market Attractiveness Analysis by Application
  • Figure 101: Eastern Europe Market Value Share and BPS Analysis by Process, 2025 and 2035
  • Figure 102: Eastern Europe Market Y-o-Y Growth Comparison by Process, 2025 to 2035
  • Figure 103: Eastern Europe Market Attractiveness Analysis by Process
  • Figure 104: Middle East & Africa Market Value Share and BPS Analysis by Country, 2025 and 2035
  • Figure 105: Middle East & Africa Market Value Share and BPS Analysis by Unit Type, 2025 and 2035
  • Figure 106: Middle East & Africa Market Y-o-Y Growth Comparison by Unit Type, 2025 to 2035
  • Figure 107: Middle East & Africa Market Attractiveness Analysis by Unit Type
  • Figure 108: Middle East & Africa Market Value Share and BPS Analysis by Furnace, 2025 and 2035
  • Figure 109: Middle East & Africa Market Y-o-Y Growth Comparison by Furnace, 2025 to 2035
  • Figure 110: Middle East & Africa Market Attractiveness Analysis by Furnace
  • Figure 111: Middle East & Africa Market Value Share and BPS Analysis by Application, 2025 and 2035
  • Figure 112: Middle East & Africa Market Y-o-Y Growth Comparison by Application, 2025 to 2035
  • Figure 113: Middle East & Africa Market Attractiveness Analysis by Application
  • Figure 114: Middle East & Africa Market Value Share and BPS Analysis by Process, 2025 and 2035
  • Figure 115: Middle East & Africa Market Y-o-Y Growth Comparison by Process, 2025 to 2035
  • Figure 116: Middle East & Africa Market Attractiveness Analysis by Process
  • Figure 117: Global Market - Tier Structure Analysis
  • Figure 118: Global Market - Company Share Analysis

- FAQs -

What was the Global Delayed Coker Unit Process Technology Market Size Reported by Fact.MR for 2025?

The global delayed coker unit process technology market was valued at USD 310 million in 2025.

Who are the Major Players Operating in the Delayed Coker Unit Process Technology Market?

Prominent players in the market are Bechtel Corporation, Lummus Technology, Wood PLC, Honeywell UOP, Worley Parsons Limited, Sulzer, CNPC, SUPCON, among others.

What is the Estimated Valuation of the Delayed Coker Unit Process Technology Market in 2035?

The market is expected to reach a valuation of USD 363.3 million in 2035.

What Value CAGR did the Delayed Coker Unit Process Technology Market Exhibit Over the Last Five Years?

The historic growth rate of the delayed coker unit process technology market was 1% from 2020 to 2024.

Delayed Coker Unit Process Technology Market

Schedule a Call