- Market Value (2025): USD 5.2 Bn
- Estimated Value (2026): USD 5.8 Bn
- Forecast Value (2036): USD 18.2 Bn
- CAGR (2026-2036): 12.1%
What is the Diet Nutrition Apps Market forecast to be worth by 2036?
USD 5.8 billion in 2026 to USD 18.2 billion by 2036 at 12.1% CAGR.
- The diet nutrition apps market reached USD 5.2 billion in 2025 as app publishers, wellness platforms, diet coaches and individual users increased spending where consumers use mobile tracking to manage weight, food intake and subscription-based wellness support.
- Demand is projected to increase from USD 5.8 billion in 2026 to USD 18.2 billion by 2036.
- The market is forecast to record 12.1% CAGR from 2026 to 2036 because consumers use mobile tracking to manage weight, food intake and subscription-based wellness support.
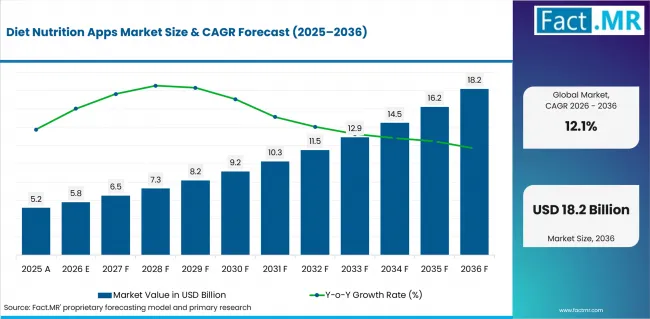
Diet Nutrition Apps Market Value Analysis | Source: Fact.MR
What are the defining numbers behind Diet Nutrition Apps Market growth?
USD 12.4 billion absolute opportunity is expected by 2036.
- Demand Drivers in the Market
- Android leads because it gives nutrition apps broad reach across price tiers and emerging smartphone markets.
- Weight management remains the clearest use case because users can connect meals, calories, activity and progress in one workflow.
- Freemium models lower the entry barrier and give publishers a route to convert heavy users into paid plans.
- Individual consumers lead demand because most app use begins with personal goals rather than employer or clinical enrollment.
- Key Segments Analyzed
- By Platform: Android is expected to hold 46.0% share in 2026 because the platform gives publishers broad reach across device price points and regions.
- By Application: Weight Management is expected to hold 34.0% share in 2026 because users can connect calorie intake, meal choices and progress tracking around a clear goal.
- By Subscription Model: Freemium is expected to hold 44.0% share in 2026 because free entry reduces adoption friction while premium tools support conversion.
- By End User: Individual Consumers are expected to hold 68.0% share in 2026 because most usage starts with personal weight, health or meal-planning goals.
- By Feature Type: Calorie & Nutrition Tracking is expected to hold 38.0% share in 2026 because food logging remains the feature users return to most often.
- Analyst Opinion at Fact.MR
- Shambhu Nath Jha, Sr. Consultant at Fact.MR, states, "Nutrition apps keep users only when the daily action is simple. Food logging, progress feedback and coaching prompts have to feel useful quickly, or users leave before subscription value is clear."
- Strategic Implications
- App publishers should reduce logging friction and improve food databases because these decide daily retention.
- Subscription offers need visible value beyond basic calorie counting, such as coaching, meal planning or deeper insights.
- Platforms should handle health data carefully because privacy expectations rise when apps collect weight, diet and wellness records.
- South Korea is projected at 13.1%; USA is projected at 12.7%; UK is projected at 12.4%; Australia is projected at 12.2%; Canada is projected at 12.0%; Germany is projected at 11.8%; Japan is projected at 11.2% during 2026 to 2036. Country analysis is shaped by smartphone reach, paid wellness behavior and weight-management demand.
How does the Diet Nutrition Apps Market break down by segment?
Android leads Platform at 53.3% share in 2026, while Weight Management leads Application at 34.0% share.
Why does Android lead Platform?
Android is expected to account for 53.3% share in 2026.
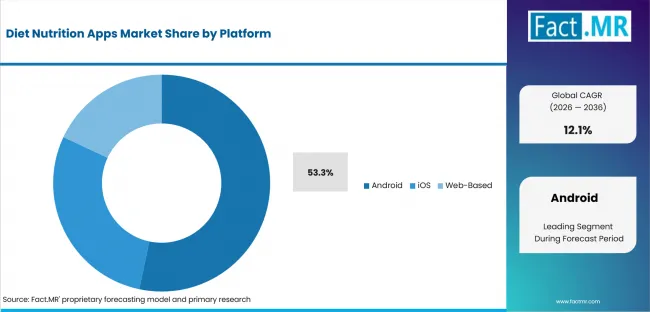
Diet Nutrition Apps Market Analysis By Platform | Source: Fact.MR
Android leads the platform segment because the platform gives publishers broad reach across device price points and regions.
Why does Weight Management lead Application?
Weight Management is expected to account for 31.9% share in 2026.
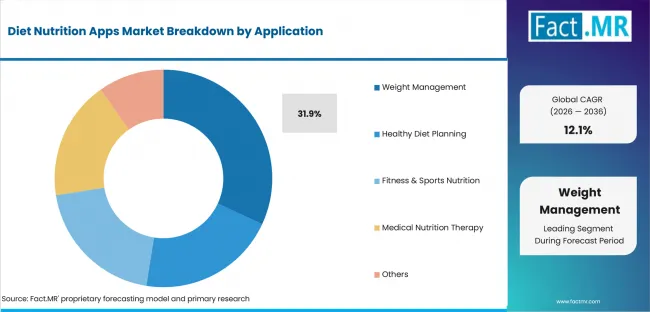
Diet Nutrition Apps Market Analysis By Application | Source: Fact.MR
Weight Management leads the application segment because users can connect calorie intake, meal choices and progress tracking around a clear goal.
Why does Freemium lead Subscription Model?
Freemium is expected to account for 37.8% share in 2026.
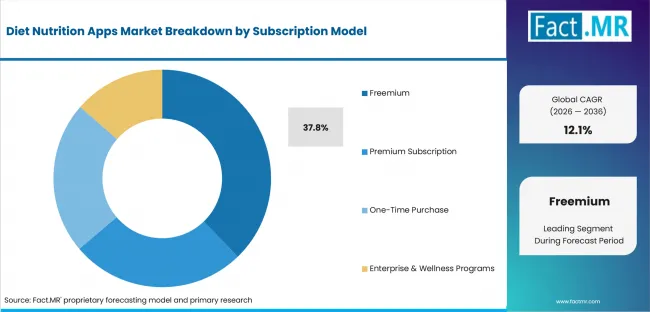
Diet Nutrition Apps Market Analysis By Subscription Model | Source: Fact.MR
Freemium leads the subscription model segment because free entry reduces adoption friction while premium tools support conversion.
Why does Individual Consumers lead End User?
Individual Consumers is expected to account for 34.0% share in 2026.
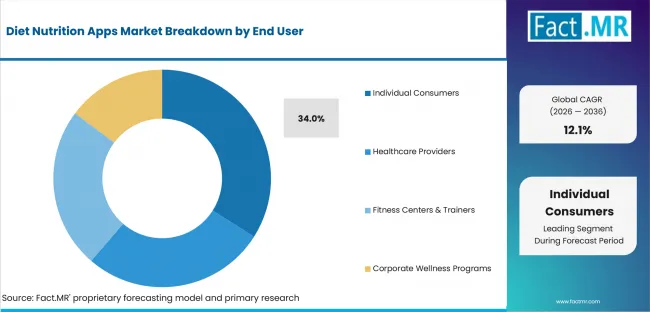
Diet Nutrition Apps Market Analysis By End User | Source: Fact.MR
Individual Consumers lead the end user segment because most usage starts with personal weight, health or meal-planning goals.
Why does Calorie & Nutrition Tracking lead Feature Type?
Calorie & Nutrition Tracking is expected to account for 36.3% share in 2026.
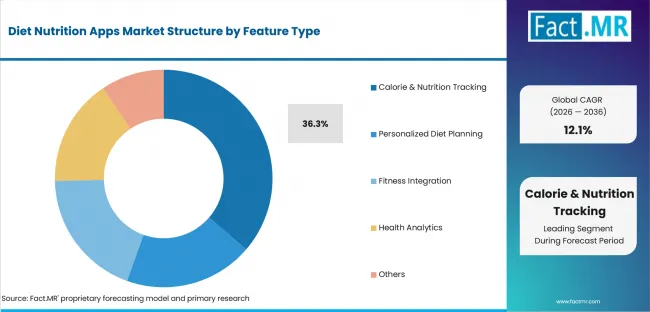
Diet Nutrition Apps Market Analysis By Feature Type | Source: Fact.MR
Calorie & Nutrition Tracking leads the feature type segment because food logging remains the feature users return to most often.
What is accelerating Diet Nutrition Apps Market adoption, and what is holding it back?
Demand is supported by smartphone use, weight-management goals and freemium app access. Growth is held back by app fatigue, weak retention and privacy concerns.
| DRIVER | QUALITATIVE RELEVANCE | GEOGRAPHIC RELEVANCE | IMPACT TIMELINE |
|---|---|---|---|
| Android reach | High | South Korea | Short term (<=2 years) |
| Weight management | High | USA | Short term (<=2 years) |
| Freemium access | Moderate | UK | Medium term (2-4 years) |
| Nutrition tracking | Selective | Australia | Medium term (2-4 years) |
Source: Fact.MR analysis. Updated Jul 28, 2026
- Android reach: Android expands the addressable user base across device price points and geographies.
- Weight management: Users want a simple link between food intake, calories, activity and progress.
- Freemium access: Free tools bring users into the app before paid coaching or premium analytics are offered.
- Nutrition tracking: Food logging remains the central habit that keeps users returning.
Opportunity Impact Analysis
| OPPORTUNITY | QUALITATIVE RELEVANCE | GEOGRAPHIC RELEVANCE | IMPACT TIMELINE |
|---|---|---|---|
| Personalized meal planning | High | South Korea | Medium term (2-4 years) |
| Wearable and grocery integrations | Moderate | USA | Medium term (2-4 years) |
| GLP-1 and medical weight-management users | Selective | UK | Medium term (2-4 years) |
Source: Fact.MR analysis. Updated Jul 28, 2026
- Personalized meal planning can improve retention when it uses user goals and food preferences.
- Wearable and grocery integrations can reduce manual logging and improve daily usefulness.
- GLP-1 and medical weight-management users create demand for more structured nutrition support inside apps.
Restraints Impact Analysis
| RESTRAINT | QUALITATIVE RELEVANCE | GEOGRAPHIC RELEVANCE | IMPACT TIMELINE |
|---|---|---|---|
| User churn | High | South Korea | Short term (<=2 years) |
| Privacy concerns | Moderate | USA | Medium term (2-4 years) |
| Generic app advice | Selective | UK | Medium term (2-4 years) |
Source: Fact.MR analysis. Updated Jul 28, 2026
- User churn remains high when logging feels repetitive or inaccurate.
- Privacy concerns can limit adoption when apps collect diet, weight and health data.
- Generic advice weakens willingness to pay for premium plans.
Which countries are scaling Diet Nutrition Apps Market fastest?
The global CAGR is 12.1%. Country rates show how smartphone reach, paid wellness behavior and weight-management demand change the adoption route by market.
- South Korea records the highest listed CAGR at 13.1% from 2026 to 2036.
- USA and UK also sit close to the upper end of the comparison where local demand conditions are stronger.
- Australia, Canada, Germany, and Japan grow more steadily as buyers weigh cost, availability and adoption risk.
The full regional view covers North America, Latin America, Europe, East Asia, South Asia and Oceania, and the Middle East and Africa.
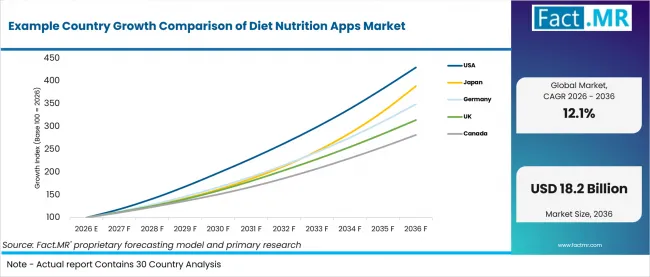
Example Country Growth Comparison Of Diet Nutrition Apps Market | Source: Fact.MR
| COUNTRY | CAGR, 2026 to 2036 |
|---|---|
| South Korea | 13.1% |
| USA | 12.7% |
| UK | 12.4% |
| Australia | 12.2% |
| Canada | 12.0% |
| Germany | 11.8% |
| Japan | 11.2% |
Source: Fact.MR analysis. Updated Jul 28, 2026
What is shaping South Korea's outlook through 2036?
South Korea is projected at 13.1% CAGR during 2026 to 2036, above the global 12.1% trajectory. high mobile engagement and digital wellness habits support faster app adoption.
What is shaping USA's outlook through 2036?
USA is projected at 12.7% CAGR during 2026 to 2036, above the global 12.1% trajectory. subscription wellness spending and weight-management demand support monetization.
What is shaping UK's outlook through 2036?
UK is projected at 12.4% CAGR during 2026 to 2036, above the global 12.1% trajectory. public health attention to weight management and strong smartphone use support app uptake.
What is shaping Australia's outlook through 2036?
Australia is projected at 12.2% CAGR during 2026 to 2036, above the global 12.1% trajectory. fitness and wellness app use supports demand for tracking and meal-planning tools.
What is shaping Canada's outlook through 2036?
Canada is projected at 12.0% CAGR during 2026 to 2036, below the global 12.1% trajectory. consumer wellness spending supports adoption, though subscription conversion remains selective.
What is shaping Germany's outlook through 2036?
Germany is projected at 11.8% CAGR during 2026 to 2036, below the global 12.1% trajectory. privacy expectations and evidence concerns make retention and trust important.
What is shaping Japan's outlook through 2036?
Japan is projected at 11.2% CAGR during 2026 to 2036, below the global 12.1% trajectory. mobile use is high, but paid conversion depends on convenience and localized food data.
Who leads the Diet Nutrition Apps Market?
MyFitnessPal and Noom are among the visible providers in the diet nutrition apps market. WW International (WeightWatchers) and YAZIO also compete in the named provider set.
MyFitnessPal is estimated to hold 14.2% share in 2026. Competition is shaped by food databases, tracking accuracy, user retention, coaching features, privacy and subscription conversion.
Through 2036, competitive gains are expected to come from clearer positioning around Android and stronger execution in the highest-growth country markets.
Which companies are the key providers?
Key companies include MyFitnessPal; Noom; WW International (WeightWatchers); YAZIO; Lifesum; Cronometer; Lose It!; HealthifyMe.
- MyFitnessPal
- Noom
- WW International (WeightWatchers)
- YAZIO
- Lifesum
- Cronometer
- Lose It!
- HealthifyMe
Bibliography
- FDA: Device Software Functions Including Mobile Medical Applications.
- WHO: Recommendations on Digital Interventions for Health System Strengthening.
- CDC: Tips for Healthy Eating for a Healthy Weight.
This Report Addresses
- The report evaluates the Diet Nutrition Apps Market through Platform and Application choices that define the 2026 market structure.
- Segment analysis covers Android and Weight Management as the leading 2026 positions.
- Country outlook compares the listed markets by CAGR and explains how smartphone reach, paid wellness behavior and weight-management demand shape local demand.
- Competitive analysis profiles the named providers and evaluates competition around food databases, tracking accuracy, user retention, coaching features, privacy and subscription conversion.
What does the Diet Nutrition Apps Market cover?
The Diet Nutrition Apps Market covers mobile and digital applications used for calorie tracking, meal planning, weight management, nutrition coaching and related consumer wellness functions.
The market boundary is tied to paid products, services and channels that directly support this use case. Adjacent spending is included only when it is part of the same purchase or operating decision.
What is included in the scope?
The scope includes platform, application, subscription model, end user, feature type and regional demand for diet nutrition apps.
Coverage also includes adjacent segment options when they are purchased for the same defined market use.
What is excluded from the scope?
The scope excludes general fitness apps without nutrition functions, clinical nutrition systems not sold as apps and unrelated food delivery services.
How Was the Analysis Built?
The analysis combines primary research with desk research focused on the diet nutrition apps market, its segment structure and country-level demand.
- Primary Research: Interviews and validation discussions test buyer priorities, adoption barriers, pricing logic and operating requirements.
- Desk Research: The assessment reviews company disclosures, public datasets, regulatory material, technical literature and industry records relevant to the market.
- Market Sizing and Forecasting: Estimates combine top-down and bottom-up checks across demand signals, segment shares, country activity, company participation and adoption constraints.
Segmentation
What is the report's scope and coverage?
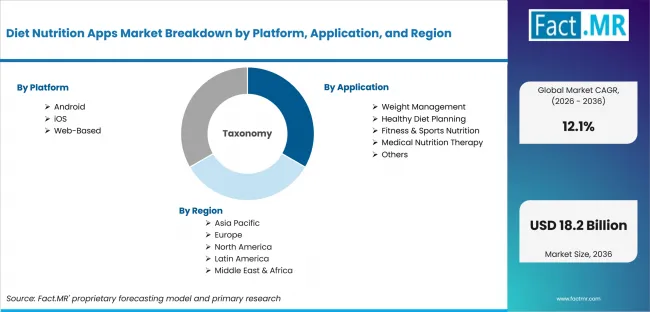
Diet Nutrition Apps Market Breakdown By Platform, Application, And Region | Source: Fact.MR
| Attribute | Details |
|---|---|
| Quantitative Units | USD billion in 2026 to USD billion by 2036 at a CAGR |
| Market Definition | Diet Nutrition Apps covers commercial buying, supply and use of Android offerings, with Application choices and South Korea demand used to frame how the category serves data capture, system control, workflow automation and secure digital operations. |
| Platform | Android; Google Play Applications; Android Tablets; iOS; iPhone Applications; iPad Applications; Web-Based; Browser Applications; Desktop Access |
| Application | Weight Management; Calorie Tracking; Weight Loss Programs; Healthy Diet Planning; Meal Planning; Nutrition Monitoring; Fitness & Sports Nutrition; Macro Tracking; Performance Nutrition; Medical Nutrition Therapy; Diabetes Nutrition; Heart Health Nutrition; Others; Pregnancy Nutrition; Pediatric Nutrition |
| Subscription Model | Freemium; Free Access; In-App Purchases; Premium Subscription; Monthly Plans; Annual Plans; One-Time Purchase; Lifetime Access; Premium Features; Enterprise & Wellness Programs; Corporate Wellness; Healthcare Partnerships |
| End User | Individual Consumers; Fitness Enthusiasts; Weight Management Users; Healthcare Providers; Dietitians; Nutrition Clinics; Fitness Centers & Trainers; Gyms; Personal Trainers; Corporate Wellness Programs; Employers; Insurance Wellness Programs |
| Feature Type | Calorie & Nutrition Tracking; Food Database; Barcode Scanning; Personalized Diet Planning; AI Meal Recommendations; Custom Meal Plans; Fitness Integration; Wearable Device Sync; Exercise Tracking; Health Analytics; Progress Reports; Health Score Dashboard; Others; Community Support; Recipe Recommendations |
| Regions Covered | North America; Latin America; Europe; East Asia; South Asia and Oceania; Middle East and Africa |
| Countries Covered | South Korea; USA; UK; Australia; Canada; Germany; Japan |
| Key Companies Profiled | MyFitnessPal; Noom; WW International (WeightWatchers); YAZIO; Lifesum; Cronometer; Lose It!; HealthifyMe |
| Forecast Period | 2026 to 2036 |
| Approach | Hybrid top-down and bottom-up assessment using demand indicators, segment mix, country growth, company participation and public evidence relevant to the category. |
Source: Fact.MR analysis. Updated Jul 28, 2026
How is the market segmented?
-
By Platform:
- Android
- Google Play Applications
- Android Tablets
- iOS
- iPhone Applications
- iPad Applications
- Web-Based
- Browser Applications
- Desktop Access
-
By Application:
- Weight Management
- Calorie Tracking
- Weight Loss Programs
- Healthy Diet Planning
- Meal Planning
- Nutrition Monitoring
- Fitness & Sports Nutrition
- Macro Tracking
- Performance Nutrition
- Medical Nutrition Therapy
- Diabetes Nutrition
- Heart Health Nutrition
- Others
- Pregnancy Nutrition
- Pediatric Nutrition
-
By Subscription Model:
- Freemium
- Free Access
- In-App Purchases
- Premium Subscription
- Monthly Plans
- Annual Plans
- One-Time Purchase
- Lifetime Access
- Premium Features
- Enterprise & Wellness Programs
- Corporate Wellness
- Healthcare Partnerships
-
By End User
- Individual Consumers
- Fitness Enthusiasts
- Weight Management Users
- Healthcare Providers
- Dietitians
- Nutrition Clinics
- Fitness Centers & Trainers
- Gyms
- Personal Trainers
- Corporate Wellness Programs
- Employers
- Insurance Wellness Programs
-
By Feature Type:
- Calorie & Nutrition Tracking
- Food Database
- Barcode Scanning
- Personalized Diet Planning
- AI Meal Recommendations
- Custom Meal Plans
- Fitness Integration
- Wearable Device Sync
- Exercise Tracking
- Health Analytics
- Progress Reports
- Health Score Dashboard
- Others
- Community Support
- Recipe Recommendations
-
By Region:
- North America
- Latin America
- Europe
- East Asia
- South Asia and Oceania
- Middle East and Africa
Frequently Asked Questions
Which Platform leads the Diet Nutrition Apps Market?
Which Application leads the Diet Nutrition Apps Market?
Which Subscription Model leads the Diet Nutrition Apps Market?
Which End User leads the Diet Nutrition Apps Market?
Which Feature Type leads the Diet Nutrition Apps Market?
How does South Korea perform in the Diet Nutrition Apps Market?
How does USA perform in the Diet Nutrition Apps Market?
How does UK perform in the Diet Nutrition Apps Market?
What is the primary driver in the Diet Nutrition Apps Market?
What is the main restraint in the Diet Nutrition Apps Market?
Who worked on this report


Preview the report firsthand - request a free sample
Free SampleGet the brochure for pricing and purchase details
Download PDF