- Market Value (2025): USD 932.0 Mn
- Estimated Value (2026): USD 1001.7 Mn
- Forecast Value (2036): USD 1738.3 Mn
- CAGR (2026-2036): 5.5%
What is the Earl Grey Tea Market forecast to be worth by 2036?
USD 1001.7 million in 2026 to USD 1738.3 million by 2036, at a 5.5% CAGR.
- The market reached USD 932.0 million in 2025.
- Demand is projected to increase from USD 1001.7 million in 2026 to USD 1738.3 million by 2036.
- The market is forecast to record a 5.5% CAGR from 2026 to 2036, creating an absolute opportunity of USD 736.6 million.
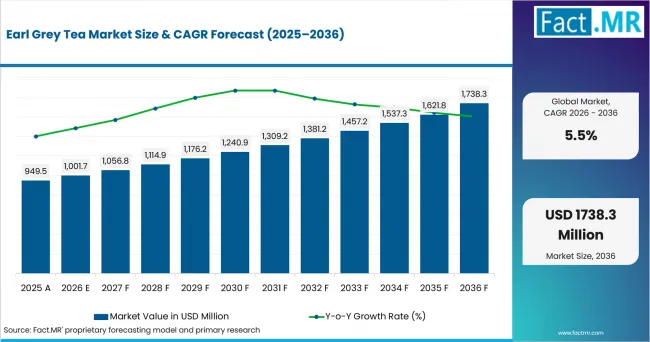
Earl Grey Tea Market Value Analysis | Source: Fact.MR
What are the defining numbers behind Earl Grey Tea Market growth?
USD 736.6 million absolute opportunity is expected between 2026 and 2036.
- Demand Drivers in the Market
- Earl Grey Tea demand is supported by evolving consumer expectations for quality, convenience, and formulation flexibility across the assessed categories.
- Application breadth keeps the market active as buyers match product choice to their specific end use and format requirements.
- Distribution reach, including retail, foodservice and online channels as well as shapes how quickly products reach their intended audiences.
- Supply chain, ingredient sourcing, and processing choices influence price as well as availability and product consistency.
- Key Segments Analyzed
- By Type: Black Tea is the leading type, accounting for 59.7% share in 2026.
- By Application: Indirect leads with 62.7% share in 2026.
- Analyst Opinion at Fact.MR
- Buyer decisions in the earl grey tea market are driven by the fit between product characteristics and the way each category is actually used. Evaluation depends on type, application, format and regional distribution together rather than on any single attribute. Suppliers gain preference when they make that fit clear and keep product performance consistent across the categories they serve. (Source: FAO, 2026)
- Strategic Implications
- Buyers should match product type and application to their operating and end-use needs.
- Suppliers can differentiate by communicating application fit, format choices, and supply reliability.
- Distribution planning should reflect where demand is growing and how channels are shifting.
The UK records the highest country CAGR at 7.4%, followed by Australia at 7.2%. The USA is projected at 7.1%, while Canada advances at 7.0%. Germany is forecast to expand at 5.6% through 2036.
How does the Earl Grey Tea Market break down by segment?
Black Tea leads Type with 59.7% share and Indirect leads Application with 62.7% share in 2026.
Why does Black Tea lead Type?
Black Tea is projected to account for 59.7% share in 2026.
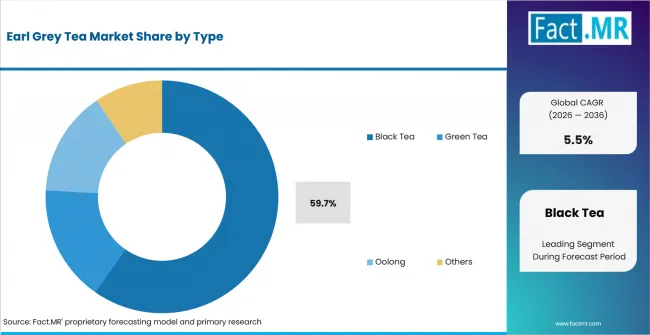
Earl Grey Tea Market Analysis By Type | Source: Fact.MR
Black Tea represents the largest recorded type in the assessed market. Its position reflects established use across the categories served, supported by formulation and format preferences that favor its characteristics. The remaining types serve complementary needs, and their shares vary with application and regional demand. (Source: PubMed/NIH, 2026)
Why does Indirect lead Application?
Indirect is projected to account for 62.7% share in 2026.
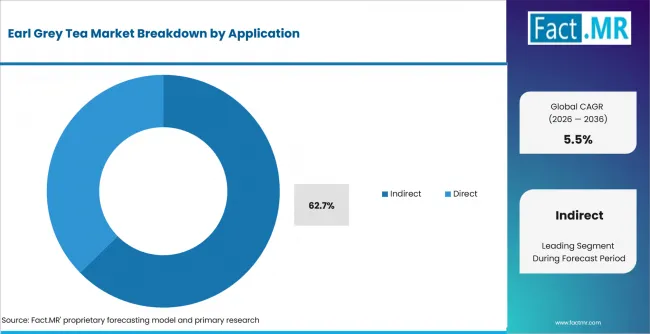
Earl Grey Tea Market Analysis By Application | Source: Fact.MR
Indirect accounts for the largest share of demand within the assessed market. The position reflects the application's scale and recurring purchasing patterns, while other applications contribute meaningful but smaller demand. Buyers continue to evaluate product fit within each application setting. (Source: PubMed/NIH, 2026)
What is accelerating Earl Grey Tea Market adoption, and what is holding it back?
Broader demand for well-matched product options supports adoption, while the need to balance type, application as well as format and cost keeps buying decisions considered rather than automatic. (Source: FAO, 2026)
Drivers Impact Analysis
| DRIVER | (~) % IMPACT ON CAGR | GEOGRAPHIC RELEVANCE | IMPACT TIMELINE |
|---|---|---|---|
| Category breadth | +1.4% | UK, Australia and USA | Short term (<= 2 years) |
| Application fit | +1.1% | Australia, USA and Canada | Short term (<= 2 years) |
| Distribution evolution | +0.8% | UK, Australia and USA | Medium term (2-4 years) |
| Formulation and sourcing | +0.7% | Global sourcing and import-dependent markets | Medium term (2-4 years) |
Source: Fact.MR analysis. Updated Aug 5, 2026
- Category breadth: Earl Grey Tea spans black tea, green tea, and oolong bases. In contrast, tea bags and ready-to-drink formats widen channel access.
- Application fit: Buyers select products aligned to their end use, reinforcing repeat purchasing.
- Distribution evolution: Retail, foodservice, and online routes are broadening access.
- Formulation and sourcing: Processing and sourcing choices support consistency and availability.
Opportunity Impact Analysis
| OPPORTUNITY | (~) % IMPACT ON CAGR | GEOGRAPHIC RELEVANCE | IMPACT TIMELINE |
|---|---|---|---|
| Type and application positioning | +0.9% | UK, Australia and USA | Medium term (2-4 years) |
| Regional distribution expansion | +0.7% | Canada and Germany | Medium term (2-4 years) |
| Format and pack differentiation | +0.6% | USA, Canada and Germany | Long term (>= 4 years) |
Source: Fact.MR analysis. Updated Aug 5, 2026
- Suppliers can connect type and application positioning with clear performance and sourcing information.
- Regional expansion remains open where distribution infrastructure is still developing.
- Product format and pack-size choices offer room for differentiation across channels.
Restraints Impact Analysis
| RESTRAINT | (~) % IMPACT ON CAGR | GEOGRAPHIC RELEVANCE | IMPACT TIMELINE |
|---|---|---|---|
| Input-cost volatility | -1.0% | Global sourcing and import-dependent markets | Short term (<= 2 years) |
| Regulatory and labelling complexity | -0.8% | UK, Australia and USA | Short term (<= 2 years) |
| Established format preferences | -0.6% | Established and price-sensitive markets | Medium term (2-4 years) |
Source: Fact.MR analysis. Updated Aug 5, 2026
- Input price and supply chain variability can affect cost and availability.
- Regulatory and labeling requirements vary by market and can slow entry.
- Established preferences in some applications may limit switching to newer formats.
Which countries are scaling the Earl Grey Tea Market fastest?
Country growth rates differ from the global 5.5% CAGR. The UK, Australia, USA and Canada sit above the global rate. In contrast, Germany is close to it. These rates describe forecast pace; they do not make every country's demand structure identical.
- The UK leads the country set at 7.4% CAGR.
- Australia follows at 7.2% CAGR.
- The USA records 7.1% CAGR.
- Canada advances at 7.0% CAGR.
- Germany expands at 5.6% CAGR.
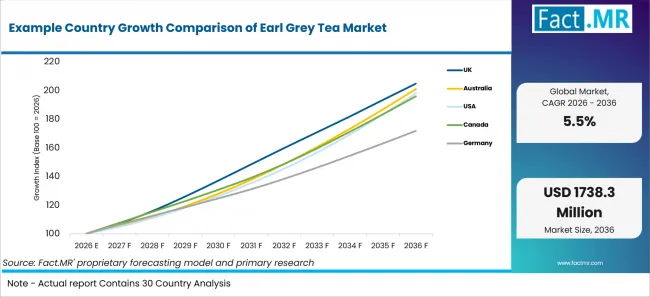
Example Country Growth Comparison Of Earl Grey Tea Market | Source: Fact.MR
| COUNTRY | CAGR, 2026 to 2036 |
|---|---|
| UK | 7.4% |
| Australia | 7.2% |
| USA | 7.1% |
| Canada | 7.0% |
| Germany | 5.6% |
Source: Fact.MR analysis. Updated Aug 5, 2026
What is driving the UK's growth through 2036?
7.4% CAGR through 2036.
The UK is the fastest-growing country. Demand spans the same core decision points seen globally, with type, application and distribution fit shaping purchasing behavior. (Source: FAO, 2026)
What is driving Australia's growth through 2036?
7.2% CAGR through 2036.
Australia records the second-fastest pace. Market activity reflects broad application coverage and continued channel expansion. (Source: FAO, 2026)
What is driving the USA's growth through 2036?
7.1% CAGR through 2036.
The USA advances above the global rate. Buyers evaluate product fit across the defined type and application categories. (Source: FAO, 2026)
What is driving Canada's growth through 2036?
7.0% CAGR through 2036.
Canada also grows faster than the global average, supported by diversified demand across the assessed segments. (Source: FAO, 2026)
What is driving Germany's growth through 2036?
5.6% CAGR through 2036.
Germany's projected pace is closest to the global rate among the listed countries, reflecting a mature but steady demand profile. (Source: FAO, 2026)
Who leads the Earl Grey Tea Market?
The Stash Tea is the largest named company in the assessed set, with 10.7% share. Other listed participants are Bigelow Tea, R.Twining, Mariage Freres as well as Kusmi Tea.
Competition is shaped by how clearly suppliers align their portfolios with type, application, and distribution reach. Buyers are likely to compare product fit, supply reliability, and service rather than rely on a single specification. The named supplier set reflects participation across earl grey tea and related offerings. (Source: FAO, 2026)
Which companies are the key providers?
Key companies include The Stash Tea; Bigelow Tea; R.Twining; Mariage Freres; Kusmi Tea; Adagio Teas; Tetley; TWG Tea. (Source: PubMed/NIH, 2026)
- The Stash Tea
- Bigelow Tea
- R.Twining
- Mariage Freres
- Kusmi Tea
- Adagio Teas
- Tetley
- TWG Tea
Bibliography
- Food and Agriculture Organization of the United Nations. Current Global Market Situation and Medium-Term Outlook for Tea. FAO Intergovernmental Group on Tea, 2024.
- Food and Agriculture Organization of the United Nations. Tea: Markets and Trade. FAO, 2026.
- Food and Agriculture Organization of the United Nations. FAO Intergovernmental Group on Tea. FAO Markets and Trade Division, 2026.
- Food and Agriculture Organization of the United Nations. International Tea Market: Market Situation, Prospects and Emerging Issues. FAO, 2024.
- Food and Agriculture Organization of the United Nations. International Tea Day: Global Tea Production and Consumption. FAO, 2024.
- Lamiquiz-Moneo, I., et al. “Effect of Bergamot on Lipid Profile in Humans: A Systematic Review.” Critical Reviews in Food Science and Nutrition, 2020. PubMed PMID: 31670973.
- Steptoe, A., et al. “The Effects of Tea on Psychophysiological Stress Responsivity and Post-Stress Recovery.” Psychopharmacology, 2007. PubMed PMID: 17013636.
- Twinings. What Is Bergamot and Where Is It Used? Twinings UK. Accessed August 4, 2026.
This Report Answers
- The report provides strategic intelligence on the Earl Grey Tea Market across Type and Application choices that shape tea selection and channel reach.
- Segment analysis covers Black Tea and Indirect as the share leaders within the 2026 market.
- Country outlook evaluates the UK and Australia alongside the USA and Canada. Germany completes the growth comparison across the profiled markets.
- Competitive analysis profiles The Stash Tea and Bigelow Tea alongside R.Twining and Mariage Freres. Kusmi Tea completes the provider view.
- Application assessment covers Indirect and Direct routes. Type review considers Black Tea, Green Tea and Oolong formats.
What does the Earl Grey Tea Market cover?
The market covers earl grey tea products and related offerings across the defined type, application, and region categories. (Source: FAO, 2026)
What is included in the scope?
The scope includes the listed categories and the product formats assessed within them. (Source: PubMed/NIH, 2026)
What is excluded from the scope?
Products and services outside the defined type, application, and region categories are excluded. (Source: FAO, 2026)
How Was the Analysis Built?
The analysis combines structured desk research, company and product mapping, expert validation. Demand-side checks across major regions. (Source: PubMed/NIH, 2026)
- Primary Research: Interviews with buyers, suppliers, integrators and technical specialists test purchasing criteria as well as operating constraints as well as adoption barriers and replacement behavior.
- Desk Research: Public regulatory material, standards, trade information as well as company literature and technical publications establish market boundaries and demand context.
- Market Sizing and Forecasting: Demand indicators, installed-base patterns, replacement cycles as well as application intensity and supplier participation are reconciled across top-down and bottom-up views.
- Data Validation and Update Cycle: Findings are cross-checked across independent evidence routes and reviewed when material market, regulatory, or company changes occur.
Segmentation
What is the report's scope and coverage?
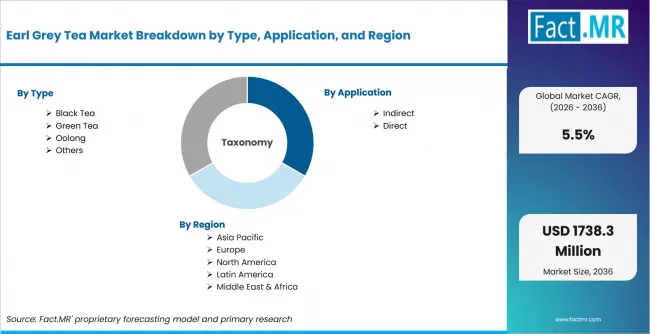
Earl Grey Tea Market Breakdown By Type, Application, And Region | Source: Fact.MR
| Attribute | Details |
|---|---|
| Quantitative Units | USD Million in 2026 to USD Million by 2036, at CAGR |
| Market Definition | Earl Grey Tea products and related offerings across the assessed categories |
| Type | Black Tea; Green Tea; Oolong; Others |
| Application | Indirect; Direct |
| Regions Covered | North America; Latin America; Europe; East Asia; South Asia & Oceania; Middle East & Africa |
| Countries Covered | UK; Australia; USA; Canada; Germany |
| Key Companies Profiled | The Stash Tea; Bigelow Tea; R.Twining; Mariage Freres; Kusmi Tea; Adagio Teas; and others |
| Forecast Period | 2026 to 2036 |
| Approach | Hybrid top-down and bottom-up market assessment |
Source: Fact.MR analysis. Updated Aug 5, 2026
How is the market segmented?
-
By Type:
- Black Tea
- Green Tea
- Oolong
- Others
-
By Application:
- Indirect
- Direct
-
By Region:
- North America
- USA
- Canada
- Latin America
- Europe
- Germany
- UK
- East Asia
- South Asia & Oceania
- Australia
- Middle East & Africa
- North America
Frequently Asked Questions
How big is the Earl Grey Tea Market in 2026?
What is the CAGR of the Earl Grey Tea Market from 2026 to 2036?
Which type leads the Earl Grey Tea Market?
How much will the Earl Grey Tea Market add between 2026 and 2036?
Who are the leading companies in the Earl Grey Tea Market?
Who worked on this report


Preview the report firsthand - request a free sample
Free SampleGet the brochure for pricing and purchase details
Download PDF