Europe Carbon Dioxide Market

Europe Carbon Dioxide Market Analysis, By Production Method, By Delivery Mode, By End-use Industry, and Countries - Market Insights 2025 to 2035

Analysis of Europe Carbon Dioxide Market Covering 30+ Countries Including Analysis of US, Canada, UK, Germany, France, Nordics, GCC countries, Japan, Korea and many more

Europe Carbon Dioxide Market Outlook (2025 to 2035)

The Europe Carbon Dioxide (CO2) Market is projected to grow from USD 451.8 million in 2025 to USD 905.5 million by 2035. During the forecast period 2025 to 2035, the industry is projected to grow at a CAGR of 7.2%, driven by rising demand in food and beverage processing, enhanced oil recovery, and various industrial applications.

An increasing focus on carbon capture and stricter EU emission regulations is further encouraging the adoption of CO₂ recovery technologies. Key markets such as Germany, France, and the Netherlands are leading this shift through robust policy support and industrial innovation.

Metric Value
Industry Size (2025E) USD 451.8 million
Industry Size (2035F) USD 905.5 million
CAGR (2025 to 2035) 7.2%

What are the Drivers of the Europe Carbon Dioxide Market?

The growth of the Europe carbon dioxide market is driven by increasing demand across multiple sectors. In the food and beverage industry, CO₂ is widely used for carbonation, packaging, and preservation, with the rising consumption of processed foods and beverages in countries such as Germany, Italy, and the UK fueling demand. The adoption of carbon capture and storage (CCS) technologies is also accelerating, as industries respond to EU climate goals and invest in emission reduction strategies in regions such as Norway and the Netherlands.

Additionally, the chemical sector is utilizing CO₂ as a raw material for producing urea, methanol, and other compounds, supporting a shift toward sustainable manufacturing. Medical-grade CO₂ is gaining traction due to its role in surgical procedures and diagnostics, aligning with the region’s expanding healthcare infrastructure.

Meanwhile, the growing need for dry ice in cold chain logistics, driven by pharmaceutical and food transportation requirements, is further boosting consumption. These trends, combined with stringent environmental regulations and incentives under the European Green Deal, are generating strong momentum for the carbon dioxide market across the region.

What are the Country Trends of the Europe Carbon Dioxide Market?

Country-specific trends in the European carbon dioxide market reflect a diverse range of industrial priorities, regulatory frameworks, and infrastructure developments across the region.

Germany leads the market, driven by strong demand from its food and beverage, chemical, and industrial gas sectors. The country's commitment to decarbonization, combined with its advanced manufacturing base, has encouraged the adoption of CO₂ recovery and recycling technologies in the chemical and automotive industries.

The United Kingdom is experiencing an increase in CO₂ emissions in healthcare and logistics, primarily driven by the expansion of cold chain networks. The government's focus on achieving carbon neutrality by 2050 is also driving investments in carbon capture and storage (CCS) facilities, including large-scale projects such as the East Coast Cluster.

France continues to integrate CO₂ into various applications, including those in the agricultural, medical, and industrial sectors. The country is promoting circular economy models, where captured CO₂ is increasingly repurposed in greenhouses and bioprocesses. French energy and utility providers are exploring CO₂-based energy storage solutions as part of national energy transition strategies.

The Netherlands has emerged as a key player in carbon utilization, actively developing CCS infrastructure such as the Port of Rotterdam CO₂ Transport Hub and Offshore Storage (Porthos) project. Dutch greenhouses also use captured CO₂ to stimulate plant growth, creating a closed-loop carbon use system.

Italy maintains a steady demand for beverage-grade CO₂ and is expanding capacity to support dry ice production for food exports and pharmaceuticals. Government support for industrial decarbonization and the adoption of clean technology is fostering interest in CO₂ applications across both traditional and emerging sectors.

Norway, though smaller in market volume, plays a strategic role in advancing CCS technology, backed by strong government funding and international collaboration. Projects like Longship and Northern Lights position the country as a hub for cross-border carbon dioxide (CO₂) storage in Europe.

What are the Challenges and Restraining Factors of the Europe Carbon Dioxide Market?

The Europe carbon dioxide market faces challenges and restraining factors that could impact its long-term growth and operational stability.

One primary constraint is the volatile supply chain of raw CO₂, often linked to ammonia production and ethanol plants. Seasonal shutdowns or unexpected production halts, such as the recent closures of fertilizer plants in the UK, have caused CO₂ shortages that disrupt critical sectors, including food processing and healthcare.

High costs associated with carbon capture, purification, and transportation infrastructure present another significant barrier. Despite growing interest in carbon capture and storage (CCS) technologies, upfront capital investments and operational expenses remain substantial, which limits their adoption among small- and medium-sized enterprises (SMEs).

Regulatory fragmentation across Europe also creates operational challenges. Although the European Union promotes unified environmental targets, differing national policies, approval timelines, and permitting frameworks can delay project execution and discourage cross-border collaboration in CO₂ transport and storage.

Limited storage capacity and pipeline infrastructure, especially in Central and Eastern Europe, hinder the scalability of capture and utilization projects. Without sufficient investment in logistics networks, industrial-scale carbon management systems cannot expand effectively.

Technical limitations remain in integrating CO₂ into new chemical and manufacturing processes. Cost-effective, scalable solutions for repurposing CO₂ as feedstock are still lacking, making traditional disposal or emission the default choice.

Finally, public perception and environmental concerns surrounding industrial CO₂ use, in enhanced oil recovery (EOR) or long-term geological storage, are mixed. Building public trust and achieving policy alignment for large-scale carbon projects remains a slow and complex endeavor.

Country-Wise Outlook

Countries CAGR (2025 to 2035)
Germany 7.0%
France 6.3%
Italy 7.3%

Germany Carbon Dioxide Market Sees Shift Toward Industrial Decarbonization and Circular Utilization

Germany's carbon dioxide market is advancing rapidly, driven by a combination of industrial demand, policy frameworks, and the transition to clean energy. The food and beverage sector remains a key consumer, utilizing CO₂ in carbonation, packaging, and preservation processes. Simultaneously, the country's robust chemical and manufacturing base is increasingly integrating CO₂ for applications such as welding, refrigeration, and chemical synthesis.

Germany is also leading in carbon capture and storage (CCS) deployment, with significant public and private investments targeting hard-to-abate sectors, such as steel, cement, and chemicals. Government-backed initiatives, such as carbon contracts for difference, are incentivizing industries to adopt low-carbon production methods. In the energy sector, efforts to phase out coal by 2030 are reshaping the emissions landscape, while revenues from emission trading and stricter CO₂ pricing continue to drive regulatory momentum.

Cross-sector decarbonization is further supported by Germany's ambitious climate targets, which include a 65% reduction in emissions by 2030 and achieving climate neutrality by 2045. Meanwhile, rising CO₂ exports and expanded infrastructure for carbon reuse and transportation underscore the country's growing role in shaping a circular carbon economy within Europe.

France Carbon Dioxide Market Shows Steady Growth Amid Sustainability Push and Industrial Diversification

France’s carbon dioxide market is experiencing steady growth, supported by its well-established agri-food, healthcare, and industrial gas sectors. CO₂ plays a central role in food preservation, beverage carbonation, and modified atmosphere packaging, applications critical to a country known for its large-scale food processing and export-oriented agriculture.

Beyond traditional uses, France is increasingly integrating CO₂ into sustainable industrial practices. Captured carbon is utilized in controlled-environment agriculture, where greenhouses benefit from enhanced crop yields. This aligns with government climate agendas and broader efforts to promote circular resource use. Companies are also exploring CO₂-to-chemicals technologies as part of long-term decarbonization strategies within the chemical and cement industries.

France is among the leading EU members advocating for cross-border carbon transport and utilization, supported by EU Green Deal funding mechanisms. Infrastructure development for CO₂ storage and utilization, particularly in industrial clusters such as Normandy and the Rhône Valley, is gaining momentum. These regions are targeted for integration into larger European carbon management corridors involving Belgium and the Netherlands.

Meanwhile, demand for medical-grade CO₂ remains robust due to its critical role in surgeries, diagnostics, and medical gas systems within large urban healthcare networks. Additionally, the logistics and cold chain industries continue to drive demand for dry ice, essential for temperature-sensitive pharmaceutical and food shipments.

Italy Carbon Dioxide Market Grows on Beverage Strength and Green Recovery Initiatives

Italy’s CO₂ market remains anchored in its beverage and industrial gas sectors, supported by sustained demand from carbonated drink manufacturers and expanded use in modified atmosphere packaging, reflecting the strength of its food export industry. The country has increased dry ice production to support its growing pharmaceutical and seafood logistics sectors, enhancing temperature-controlled transport capabilities.

Beyond traditional applications, Italy is increasingly adopting CO₂-driven sustainability solutions. Greenhouse operators in the Po Valley utilize captured CO₂ to optimize crop yields, while chemical and materials producers pilot CO₂-to-fuel and other utilization technologies under government-supported clean-tech programs. Investments in these pilot projects demonstrate growing interest in integrating carbon capture and reuse within local industrial clusters.

Regulatory support is beginning to influence market dynamics. Accelerated permitting procedures for CCS infrastructure and targeted subsidies for low-carbon manufacturing are attracting attention from mid-sized industrial players. Simultaneously, Italy’s expanding participation in EU carbon networks positions it to benefit from upcoming cross-border CO₂ transport corridors connecting Southern and Central Europe.

Category-wise Analysis

Medium Speed Shredders to Exhibit Leading Share by Production Method

Europe Carbon Dioxide Market Analysis By Production Method

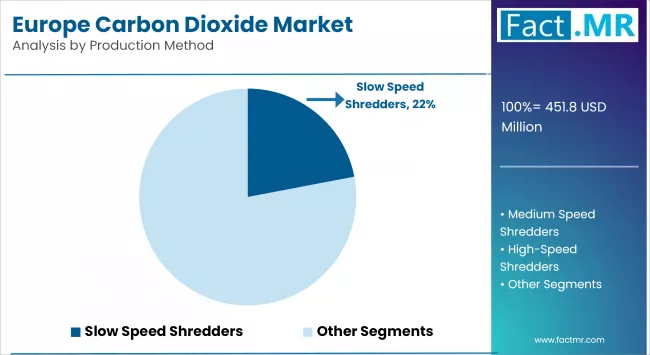
Medium-speed shredders are projected to hold the largest share among production methods, driven by their adaptability across diverse waste streams and balance between energy consumption and output efficiency. These machines effectively process municipal solid waste, construction debris, biomass, and industrial scrap, providing a practical solution for facilities seeking to optimize throughput while minimizing wear and power consumption.

Their ability to deliver consistent particle sizes while minimizing operational downtime has made them the preferred choice for recycling centers and material recovery facilities across Europe and North America. Additionally, medium-speed shredders are increasingly integrated into pre-processing stages for the production of alternative fuels, including refuse-derived fuel (RDF) and solid recovered fuel (SRF), thereby supporting the growing demand for cleaner energy sources in the cement and power generation sectors.

Manufacturers are investing in modular designs and smart automation systems for medium-speed units, further enhancing maintenance ease and process control. This positions medium-speed shredders as a cost-effective and scalable option for waste processing operators, contributing to their continued dominance among production technologies.

Waste Recycling Plants to Exhibit Leading Share by Delivery Mode

Europe Carbon Dioxide Market Analysis By Dlivery Mode

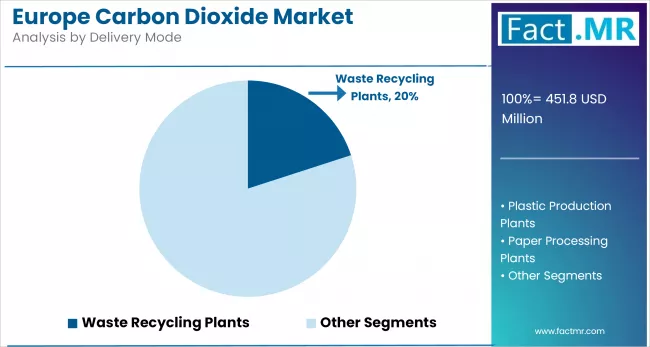
Waste recycling plants are expected to account for the largest share by delivery mode, driven by increasing demand for centralized, high-capacity processing systems. These facilities provide comprehensive waste sorting, shredding, and material recovery solutions, making them crucial to urban waste management strategies and circular economy objectives.

In countries such as Germany, the Netherlands, and Sweden, large-scale recycling plants form the backbone of national waste treatment networks, handling mixed municipal waste, construction debris, industrial scrap, and organic material. Their ability to integrate advanced technologies such as AI-powered sorting, anaerobic digestion, and thermal treatments positions them as an efficient and scalable delivery model compared to mobile or modular systems.

Public and private investment is further reinforcing this trend. The EU’s Waste Framework Directive and funding under the Green Deal are accelerating upgrades and expansions of recycling infrastructure in regions aiming to meet strict landfill diversion and recycling rate targets. Additionally, waste-to-energy integration within these plants is growing, with facilities increasingly equipped to produce biogas, refuse-derived fuel (RDF), or district heating from recovered materials.

Food & Beverages to Hold Leading Share in Europe Carbon Dioxide Market

The food and beverage industry is expected to retain the largest share of the carbon dioxide market in Europe, supported by consistent demand for CO₂ in carbonation, chilling, packaging, and preservation processes. Carbon dioxide plays a vital role in maintaining product shelf life, controlling microbial growth, and ensuring the quality and safety of perishable goods—applications critical to both domestic consumption and export operations.

Major beverage producers across Germany, France, and Italy heavily rely on CO₂ for the production of sparkling water, soft drinks, beer, and wine. Similarly, food manufacturers utilize CO₂ in modified atmosphere packaging (MAP) to prolong the shelf life of products such as meats, dairy products, bakery items, and ready-to-eat meals. As consumer preference for packaged and convenience foods grows across Europe, demand for food-grade carbon dioxide continues to expand.

Seasonal spikes in CO₂ consumption during summer months and holiday periods further reinforce the sector’s reliance on a stable supply. In response, companies are investing in onsite CO₂ capture and storage systems to minimize supply chain disruptions and improve sustainability performance.

Moreover, rising regulatory pressure to reduce food waste and enhance cold chain efficiency is encouraging wider use of CO₂-based technologies, including dry ice logistics for temperature-sensitive transport. Consequently, the food and beverage industry remains the primary driver of carbon dioxide consumption across Europe, with growth supported by both operational necessity and regulatory alignment.

Competitive Analysis

A mix of industrial gas leaders and innovators in carbon management shapes Europe's carbon dioxide market. Major players include Air Liquide S.A., The Linde Group, and The Messer Group GmbH, all offering extensive CO₂ solutions for food, medical, and industrial applications. SOL Spa, Strandmøllen, and ACAIL Gas serve regional markets with tailored gas services.

Emerging companies such as AKER Carbon Capture, Climeworks, and Northern Lights JV DA are advancing carbon capture and storage (CCS) development across Europe. Energy firm Eni S.p.A. is also integrating CO₂ management into its broader decarbonization initiatives. Together, these firms are shaping a market focused on both operational demand and climate-driven innovation.

Recent Development

  • In 2025, Air Liquide announced the expansion of its carbon capture capabilities at its Rotterdam hydrogen production site. The facility is expected to capture up to 800,000 tons of CO₂ annually as part of the Porthos CCS project in the Netherlands.
  • In 2025, Linde signed a long-term agreement with OCI Global to supply clean hydrogen and capture CO₂ at OCI’s blue ammonia plant in the Netherlands. The captured CO₂ will be transported via the Dutch CCS network for offshore storage.

Segmentation of the Europe Carbon Dioxide Market

  • By Production Method :

    • Slow Speed Shredders
    • Medium Speed Shredders
    • High-Speed Shredders
  • By Delivery Mode :

    • Waste Recycling Plants
    • Plastic Production Plants
    • Paper Processing Plants
    • Metal Processing Plants
    • Others
  • By End-use Industry:

    • Metal Manufacturing & Fabrication
    • Food & Beverages
    • Pulp & Paper
    • Oil & Gas
    • Healthcare
    • Chemicals
    • Other Industrial Uses
  • By Countries:

    • Germany
    • Italy
    • France
    • Spain
    • U.K.
    • Russia
    • BENELUX
    • Rest of Europe

Table of Content

  1. Executive Summary
    • Europe Market Outlook
    • Demand-side Trends
    • Supply-side Trends
    • Technology Roadmap Analysis
    • Analysis and Recommendations
  2. Market Overview
    • Market Coverage / Taxonomy
    • Market Definition / Scope / Limitations
  3. Market Background
    • Market Dynamics
      • Drivers
      • Restraints
      • Opportunity
      • Trends
    • Scenario Forecast
      • Demand in Optimistic Scenario
      • Demand in Likely Scenario
      • Demand in Conservative Scenario
    • Opportunity Map Analysis
    • Product Life Cycle Analysis
    • Supply Chain Analysis
      • Supply Side Participants and their Roles
        • Producers
        • Mid-Level Participants (Traders/ Agents/ Brokers)
        • Wholesalers and Distributors
      • Value Added and Value Created at Node in the Supply Chain
      • List of Component Suppliers
      • List of Existing and Potential Buyers
    • Investment Feasibility Matrix
    • Value Chain Analysis
      • Profit Margin Analysis
      • Wholesalers and Distributors
      • Retailers
    • PESTLE and Porter’s Analysis
    • Regulatory Landscape
      • By Key Regions
      • By Key Countries
    • Production and Consumption Statistics
    • Import and Export Statistics
  4. Europe Market Analysis 2020 to 2024 and Forecast, 2025 to 2035
    • Historical Market Size Value (USD Mn) & Volume (Tons) Analysis, 2020 to 2024
    • Current and Future Market Size Value (USD Mn) & Volume (Tons) Projections, 2025 to 2035
      • Y-o-Y Growth Trend Analysis
      • Absolute $ Opportunity Analysis
  5. Europe Market Pricing Analysis 2020 to 2024 and Forecast 2025 to 2035
  6. Europe Market Analysis 2020 to 2024 and Forecast 2025 to 2035, By Production Method
    • Introduction / Key Findings
    • Historical Market Size Value (USD Mn) & Volume (Tons) Analysis By Production Method, 2020 to 2024
    • Current and Future Market Size Value (USD Mn) & Volume (Tons) Analysis and Forecast By Production Method, 2025 to 2035
      • Slow Speed Shredders
      • Medium Speed Shredders
      • High-Speed Shredders
    • Y-o-Y Growth Trend Analysis By Production Method, 2020 to 2024
    • Absolute $ Opportunity Analysis By Production Method, 2025 to 2035
  7. Europe Market Analysis 2020 to 2024 and Forecast 2025 to 2035, By Delivery Mode
    • Introduction / Key Findings
    • Historical Market Size Value (USD Mn) & Volume (Tons) Analysis By Delivery Mode, 2020 to 2024
    • Current and Future Market Size Value (USD Mn) & Volume (Tons) Analysis and Forecast By Delivery Mode, 2025 to 2035
      • Waste Recycling Plants
      • Plastic Production Plants
      • Paper Processing Plants
      • Metal Processing Plants
      • Others
    • Y-o-Y Growth Trend Analysis By Delivery Mode, 2020 to 2024
    • Absolute $ Opportunity Analysis By Delivery Mode, 2025 to 2035
  8. Europe Market Analysis 2020 to 2024 and Forecast 2025 to 2035, By End-use Industry
    • Introduction / Key Findings
    • Historical Market Size Value (USD Mn) & Volume (Tons) Analysis By End-use Industry, 2020 to 2024
    • Current and Future Market Size Value (USD Mn) & Volume (Tons) Analysis and Forecast By End-use Industry, 2025 to 2035
      • Metal Manufacturing & Fabrication
      • Food & Beverages
      • Pulp & Paper
      • Oil & Gas
      • Healthcare
      • Chemicals
      • Other Industrial Uses
    • Y-o-Y Growth Trend Analysis By End-use Industry, 2020 to 2024
    • Absolute $ Opportunity Analysis By End-use Industry, 2025 to 2035
  9. Europe Market Analysis 2020 to 2024 and Forecast 2025 to 2035, By Region
    • Introduction
    • Historical Market Size Value (USD Mn) & Volume (Tons) Analysis By Region, 2020 to 2024
    • Current Market Size Value (USD Mn) & Volume (Tons) Analysis and Forecast By Region, 2025 to 2035
      • North America
      • Latin America
      • Western Europe
      • East Asia
      • South Asia Pacific
      • Eastern Europe
      • Middle East & Africa
    • Market Attractiveness Analysis By Region
  10. North America Market Analysis 2020 to 2024 and Forecast 2025 to 2035, By Country
    • Historical Market Size Value (USD Mn) & Volume (Tons) Trend Analysis By Market Taxonomy, 2020 to 2024
    • Market Size Value (USD Mn) & Volume (Tons) Forecast By Market Taxonomy, 2025 to 2035
      • By Country
        • U.S.
        • Canada
        • Mexico
      • By Production Method
      • By Delivery Mode
      • By End-use Industry
    • Market Attractiveness Analysis
      • By Country
      • By Production Method
      • By Delivery Mode
      • By End-use Industry
    • Key Takeaways
  11. Latin America Market Analysis 2020 to 2024 and Forecast 2025 to 2035, By Country
    • Historical Market Size Value (USD Mn) & Volume (Tons) Trend Analysis By Market Taxonomy, 2020 to 2024
    • Market Size Value (USD Mn) & Volume (Tons) Forecast By Market Taxonomy, 2025 to 2035
      • By Country
        • Brazil
        • Chile
        • Rest of Latin America
      • By Production Method
      • By Delivery Mode
      • By End-use Industry
    • Market Attractiveness Analysis
      • By Country
      • By Production Method
      • By Delivery Mode
      • By End-use Industry
    • Key Takeaways
  12. Western Europe Market Analysis 2020 to 2024 and Forecast 2025 to 2035, By Country
    • Historical Market Size Value (USD Mn) & Volume (Tons) Trend Analysis By Market Taxonomy, 2020 to 2024
    • Market Size Value (USD Mn) & Volume (Tons) Forecast By Market Taxonomy, 2025 to 2035
      • By Country
        • Germany
        • Italy
        • France
        • U.K.
        • Spain
        • Russia
        • BENELUX
        • Rest of Europe
      • By Production Method
      • By Delivery Mode
      • By End-use Industry
    • Market Attractiveness Analysis
      • By Country
      • By Production Method
      • By Delivery Mode
      • By End-use Industry
    • Key Takeaways
  13. East Asia Market Analysis 2020 to 2024 and Forecast 2025 to 2035, By Country
    • Historical Market Size Value (USD Mn) & Volume (Tons) Trend Analysis By Market Taxonomy, 2020 to 2024
    • Market Size Value (USD Mn) & Volume (Tons) Forecast By Market Taxonomy, 2025 to 2035
      • By Country
        • China
        • Japan
        • South Korea
      • By Production Method
      • By Delivery Mode
      • By End-use Industry
    • Market Attractiveness Analysis
      • By Country
      • By Production Method
      • By Delivery Mode
      • By End-use Industry
    • Key Takeaways
  14. South Asia Pacific Market Analysis 2020 to 2024 and Forecast 2025 to 2035, By Country
    • Historical Market Size Value (USD Mn) & Volume (Tons) Trend Analysis By Market Taxonomy, 2020 to 2024
    • Market Size Value (USD Mn) & Volume (Tons) Forecast By Market Taxonomy, 2025 to 2035
      • By Country
        • India
        • ASEAN Countries
        • Australia & New Zealand
        • Rest of South Asia Pacific
      • By Production Method
      • By Delivery Mode
      • By End-use Industry
    • Market Attractiveness Analysis
      • By Country
      • By Production Method
      • By Delivery Mode
      • By End-use Industry
    • Key Takeaways
  15. Eastern Europe Market Analysis 2020 to 2024 and Forecast 2025 to 2035, By Country
    • Historical Market Size Value (USD Mn) & Volume (Tons) Trend Analysis By Market Taxonomy, 2020 to 2024
    • Market Size Value (USD Mn) & Volume (Tons) Forecast By Market Taxonomy, 2025 to 2035
      • By Country
        • Russia
        • Poland
        • Hungary
        • Balkan & Baltics
        • Rest of Eastern Europe
      • By Production Method
      • By Delivery Mode
      • By End-use Industry
    • Market Attractiveness Analysis
      • By Country
      • By Production Method
      • By Delivery Mode
      • By End-use Industry
    • Key Takeaways
  16. Middle East & Africa Market Analysis 2020 to 2024 and Forecast 2025 to 2035, By Country
    • Historical Market Size Value (USD Mn) & Volume (Tons) Trend Analysis By Market Taxonomy, 2020 to 2024
    • Market Size Value (USD Mn) & Volume (Tons) Forecast By Market Taxonomy, 2025 to 2035
      • By Country
        • KSA
        • Other GCC Countries
        • Turkiye
        • South Africa
        • Rest of MEA
      • By Production Method
      • By Delivery Mode
      • By End-use Industry
    • Market Attractiveness Analysis
      • By Country
      • By Production Method
      • By Delivery Mode
      • By End-use Industry
    • Key Takeaways
  17. Key Countries Market Analysis
    • Germany
      • Pricing Analysis
      • Market Share Analysis, 2024
        • By Production Method
        • By Delivery Mode
        • By End-use Industry
    • Italy
      • Pricing Analysis
      • Market Share Analysis, 2024
        • By Production Method
        • By Delivery Mode
        • By End-use Industry
    • France
      • Pricing Analysis
      • Market Share Analysis, 2024
        • By Production Method
        • By Delivery Mode
        • By End-use Industry
    • Spain
      • Pricing Analysis
      • Market Share Analysis, 2024
        • By Production Method
        • By Delivery Mode
        • By End-use Industry
    • Value (USD Mn) & Volume (Tons)ed Kingdom
      • Pricing Analysis
      • Market Share Analysis, 2024
        • By Production Method
        • By Delivery Mode
        • By End-use Industry
  18. Market Structure Analysis
    • Competition Dashboard
    • Competition Benchmarking
    • Market Share Analysis of Top Players
      • By Regional
      • By Production Method
      • By Delivery Mode
      • By End-use Industry
  19. Competition Analysis
    • Competition Deep Dive
      • Air Liquide S.A.
        • Overview
        • Product Portfolio
        • Profitability by Market Segments (Product/Age /Sales Channel/Region)
        • Sales Footprint
        • Strategy Overview
          • Marketing Strategy
          • Product Strategy
          • Channel Strategy
      • The Linde Group
        • Overview
        • Product Portfolio
        • Profitability by Market Segments (Product/Age /Sales Channel/Region)
        • Sales Footprint
        • Strategy Overview
          • Marketing Strategy
          • Product Strategy
          • Channel Strategy
      • The Messer Group GmbH
        • Overview
        • Product Portfolio
        • Profitability by Market Segments (Product/Age /Sales Channel/Region)
        • Sales Footprint
        • Strategy Overview
          • Marketing Strategy
          • Product Strategy
          • Channel Strategy
  20. Assumptions & Acronyms Used
  21. Research Methodology

List Of Table

  • Table 1: Europe Market Value (USD Mn) Forecast by Region, 2020 to 2035
  • Table 2: Europe Market Volume (Tons) Forecast by Region, 2020 to 2035
  • Table 3: Europe Market Value (USD Mn) Forecast by Production Method, 2020 to 2035
  • Table 4: Europe Market Volume (Tons) Forecast by Production Method, 2020 to 2035
  • Table 5: Europe Market Value (USD Mn) Forecast by Delivery Mode, 2020 to 2035
  • Table 6: Europe Market Volume (Tons) Forecast by Delivery Mode, 2020 to 2035
  • Table 7: Europe Market Value (USD Mn) Forecast by End-use Industry, 2020 to 2035
  • Table 8: Europe Market Volume (Tons) Forecast by End-use Industry, 2020 to 2035
  • Table 9: North America Market Value (USD Mn) Forecast by Country, 2020 to 2035
  • Table 10: North America Market Volume (Tons) Forecast by Country, 2020 to 2035
  • Table 11: North America Market Value (USD Mn) Forecast by Production Method, 2020 to 2035
  • Table 12: North America Market Volume (Tons) Forecast by Production Method, 2020 to 2035
  • Table 13: North America Market Value (USD Mn) Forecast by Delivery Mode, 2020 to 2035
  • Table 14: North America Market Volume (Tons) Forecast by Delivery Mode, 2020 to 2035
  • Table 15: North America Market Value (USD Mn) Forecast by End-use Industry, 2020 to 2035
  • Table 16: North America Market Volume (Tons) Forecast by End-use Industry, 2020 to 2035
  • Table 17: Latin America Market Value (USD Mn) Forecast by Country, 2020 to 2035
  • Table 18: Latin America Market Volume (Tons) Forecast by Country, 2020 to 2035
  • Table 19: Latin America Market Value (USD Mn) Forecast by Production Method, 2020 to 2035
  • Table 20: Latin America Market Volume (Tons) Forecast by Production Method, 2020 to 2035
  • Table 21: Latin America Market Value (USD Mn) Forecast by Delivery Mode, 2020 to 2035
  • Table 22: Latin America Market Volume (Tons) Forecast by Delivery Mode, 2020 to 2035
  • Table 23: Latin America Market Value (USD Mn) Forecast by End-use Industry, 2020 to 2035
  • Table 24: Latin America Market Volume (Tons) Forecast by End-use Industry, 2020 to 2035
  • Table 25: Western Europe Market Value (USD Mn) Forecast by Country, 2020 to 2035
  • Table 26: Western Europe Market Volume (Tons) Forecast by Country, 2020 to 2035
  • Table 27: Western Europe Market Value (USD Mn) Forecast by Production Method, 2020 to 2035
  • Table 28: Western Europe Market Volume (Tons) Forecast by Production Method, 2020 to 2035
  • Table 29: Western Europe Market Value (USD Mn) Forecast by Delivery Mode, 2020 to 2035
  • Table 30: Western Europe Market Volume (Tons) Forecast by Delivery Mode, 2020 to 2035
  • Table 31: Western Europe Market Value (USD Mn) Forecast by End-use Industry, 2020 to 2035
  • Table 32: Western Europe Market Volume (Tons) Forecast by End-use Industry, 2020 to 2035
  • Table 33: East Asia Market Value (USD Mn) Forecast by Country, 2020 to 2035
  • Table 34: East Asia Market Volume (Tons) Forecast by Country, 2020 to 2035
  • Table 35: East Asia Market Value (USD Mn) Forecast by Production Method, 2020 to 2035
  • Table 36: East Asia Market Volume (Tons) Forecast by Production Method, 2020 to 2035
  • Table 37: East Asia Market Value (USD Mn) Forecast by Delivery Mode, 2020 to 2035
  • Table 38: East Asia Market Volume (Tons) Forecast by Delivery Mode, 2020 to 2035
  • Table 39: East Asia Market Value (USD Mn) Forecast by End-use Industry, 2020 to 2035
  • Table 40: East Asia Market Volume (Tons) Forecast by End-use Industry, 2020 to 2035
  • Table 41: South Asia Pacific Market Value (USD Mn) Forecast by Country, 2020 to 2035
  • Table 42: South Asia Pacific Market Volume (Tons) Forecast by Country, 2020 to 2035
  • Table 43: South Asia Pacific Market Value (USD Mn) Forecast by Production Method, 2020 to 2035
  • Table 44: South Asia Pacific Market Volume (Tons) Forecast by Production Method, 2020 to 2035
  • Table 45: South Asia Pacific Market Value (USD Mn) Forecast by Delivery Mode, 2020 to 2035
  • Table 46: South Asia Pacific Market Volume (Tons) Forecast by Delivery Mode, 2020 to 2035
  • Table 47: South Asia Pacific Market Value (USD Mn) Forecast by End-use Industry, 2020 to 2035
  • Table 48: South Asia Pacific Market Volume (Tons) Forecast by End-use Industry, 2020 to 2035
  • Table 49: Eastern Europe Market Value (USD Mn) Forecast by Country, 2020 to 2035
  • Table 50: Eastern Europe Market Volume (Tons) Forecast by Country, 2020 to 2035
  • Table 51: Eastern Europe Market Value (USD Mn) Forecast by Production Method, 2020 to 2035
  • Table 52: Eastern Europe Market Volume (Tons) Forecast by Production Method, 2020 to 2035
  • Table 53: Eastern Europe Market Value (USD Mn) Forecast by Delivery Mode, 2020 to 2035
  • Table 54: Eastern Europe Market Volume (Tons) Forecast by Delivery Mode, 2020 to 2035
  • Table 55: Eastern Europe Market Value (USD Mn) Forecast by End-use Industry, 2020 to 2035
  • Table 56: Eastern Europe Market Volume (Tons) Forecast by End-use Industry, 2020 to 2035
  • Table 57: Middle East & Africa Market Value (USD Mn) Forecast by Country, 2020 to 2035
  • Table 58: Middle East & Africa Market Volume (Tons) Forecast by Country, 2020 to 2035
  • Table 59: Middle East & Africa Market Value (USD Mn) Forecast by Production Method, 2020 to 2035
  • Table 60: Middle East & Africa Market Volume (Tons) Forecast by Production Method, 2020 to 2035
  • Table 61: Middle East & Africa Market Value (USD Mn) Forecast by Delivery Mode, 2020 to 2035
  • Table 62: Middle East & Africa Market Volume (Tons) Forecast by Delivery Mode, 2020 to 2035
  • Table 63: Middle East & Africa Market Value (USD Mn) Forecast by End-use Industry, 2020 to 2035
  • Table 64: Middle East & Africa Market Volume (Tons) Forecast by End-use Industry, 2020 to 2035

List Of Figures

  • Figure 1: Europe Market Volume (Tons) Forecast 2020 to 2035
  • Figure 2: Europe Market Pricing Analysis
  • Figure 3: Europe Market Value (USD Mn) Forecast 2020 to 2035
  • Figure 4: Europe Market Value Share and BPS Analysis by Production Method, 2025 and 2035
  • Figure 5: Europe Market Y-o-Y Growth Comparison by Production Method, 2025 to 2035
  • Figure 6: Europe Market Attractiveness Analysis by Production Method
  • Figure 7: Europe Market Value Share and BPS Analysis by Delivery Mode, 2025 and 2035
  • Figure 8: Europe Market Y-o-Y Growth Comparison by Delivery Mode, 2025 to 2035
  • Figure 9: Europe Market Attractiveness Analysis by Delivery Mode
  • Figure 10: Europe Market Value Share and BPS Analysis by End-use Industry, 2025 and 2035
  • Figure 11: Europe Market Y-o-Y Growth Comparison by End-use Industry, 2025 to 2035
  • Figure 12: Europe Market Attractiveness Analysis by End-use Industry
  • Figure 13: Europe Market Value (USD Mn) Share and BPS Analysis by Region, 2025 and 2035
  • Figure 14: Europe Market Y-o-Y Growth Comparison by Region, 2025 to 2035
  • Figure 15: Europe Market Attractiveness Analysis by Region
  • Figure 16: North America Market Incremental $ Opportunity, 2025 to 2035
  • Figure 17: Latin America Market Incremental $ Opportunity, 2025 to 2035
  • Figure 18: Western Europe Market Incremental $ Opportunity, 2025 to 2035
  • Figure 19: East Asia Market Incremental $ Opportunity, 2025 to 2035
  • Figure 20: South Asia Pacific Market Incremental $ Opportunity, 2025 to 2035
  • Figure 21: Eastern Europe Market Incremental $ Opportunity, 2025 to 2035
  • Figure 22: Middle East & Africa Market Incremental $ Opportunity, 2025 to 2035
  • Figure 23: North America Market Value Share and BPS Analysis by Country, 2025 and 2035
  • Figure 24: North America Market Value Share and BPS Analysis by Production Method, 2025 and 2035
  • Figure 25: North America Market Y-o-Y Growth Comparison by Production Method, 2025 to 2035
  • Figure 26: North America Market Attractiveness Analysis by Production Method
  • Figure 27: North America Market Value Share and BPS Analysis by Delivery Mode, 2025 and 2035
  • Figure 28: North America Market Y-o-Y Growth Comparison by Delivery Mode, 2025 to 2035
  • Figure 29: North America Market Attractiveness Analysis by Delivery Mode
  • Figure 30: North America Market Value Share and BPS Analysis by End-use Industry, 2025 and 2035
  • Figure 31: North America Market Y-o-Y Growth Comparison by End-use Industry, 2025 to 2035
  • Figure 32: North America Market Attractiveness Analysis by End-use Industry
  • Figure 33: Latin America Market Value Share and BPS Analysis by Country, 2025 and 2035
  • Figure 34: Latin America Market Value Share and BPS Analysis by Production Method, 2025 and 2035
  • Figure 35: Latin America Market Y-o-Y Growth Comparison by Production Method, 2025 to 2035
  • Figure 36: Latin America Market Attractiveness Analysis by Production Method
  • Figure 37: Latin America Market Value Share and BPS Analysis by Delivery Mode, 2025 and 2035
  • Figure 38: Latin America Market Y-o-Y Growth Comparison by Delivery Mode, 2025 to 2035
  • Figure 39: Latin America Market Attractiveness Analysis by Delivery Mode
  • Figure 40: Latin America Market Value Share and BPS Analysis by End-use Industry, 2025 and 2035
  • Figure 41: Latin America Market Y-o-Y Growth Comparison by End-use Industry, 2025 to 2035
  • Figure 42: Latin America Market Attractiveness Analysis by End-use Industry
  • Figure 43: Western Europe Market Value Share and BPS Analysis by Country, 2025 and 2035
  • Figure 44: Western Europe Market Value Share and BPS Analysis by Production Method, 2025 and 2035
  • Figure 45: Western Europe Market Y-o-Y Growth Comparison by Production Method, 2025 to 2035
  • Figure 46: Western Europe Market Attractiveness Analysis by Production Method
  • Figure 47: Western Europe Market Value Share and BPS Analysis by Delivery Mode, 2025 and 2035
  • Figure 48: Western Europe Market Y-o-Y Growth Comparison by Delivery Mode, 2025 to 2035
  • Figure 49: Western Europe Market Attractiveness Analysis by Delivery Mode
  • Figure 50: Western Europe Market Value Share and BPS Analysis by End-use Industry, 2025 and 2035
  • Figure 51: Western Europe Market Y-o-Y Growth Comparison by End-use Industry, 2025 to 2035
  • Figure 52: Western Europe Market Attractiveness Analysis by End-use Industry
  • Figure 53: East Asia Market Value Share and BPS Analysis by Country, 2025 and 2035
  • Figure 54: East Asia Market Value Share and BPS Analysis by Production Method, 2025 and 2035
  • Figure 55: East Asia Market Y-o-Y Growth Comparison by Production Method, 2025 to 2035
  • Figure 56: East Asia Market Attractiveness Analysis by Production Method
  • Figure 57: East Asia Market Value Share and BPS Analysis by Delivery Mode, 2025 and 2035
  • Figure 58: East Asia Market Y-o-Y Growth Comparison by Delivery Mode, 2025 to 2035
  • Figure 59: East Asia Market Attractiveness Analysis by Delivery Mode
  • Figure 60: East Asia Market Value Share and BPS Analysis by End-use Industry, 2025 and 2035
  • Figure 61: East Asia Market Y-o-Y Growth Comparison by End-use Industry, 2025 to 2035
  • Figure 62: East Asia Market Attractiveness Analysis by End-use Industry
  • Figure 63: South Asia Pacific Market Value Share and BPS Analysis by Country, 2025 and 2035
  • Figure 64: South Asia Pacific Market Value Share and BPS Analysis by Production Method, 2025 and 2035
  • Figure 65: South Asia Pacific Market Y-o-Y Growth Comparison by Production Method, 2025 to 2035
  • Figure 66: South Asia Pacific Market Attractiveness Analysis by Production Method
  • Figure 67: South Asia Pacific Market Value Share and BPS Analysis by Delivery Mode, 2025 and 2035
  • Figure 68: South Asia Pacific Market Y-o-Y Growth Comparison by Delivery Mode, 2025 to 2035
  • Figure 69: South Asia Pacific Market Attractiveness Analysis by Delivery Mode
  • Figure 70: South Asia Pacific Market Value Share and BPS Analysis by End-use Industry, 2025 and 2035
  • Figure 71: South Asia Pacific Market Y-o-Y Growth Comparison by End-use Industry, 2025 to 2035
  • Figure 72: South Asia Pacific Market Attractiveness Analysis by End-use Industry
  • Figure 73: Eastern Europe Market Value Share and BPS Analysis by Country, 2025 and 2035
  • Figure 74: Eastern Europe Market Value Share and BPS Analysis by Production Method, 2025 and 2035
  • Figure 75: Eastern Europe Market Y-o-Y Growth Comparison by Production Method, 2025 to 2035
  • Figure 76: Eastern Europe Market Attractiveness Analysis by Production Method
  • Figure 77: Eastern Europe Market Value Share and BPS Analysis by Delivery Mode, 2025 and 2035
  • Figure 78: Eastern Europe Market Y-o-Y Growth Comparison by Delivery Mode, 2025 to 2035
  • Figure 79: Eastern Europe Market Attractiveness Analysis by Delivery Mode
  • Figure 80: Eastern Europe Market Value Share and BPS Analysis by End-use Industry, 2025 and 2035
  • Figure 81: Eastern Europe Market Y-o-Y Growth Comparison by End-use Industry, 2025 to 2035
  • Figure 82: Eastern Europe Market Attractiveness Analysis by End-use Industry
  • Figure 83: Middle East & Africa Market Value Share and BPS Analysis by Country, 2025 and 2035
  • Figure 84: Middle East & Africa Market Value Share and BPS Analysis by Production Method, 2025 and 2035
  • Figure 85: Middle East & Africa Market Y-o-Y Growth Comparison by Production Method, 2025 to 2035
  • Figure 86: Middle East & Africa Market Attractiveness Analysis by Production Method
  • Figure 87: Middle East & Africa Market Value Share and BPS Analysis by Delivery Mode, 2025 and 2035
  • Figure 88: Middle East & Africa Market Y-o-Y Growth Comparison by Delivery Mode, 2025 to 2035
  • Figure 89: Middle East & Africa Market Attractiveness Analysis by Delivery Mode
  • Figure 90: Middle East & Africa Market Value Share and BPS Analysis by End-use Industry, 2025 and 2035
  • Figure 91: Middle East & Africa Market Y-o-Y Growth Comparison by End-use Industry, 2025 to 2035
  • Figure 92: Middle East & Africa Market Attractiveness Analysis by End-use Industry
  • Figure 93: Europe Market – Tier Structure Analysis
  • Figure 94: Europe Market – Company Share Analysis

- FAQs -

What is the Global Europe Carbon Dioxide Market Size in 2025?

The Europe Carbon Dioxide market is valued at USD 451.8 million in 2025.

Who are the Major Players Operating in the Europe Carbon Dioxide Market?

Prominent players in the Europe Carbon Dioxide market include Air Liquide S.A., The Linde Group, and The Messer Group GmbH. And others.

What is the Estimated Valuation of the Europe Carbon Dioxide Market by 2035?

The Europe Carbon Dioxide market is expected to reach a valuation of USD 905.5 million by 2035.

What Value CAGR Did the Europe Carbon Dioxide Market Exhibit over the Last Five Years?

The historic growth rate of the Europe Carbon Dioxide market was 5.1% from 2020 to 2024.

Europe Carbon Dioxide Market

Schedule a Call