- Market Value (2025): USD 74.6 Mn
- Estimated Value (2026): USD 82.0 Mn
- Forecast Value (2036): USD 210.0 Mn
- CAGR (2026-2036): 9.9%
What is the Expo Waste Sorting Stations Market forecast to be worth by 2036?
USD 82.0 million in 2026 to USD 210.0 million by 2036, at a 9.9% CAGR.
- The market reached USD 74.6 million in 2025 as buyers increased spending on venue waste-diversion commitments and organizer sustainability reporting.
- Demand is projected to rise from USD 82.0 million in 2026 to USD 210.0 million by 2036.
- The market is forecast to record a 9.9% CAGR from 2026 to 2036 as venue waste-diversion commitments, sponsor-funded green programs and rising food-service waste influence purchasing.
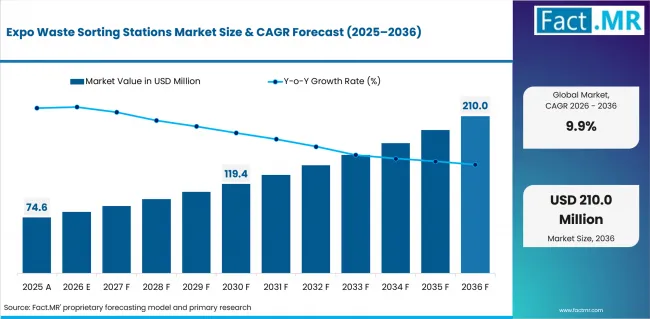
Expo Waste Sorting Stations Market Value Analysis | Source: Fact.MR
What are the defining numbers behind Expo Waste Sorting Stations Market growth?
USD 128.0 million absolute opportunity is expected by 2036.
- Demand Drivers in the Market
- Venue waste-diversion commitments: Venues are replacing single-bin setups with clearly marked recycling, compost and general-waste stations because mixed collection weakens the value of recovered material. The US Environmental Protection Agency notes that source separation produces cleaner feedstock by reducing contamination.
- Organizer sustainability reporting: Waste stations become easier to fund when organisers must report what was generated, separated and diverted after an event. UFI’s work on exhibition waste management treats measurement, contractor coordination and operational planning as industry issues, not simply housekeeping tasks. This supports demand for stations that give organisers a consistent collection structure across repeated shows.
- Sponsor-funded green programs: Sponsors are more likely to support visible waste initiatives when the installation has a clear function and a result that can be documented. Dubai World Trade Centre reports the use of recycling, waste segregation and visitor-awareness measures within its event operations. Branded sorting stations fit this model because they give sponsors a visible presence while helping the venue separate material at the point where waste is discarded.
- Rising food-service waste: Exhibitions with catering generate cups, packaging, leftover food and other materials that should not enter one mixed stream. WRAP’s Food Waste Reduction Roadmap is built around measuring waste and acting on the findings, while the EPA places composting above disposal in its waste-management hierarchy. This pushes event teams to specify separate openings and containers for food waste, recyclables and residual waste before the event begins.
- Key Segments Analyzed
- By Station Type: Three-stream stations is anticipated to capture 35.0% share in 2026. The share is supported by its fit with stream clarity, placement and downstream compatibility with the venue waste contractor.
- By Waste Stream: Recycling is forecast to represent 31.0% share in 2026. Buyer preference is shaped by its fit with stream clarity, placement and downstream compatibility with the venue waste contractor.
- By Material: Recycled plastic is estimated to command 27.0% share in 2026. The segment benefits from its fit with stream clarity, placement and downstream compatibility with the venue waste contractor.
- By Buyer: Convention centers is projected to hold 30.0% share in 2026. This position reflects its fit with stream clarity, placement and downstream compatibility with the venue waste contractor.
- By Service Model: Equipment sale is expected to account for 24.0% share in 2026. Its lead comes from its fit with stream clarity, placement and downstream compatibility with the venue waste contractor.
- Analyst Opinion at Fact.MR
- "A credible Expo Waste Sorting Stations Market offer must make stream clarity, placement and downstream compatibility with the venue waste contractor verifiable. Approval becomes easier when the supplier states how turning attendee disposal behavior into clean material streams under crowded event conditions will be monitored. Trust comes from a clear operating record, not a longer feature list”, says Shambhu Nath Jha, Sr. Consultant, Fact.MR.
- Strategic Implications
- Event buyers: Labels should reflect the cups, trays, packaging and food-service items actually used at the event, as well as the materials accepted by the local waste contractor. The US Environmental Protection Agency advises checking local recycling rules because accepted materials differ by area and incorrect items can contaminate an entire load. Buyers should therefore approve the station layout only after the supplier has matched each opening and label to the venue’s collection route.
- Suppliers: Suppliers should state who will deliver, position, inspect, clean and remove each station, rather than presenting bins, signs and sensors as a single product package. ISO 20121 places procurement, supply-chain management and operating procedures within event sustainability planning. A clear division of responsibility helps buyers compare offers and prevents useful equipment from failing because installation or maintenance was left to an unidentified contractor.
- Venue and agency teams: A station that works during a quiet demonstration may perform differently at a crowded exhibition entrance, food court or closing-time rush. EPA guidance for public venues recommends adapting bin selection to the people and location involved and closely monitoring contamination when a programme begins. Venue teams should therefore test placement and signage under several event conditions before adopting one layout across the site.
The UAE follows at 10.6%, supported by a busy international events calendar and high venue throughput. The USA is projected to grow in line with the global market at 9.9%. Japan remains close behind at 9.8%, while the UK and Germany are expected to advance at 9.6% and 9.3%, respectively. The relatively narrow spread shows that demand is building across both fast-growing event destinations and established exhibition markets, although the pace of venue upgrades and waste-management requirements differs by country.
How does the Expo Waste Sorting Stations Market break down by segment?
Three-stream stations lead Station Type at 35.0%, while Recycling hold the largest Waste Stream share at 31.0% in 2026.
Why do Three-stream stations lead Station Type?
Three-stream stations are projected to account for 35.0% share in 2026.
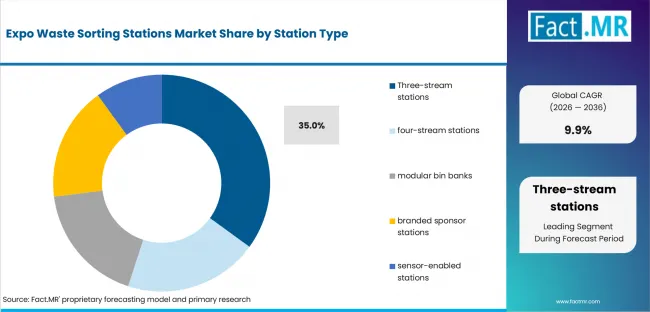
Expo Waste Sorting Stations Market Analysis By Station Type | Source: Fact.MR
Demand favors Three-stream stations where event teams must control turning attendee disposal behavior into clean material streams under crowded event conditions under short setup windows. The segment works because paired openings, visual prompts and matched containers guide waste into defined streams at the point of disposal. Its share is reinforced by venue waste-diversion commitments, although visitor confusion can reduce the advantage. Buyers compare suppliers through stream clarity, placement and downstream compatibility with the venue waste contractor.
Why does Recycling lead Waste Stream?
Recycling are projected to account for 31.0% share in 2026.
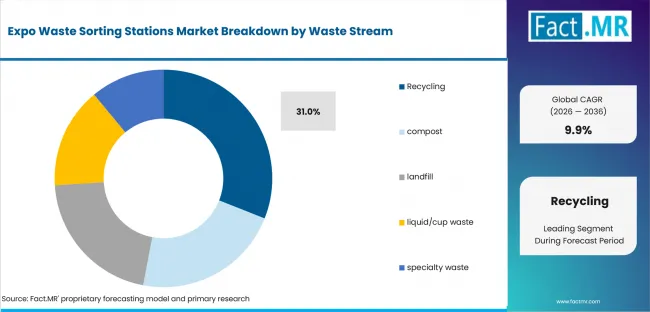
Expo Waste Sorting Stations Market Analysis By Waste Stream | Source: Fact.MR
Within Waste Stream, Recycling are selected when the event specification gives priority to organizer sustainability reporting. Their operating logic follows paired openings, visual prompts and matched containers guide waste into defined streams at the point of disposal. This helps teams manage turning attendee disposal behavior into clean material streams under crowded event conditions without relying on improvised site decisions. Standardized venue signage can extend the value, but the purchase still turns on stream clarity, placement and downstream compatibility with the venue waste contractor.
Why does Recycled plastic lead Material?
Recycled plastic are projected to account for 27.0% share in 2026.
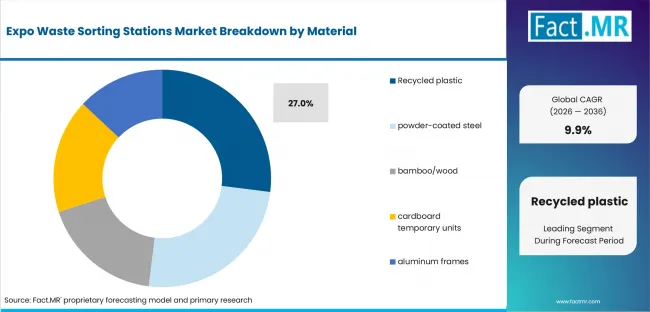
Expo Waste Sorting Stations Market Analysis By Material | Source: Fact.MR
For Material, Recycled plastic give buyers the clearest route to manage turning attendee disposal behavior into clean material streams under crowded event conditions. The segment relies on this operating principle: paired openings, visual prompts and matched containers guide waste into defined streams at the point of disposal. Sponsor-funded green programs supports the purchase case, and managed sorting and reporting services creates room for later improvement. Final approval depends on stream clarity, placement and downstream compatibility with the venue waste contractor.
Why do Convention centers lead Buyer?
Convention centers are projected to account for 30.0% share in 2026.
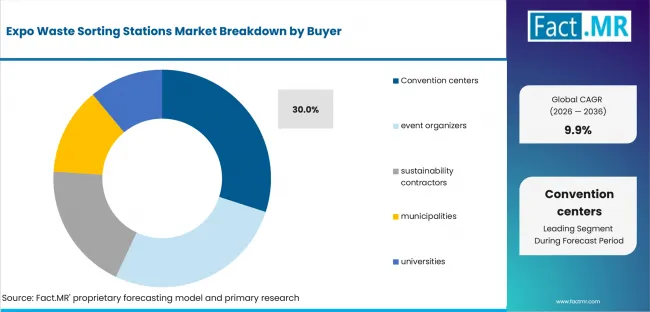
Expo Waste Sorting Stations Market Analysis By Buyer | Source: Fact.MR
Buyer preference for Convention centers starts with the need to address turning attendee disposal behavior into clean material streams under crowded event conditions. The format turns that need into a practical workflow because paired openings, visual prompts and matched containers guide waste into defined streams at the point of disposal. Rising food-service waste increases utilization across recurring events. The segment keeps its lead when stream clarity, placement and downstream compatibility with the venue waste contractor is documented and visitor confusion is contained.
Why does Equipment sale lead Service Model?
Equipment sale are projected to account for 24.0% share in 2026.
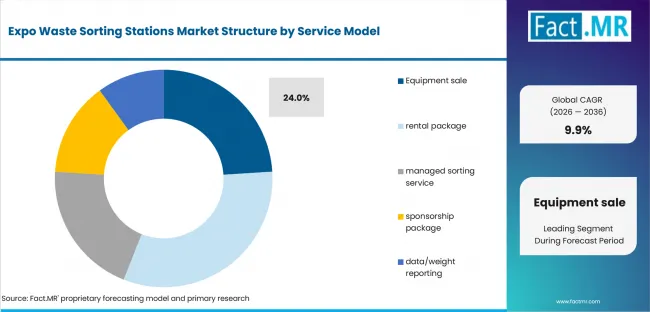
Expo Waste Sorting Stations Market Analysis By Service Model | Source: Fact.MR
The lead held by Equipment sale reflects a direct response to turning attendee disposal behavior into clean material streams under crowded event conditions. Its technical basis is simple: paired openings, visual prompts and matched containers guide waste into defined streams at the point of disposal. That fit becomes commercially stronger through venue waste-diversion commitments. Before wider adoption, procurement teams still examine stream clarity, placement and downstream compatibility with the venue waste contractor and the effect of inconsistent local collection rules.
What is accelerating Expo Waste Sorting Stations Market adoption, and what is holding it back?
Venue waste-diversion commitments is anticipated to remain the primary demand catalyst. Visitor confusion is expected to restrain adoption when the operating case is incomplete.
Drivers Impact Analysis
| DRIVER | (~) % IMPACT ON CAGR | GEOGRAPHIC RELEVANCE | IMPACT TIMELINE |
|---|---|---|---|
| Venue waste-diversion commitments | +2.7% | North America and Europe | Short term (<=2 years) |
| Organizer sustainability reporting | +2.1% | China and UAE | Short term (<=2 years) |
| Sponsor-funded green programs | +1.6% | Mature exhibition markets | Medium term (2-4 years) |
| Rising food-service waste | +1.1% | Global | Medium term (2-4 years) |
Source: Fact.MR analysis. Updated Jul 28, 2026
- Venue waste-diversion commitments: Venue waste-diversion commitments creates a buying reason when it changes the handling of turning attendee disposal behavior into clean material streams under crowded event conditions. The outcome should remain visible through stream clarity, placement and downstream compatibility with the venue waste contractor.
- Organizer sustainability reporting: Organizer sustainability reporting affects demand by making turning attendee disposal behavior into clean material streams under crowded event conditions visible at the budget stage. Its commercial effect is strongest when stream clarity, placement and downstream compatibility with the venue waste contractor can be checked after deployment.
- Sponsor-funded green programs: Sponsor-funded green programs moves the purchase forward where buyers need a repeatable answer to turning attendee disposal behavior into clean material streams under crowded event conditions. The mechanism is credible when paired openings, visual prompts and matched containers guide waste into defined streams at the point of disposal.
- Rising food-service waste: Rising food-service waste supports replacement because existing methods often leave turning attendee disposal behavior into clean material streams under crowded event conditions unresolved. Buyers use stream clarity, placement and downstream compatibility with the venue waste contractor to test the upgrade case.
Opportunity Impact Analysis
| OPPORTUNITY | (~) % IMPACT ON CAGR | GEOGRAPHIC RELEVANCE | IMPACT TIMELINE |
|---|---|---|---|
| Weight and contamination sensors | +1.8% | Germany and Japan | Short term (<=2 years) |
| Standardized venue signage | +1.3% | China and UAE | Medium term (2-4 years) |
| Managed sorting and reporting services | +0.9% | USA and UK | Medium term (2-4 years) |
Source: Fact.MR analysis. Updated Jul 28, 2026
- Weight and contamination sensors: Weight and contamination sensors supports a broader offer when event teams can link it with stream clarity, placement and downstream compatibility with the venue waste contractor. The opportunity loses value if it reintroduces turning attendee disposal behavior into clean material streams under crowded event conditions.
- Standardized venue signage: Standardized venue signage extends value after buyers establish stream clarity, placement and downstream compatibility with the venue waste contractor. It can improve utilization or service revenue without weakening the workflow behind paired openings, visual prompts and matched containers guide waste into defined streams at the point of disposal.
- Managed sorting and reporting services: Managed sorting and reporting services opens an upgrade route where the base system already controls turning attendee disposal behavior into clean material streams under crowded event conditions. The opportunity is strongest when it also improves stream clarity, placement and downstream compatibility with the venue waste contractor.
Restraints Impact Analysis
| RESTRAINT | (~) % IMPACT ON CAGR | GEOGRAPHIC RELEVANCE | IMPACT TIMELINE |
|---|---|---|---|
| Visitor confusion | -1.9% | Highly regulated venues | Short term (<=2 years) |
| Inconsistent local collection rules | -1.4% | Global | Medium term (2-4 years) |
| Contamination that reduces recycling value | -1.0% | Cost-sensitive regional markets | Short term (<=2 years) |
Source: Fact.MR analysis. Updated Jul 28, 2026
- Visitor confusion: Visitor confusion reduces adoption when responsibility for turning attendee disposal behavior into clean material streams under crowded event conditions is unclear. A written inspection and support process can contain the risk.
- Inconsistent local collection rules: Inconsistent local collection rules limits adoption where buyers cannot see how turning attendee disposal behavior into clean material streams under crowded event conditions will be controlled. Inspection points and service ownership can reduce the effect.
- Contamination that reduces recycling value: Contamination that reduces recycling value becomes material when stream clarity, placement and downstream compatibility with the venue waste contractor is missing from the supplier's evidence. Clear operating limits can keep the issue from delaying approval.
Which countries are scaling Expo Waste Sorting Stations Market fastest?
The global growth rate is a weighted average of the markets included in the analysis. It does not need to match every country result. China, UAE are above the 9.9% global figure, while Germany, UK, Japan are below it.
- For expo waste sorting stations, country variation comes from the procurement route and the operating problem being solved, not from the CAGR ranking alone.
- Three-stream stations benefit from China's multi-city calendar because repeat deployment raises the value of standard work instructions. In the UAE, turning attendee disposal behavior into clean material streams under crowded event conditions places more weight on turnaround and support readiness.
- Venue waste-diversion commitments gives US buyers a measurable reason to invest, while Japan tests whether stream clarity, placement and downstream compatibility with the venue waste contractor can be maintained in compact configurations.
- Recycling face higher documentation expectations in Germany. In the UK, recurring shows create several commercial routes for weight and contamination sensors.
- Stream clarity, placement and downstream compatibility with the venue waste contractor is therefore the common approval test, although each country reaches that test through a different event model.
The broader country analysis tests whether venue waste-diversion commitments, visitor confusion and weight and contamination sensors behave differently across North America, Latin America, Europe, East Asia, South Asia and Oceania, and the Middle East and Africa.
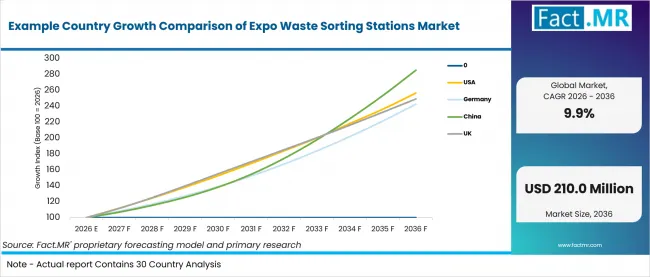
Example Country Growth Comparison Of Expo Waste Sorting Stations Market | Source: Fact.MR
| COUNTRY | CAGR 2026 to 2036 |
|---|---|
| UAE | 10.6% |
| USA | 9.9% |
| Japan | 9.8% |
| UK | 9.6% |
| Germany | 9.3% |
Source: Fact.MR analysis. Updated Jul 28, 2026
What is driving UAE's growth through 2036?
10.6% CAGR, driven by high event throughput and international participation.
The UAE's international event platform supports a 10.6% outlook for expo waste sorting stations. Dubai World Trade Centre hosted 401 events and welcomed 2.97 million attendees in 2025, a 12% year-on-year increase. Buyers place weight on stream clarity, placement and downstream compatibility with the venue waste contractor, particularly where rising food-service waste must be delivered by mixed venue and contractor teams.
What is driving USA's growth through 2036?
9.9% CAGR, supported by measurement-led exhibitor procurement.
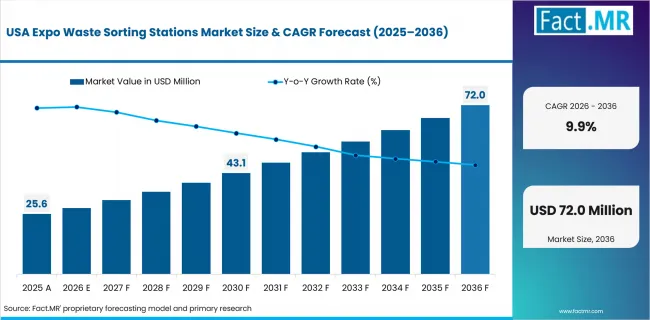
Expo Waste Sorting Stations Market Country Value Analysis | Source: Fact.MR
Growth in the USA is estimated at 9.9%, with benchmarking shaping procurement. CEIR research places lead capture, event performance and exhibitor outcomes at the center of procurement decisions in the US business-events channel. Buyers favor expo waste sorting stations offers that document stream clarity, placement and downstream compatibility with the venue waste contractor and avoid an unverified workflow burden.
What is driving Japan's growth through 2036?
9.8% CAGR, linked to compact systems and reliable operation.
The Japanese market is expected to post a 9.8% CAGR. UFI measured 16.9 million square metres of exhibition space across Asia-Pacific in its January 2026 industry statistics, with Japan forming part of this dense regional venue network. For expo waste sorting stations, turning attendee disposal behavior into clean material streams under crowded event conditions remains the key design constraint and stream clarity, placement and downstream compatibility with the venue waste contractor the main approval test.
What is driving UK's growth through 2036?
9.6% CAGR, supported by a broad base of exhibitions and recurring exhibitors.
For expo waste sorting stations, the UK's 9.6% outlook is connected to repeated use across a dense event calendar. The UK exhibition economy served about 132,000 exhibiting companies in 2024, giving suppliers a broad base of recurring users. Rental and managed-service models gain ground when they improve stream clarity, placement and downstream compatibility with the venue waste contractor without creating visitor confusion.
What is driving Germany's growth through 2036?
9.3% CAGR, driven by an international and technically demanding trade-fair base.
Germany is projected at 9.3%, with sponsor-funded green programs evaluated against a mature trade-fair operating base. AUMA estimates that the German trade-fair sector supports roughly 280,000 jobs and generates about EUR 30 billion in annual economic activity. Providers gain credibility when paired openings, visual prompts and matched containers guide waste into defined streams at the point of disposal is translated into inspection points and service responsibilities.
Who leads the Expo Waste Sorting Stations Market?
Event buyers are looking for bins that people can understand quickly and waste contractors can empty without having to sort through a badly mixed load. CleanRiver Recycling Solutions and Busch Systems are active in multi-stream stations that can be configured for different event formats. Rubbermaid Commercial Products brings the advantage of a large commercial container range, while TerraCycle is better known for combining collection programmes with branded waste solutions. Ex-Cell Kaiser also competes through recycling stations suited to public venues, offices and temporary event spaces. Openings should match the waste being collected. Stations must also be sturdy enough for repeated use and simple enough for temporary staff to manage. Over the next decade, suppliers that can handle setup, signage, collection data and post-event removal as one service are likely to win more repeat business.
From 2026 to 2036, providers are likely to compete on stream clarity, placement and downstream compatibility with the venue waste contractor, setup readiness and support continuity. An offer gains an advantage when the limits created by visitor confusion are stated before procurement.
Which companies are the key providers?
Key companies include CleanRiver Recycling Solutions; Busch Systems; Rubbermaid Commercial Products; TerraCycle; Ex-Cell Kaiser.
- CleanRiver Recycling Solutions
- Busch Systems
- Rubbermaid Commercial Products
- TerraCycle
- Ex-Cell Kaiser
Bibliography
- UFI. (2026, January 29). 36th Global Exhibition Barometer. UFI, The Global Association of the Exhibition Industry.
- UFI. (2026, February). Global Exhibition Industry Statistics, January 2026. UFI, The Global Association of the Exhibition Industry.
- AUMA. (2026). Key figures for the trade fair industry in Germany. Association of the German Trade Fair Industry.
- China Council for the Promotion of International Trade. (2025). Fairs and Exhibitions in China 2025. CCPIT.
- Events Industry Alliance. (2026, April 15). UK exhibitions reach highest level in a decade according to EIA 2025 SASIE report. Events Industry Alliance.
- Dubai World Trade Centre. (2026, April 7). DWTC welcomes nearly 3 million participants in 2025. Dubai World Trade Centre.
- Center for Exhibition Industry Research. (2026). CEIR research and event-performance resources. International Association of Exhibitions and Events.
This Report Addresses
- Strategic intelligence on Expo Waste Sorting Stations Market across Station Type and Waste Stream choices that shape purchasing decisions.
- Segment analysis covering Three-stream stations as the 2026 share leader within Station Type.
- Regional analysis comparing China and UAE with USA and Japan, while UK and Germany complete the growth view.
- Competitive analysis profiling CleanRiver Recycling Solutions and Busch Systems with additional active providers.
- Use-case assessment of the categories that shape demand across the forecast period.
What does the Expo Waste Sorting Stations Market cover?
Temporary or venue stations that separate event waste into clearly identified recycling, compost and disposal streams.
The market includes multi-stream stations, labels, frames, containers and optional sensing or reporting functions used at exhibitions. Commercial value comes from the configured product and its direct event function. The covered solution must be usable within an exhibition workflow rather than supplied as an unrelated component.
The market differs from broader event equipment because the boundary is defined by the specific function described in this report. Municipal collection vehicles, permanent waste plants, general cleaning labor and commodity recycling revenue remain outside the valuation.
What is included in the scope?
The scope includes solutions used by the buyer groups identified in the segmentation and deployed for exhibitions, conferences, activations or related temporary business events.
Coverage spans Station Type: Three-stream stations, four-stream stations, modular bin banks, branded sponsor stations, sensor-enabled stations; Waste Stream: Recycling, compost, landfill, liquid/cup waste, specialty waste; Material: Recycled plastic, powder-coated steel, bamboo/wood, cardboard temporary units, aluminum frames; Buyer: Convention centers, event organizers, sustainability contractors, municipalities, universities; Service Model: Equipment sale, rental package, managed sorting service, sponsorship package, data/weight reporting.
Components remain in scope when they are supplied as part of the complete expo waste sorting stations solution and contribute directly to stream clarity, placement and downstream compatibility with the venue waste contractor.
What is excluded from the scope?
Municipal collection vehicles, permanent waste plants, general cleaning labor and commodity recycling revenue.
The scope excludes unrelated venue construction, general event management, floor-space rental and services that do not deliver the defined product function. It also excludes the value of the event, venue or exhibitor business in which the solution is used.
How Was the Analysis Built?
The analysis draws on 120+ sources, 35+ company portfolios, 25+ countries and more than 20 industry interviews.
- Primary Research: Discussions with manufacturers, rental providers, exhibit builders, organizers, venues and end users examined stream clarity, placement and downstream compatibility with the venue waste contractor, purchasing criteria and operational constraints.
- Desk Research: Research covered official exhibition statistics, association publications, company portfolios, technical material, public policy and other authoritative sources. Sources used in the country context are documented in the bibliography.
- Market Sizing and Forecasting: Estimates combine historical performance, segment shares, company participation, pricing and volume indicators, country growth, adoption patterns and barriers.
- Data Validation and Update Cycle: Findings are cross-checked against company activity, event-industry statistics, technical feasibility and the internal consistency of segment and country assumptions.
Segmentation
What is the report's scope and coverage?
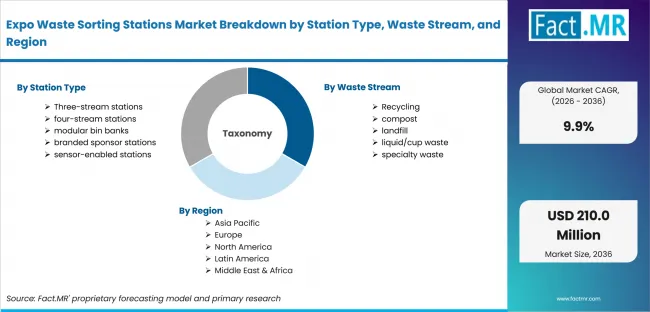
Expo Waste Sorting Stations Market Breakdown By Station Type, Waste Stream, And Region | Source: Fact.MR
| Attribute | Details |
|---|---|
| Quantitative Units | USD million in 2026 to USD million by 2036 at a CAGR |
| Market Definition | The market covers temporary or venue stations that separate event waste into clearly identified recycling, compost and disposal streams when supplied as a commercial event solution. |
| Station Type | Three-stream stations; four-stream stations; modular bin banks; branded sponsor stations; sensor-enabled stations |
| Waste Stream | Recycling; compost; landfill; liquid/cup waste; specialty waste |
| Material | Recycled plastic; powder-coated steel; bamboo/wood; cardboard temporary units; aluminum frames |
| Buyer | Convention centers; event organizers; sustainability contractors; municipalities; universities |
| Service Model | Equipment sale; rental package; managed sorting service; sponsorship package; data/weight reporting |
| Regions Covered | North America; Latin America; Europe; East Asia; South Asia & Oceania; Middle East & Africa |
| Countries Covered | USA; Canada; Brazil; Mexico; Germany; U.K.; France; Italy; Spain; South Korea; Japan; Australia & New Zealand; GCC Countries; South Africa; UAE |
| Key Companies Profiled | CleanRiver Recycling Solutions; Busch Systems; Rubbermaid Commercial Products; TerraCycle; Ex-Cell Kaiser |
| Forecast Period | 2026 to 2036 |
| Approach | Hybrid top-down and bottom-up analysis using demand indicators across Station Type, Waste Stream, Material, Buyer, Service Model; country growth; company participation and adoption patterns |
Source: Fact.MR analysis. Updated Jul 28, 2026
How is the market segmented?
-
By Station Type:
- Three-stream stations
- four-stream stations
- modular bin banks
- branded sponsor stations
- sensor-enabled stations
-
By Waste Stream:
- Recycling
- compost
- landfill
- liquid/cup waste
- specialty waste
-
By Material:
- Recycled plastic
- powder-coated steel
- bamboo/wood
- cardboard temporary units
- aluminum frames
-
By Buyer:
- Convention centers
- event organizers
- sustainability contractors
- municipalities
- universities
-
By Service Model:
- Equipment sale
- rental package
- managed sorting service
- sponsorship package
- data/weight reporting
-
By Region:
- North America
- USA
- Canada
- Latin America
- Brazil
- Mexico
- Rest of Latin America
- Europe
- Germany
- U.K.
- France
- Italy
- Spain
- Rest of Europe
- East Asia
- South Korea
- Japan
- China
- South Asia & Oceania
- India
- Australia & New Zealand
- Rest of South Asia & Oceania
- Middle East & Africa
- GCC Countries
- South Africa
- UAE
- Rest of Middle East & Africa
- North America
Frequently Asked Questions
Which Station Type leads the Expo Waste Sorting Stations Market?
Which Waste Stream leads the Expo Waste Sorting Stations Market?
Which Material leads the Expo Waste Sorting Stations Market?
Which Buyer leads the Expo Waste Sorting Stations Market?
Which Service Model leads the Expo Waste Sorting Stations Market?
How does UAE perform in the Expo Waste Sorting Stations Market?
How does USA perform in the Expo Waste Sorting Stations Market?
What is the primary driver in the Expo Waste Sorting Stations Market?
What is the main restraint in the Expo Waste Sorting Stations Market?
Who worked on this report


Preview the report firsthand - request a free sample
Free SampleGet the brochure for pricing and purchase details
Download PDF