- Market Value (2025): USD 3.02 Bn
- Estimated Value (2026): USD 3.24 Bn
- Forecast Value (2036): USD 6.47 Bn
- CAGR (2026-2036): 7.2%
What is the Floating Storage and Regasification Unit (FSRU) Market forecast to be worth by 2036?
USD 3.24 billion in 2026 to USD 6.47 billion by 2036 at a 7.2% CAGR.
- At USD 3.02 billion in 2025, the FSRU market already reflected a wave of charters signed by first-time LNG importers and by European buyers replacing pipeline gas.
- Value will grow from USD 3.24 billion in 2026 to USD 6.47 billion by 2036, as new terminals in South America, the Middle East and Southeast Asia take delivery of vessels now under construction.
- A 7.2% CAGR will come from rising LNG supply, longer charter terms and steady demand from gas-fired power plants near the coast.
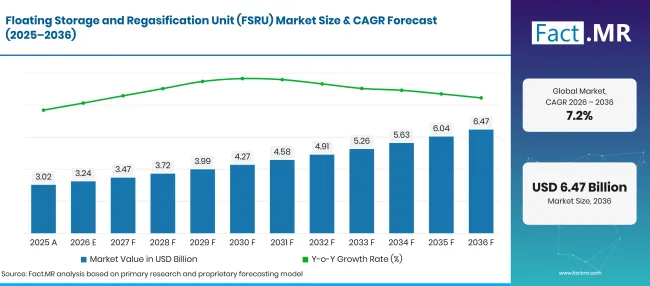
Floating Storage And Regasification Unit Fsru Market Forecast Global | Source: Fact.MR
| Year | Basis | Market Value (USD billion) |
|---|---|---|
| 2025 | Actual | 3.02 |
| 2026 | Estimate | 3.24 |
| 2036 | Forecast | 6.47 |
| CAGR 2026 to 2036 | Forecast period | 7.2% |
Source: Fact.MR analysis. Updated Nov 5, 2026
What are the defining numbers behind Floating Storage and Regasification Unit (FSRU) Market growth?
The 2026 to 2036 period adds USD 3.2 billion in new value, with large-scale vessels and power generation users accounting for most of it.
- Demand Drivers in the Market
- More LNG on the water: The International Energy Agency reported in January 2026 that global LNG supply will rise by more than 7% in 2026, an increase of about 40 bcm led by North America [1]. Extra cargoes need import points, and floating terminals are often the first option for buyers without onshore capacity.
- New importing countries: Egypt moved from net gas exporter to net importer and nearly tripled its LNG imports over the 2025/26 winter, according to the IEA Gas Market Report for the second quarter of 2026 [2]. Countries that change position this quickly tend to charter FSRUs because a vessel can arrive within months.
- Gas for power systems with hydro or renewable swings: Brazil’s regasification capacity reached 5.1 Bcf/d in August 2025, more than double the 2.5 Bcf/d of 2020, and floating units handle most of it [3]. Gas-fired plants linked to these terminals raise output when reservoir levels fall.
- Newbuild and conversion activity: Owners are ordering purpose-built units with higher send-out rates and converting older LNG carriers to fill near-term gaps. Shipyards in South Korea and China are the main sources of both, which keeps delivery slots tight and charter rates firm.
- Key Segments Analyzed
- By Vessel Type: Large-Scale FSRU will command 68.4% share in 2026, since national import programmes need high storage volumes and steady send-out to supply pipelines and power plants.
- By Application: Power Generation will account for 47.2% of 2026 revenue, as utilities use imported gas to firm grids that depend on hydro, wind and solar output.
- By Capacity: Up to 140,000 m³ will hold 69.2% in 2026, reflecting the large number of converted carriers and earlier-generation units in that size band.
- Analyst Opinion at Fact.MR
- Shambhu Nath Jha, Principal Consultant at Fact.MR, states, “Buyers will keep choosing floating terminals wherever speed to first gas counts for more than the lowest lifetime cost. Charter terms are getting longer, and that will turn many FSRUs into near-permanent assets for power utilities. Owners with vessels available before 2029 and yards with spare LNG containment capacity will capture the strongest returns.”
- Strategic Implications
- FSRU owners should secure newbuild slots and conversion candidates early, since vessel availability will decide which tenders they can bid on through the end of the decade.
- Shipbuilders should standardise regasification module designs so that newbuild and conversion work can share engineering and shorten delivery times.
- Utilities and national gas companies should plan the jetty, mooring and onshore pipeline link in parallel with the vessel charter, because shore works often set the start date.
- Investors should weigh charter length and counterparty strength above day rates, given that most FSRU revenue depends on a small number of long contracts.
The United States heads the five profiled countries at 8.8%, with export growth and US-based owners lifting demand for floating import capacity in other markets. Brazil follows closely at 8.5%, as hydro variability keeps gas-fired backup in demand. The United Kingdom, at 7.8%, gains from rising import needs as North Sea output falls. Japan trails at 6.6% because its onshore terminal network already covers most demand. Germany closes the list at 5.4%, since floating terminals already operate and the next phase leans toward permanent sites.
How does the Floating Storage and Regasification Unit (FSRU) Market break down by segment?
Large-Scale FSRU will lead Vessel Type at 68.4%; Power Generation will head Application at 47.2%; Up to 140,000 m³ will lead Capacity at 69.2% in 2026.
Which Vessel Type leads?
Large-Scale FSRU represents 68.4% of 2026 market value.
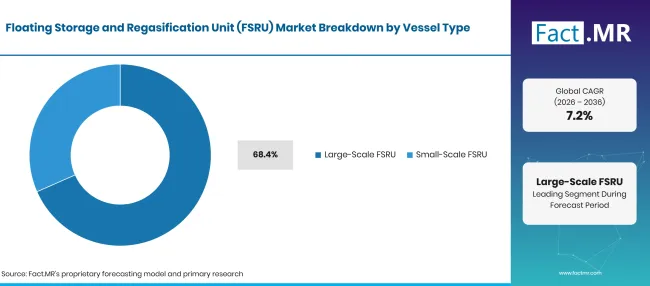
Floating Storage And Regasification Unit Fsru Market Breakdown Vessel Type | Source: Fact.MR
| Vessel Type | Share (2026) |
|---|---|
| Large-Scale FSRU (Leading segment) | 68.4% |
| Other segments combined | 31.6%* |
| Total | 100.0% |
Source: Fact.MR analysis. Updated Nov 5, 2026
National import programmes need vessels that can hold full cargoes and run continuous send-out to large pipeline systems. Excelerate Energy’s newest unit, Hull 3407, built by HD Hyundai Heavy Industries, can send out up to 1,000 MMscf/d [4]. Units of this class serve utilities and industrial clusters from a single berth, and owners can move them between markets when charters end. Equipment such as cryogenic valves and high-pressure send-out pumps account for a large part of their build cost. Small-scale FSRUs serve islands, smaller ports and regional grids where gas demand is modest or water depth limits ship size. They often work alongside small-scale LNG supply chains that deliver gas by truck or feeder vessel. Their lower storage volume limits them in national import roles, but they open markets that a large unit cannot reach.
What supports Power Generation within Application?
Power Generation takes 47.2% of 2026 revenue.
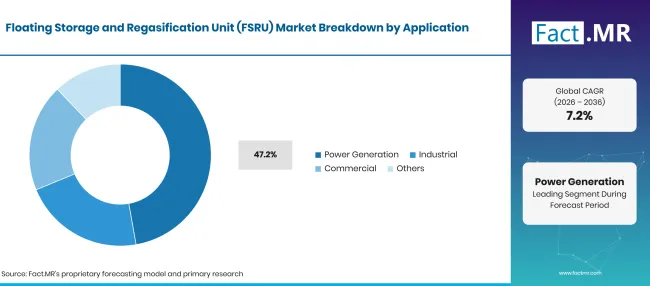
Floating Storage And Regasification Unit Fsru Market Breakdown Application 1 | Source: Fact.MR
| Application | Share (2026) |
|---|---|
| Power Generation (Leading segment) | 47.2% |
| Other segments combined | 52.8%* |
| Total | 100.0% |
Source: Fact.MR analysis. Updated Nov 5, 2026
Utilities favour floating terminals because a gas plant can be fuelled before an onshore terminal would even clear permitting. Imported LNG offers dispatchable output that offsets drought years for hydro systems and calm periods for wind. Many new combined-cycle projects pair an FSRU with gas turbine capacity in a single tender, linking fuel supply and generation from the start. Industrial users draw regasified gas for fertilisers, chemicals, glass and metals processing, mostly near coastal clusters. Commercial demand comes from city gas networks, hotels and service buildings, while other uses include transport fuel hubs and small-scale redistribution.
What leads the Capacity segment?
Up to 140,000 m³ captures 69.2% of 2026 revenue.
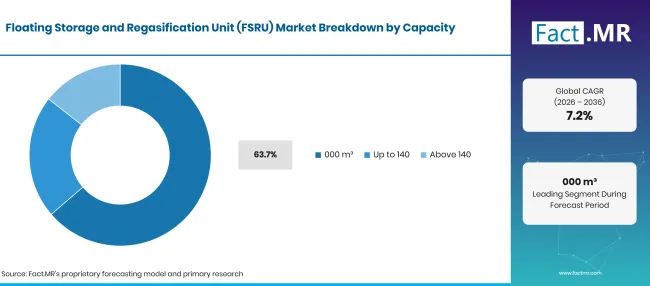
Floating Storage And Regasification Unit Fsru Market Breakdown Capacity | Source: Fact.MR
| Capacity | Share (2026) |
|---|---|
| Up to 140,000 m³ (Leading segment) | 69.2% |
| Other segments combined | 30.8%* |
| Total | 100.0% |
Source: Fact.MR analysis. Updated Nov 5, 2026
Many FSRUs in service are converted LNG carriers or units built in earlier construction cycles, and these mostly fall within this size band. They suit terminals with steady but moderate throughput, and the vessels can still reload or transfer cargoes ship to ship. Transfer gear such as marine loading arms and flexible hoses links them to jetties or supply carriers. Units above 140,000 m³ suit large national terminals and growing grids. The FSRU under construction by Hanwha Ocean for Singapore’s second LNG terminal will hold 204,000 m³ and deliver up to 5 million tonnes per annum [5]. This class needs more cryogenic equipment and longer yard time, so orders are placed years ahead of start-up.
What is accelerating Floating Storage and Regasification Unit (FSRU) Market adoption, and what is holding it back?
More LNG supply, new importing countries and the need for fast backup to hydro and renewable power are pushing demand for floating terminals. Against this, newbuild costs remain high and specialised yard capacity is limited. Volatile LNG prices can delay final decisions, and in mature markets permanent onshore terminals compete for the same long-term volumes.
Drivers Impact Analysis
| DRIVER | (~) % IMPACT ON CAGR | GEOGRAPHIC RELEVANCE | IMPACT TIMELINE |
|---|---|---|---|
| Growing demand for diversified LNG import infrastructure | +2.4% | Global | Medium term (2-4 years) |
| Expansion of gas-fired power generation capacity | +1.8% | Asia, Latin America, Europe | Medium term (2-4 years) |
| Government investment in energy security and supply flexibility | +1.5% | Europe, Asia, Latin America | Short term (<=2 years) |
| New FSRU construction and vessel modernization | +1.0% | South Korea, China, Global | Long term (>=4 years) |
Source: Fact.MR analysis. Updated Nov 5, 2026
Opportunity Impact Analysis
| OPPORTUNITY | (~) % IMPACT ON CAGR | GEOGRAPHIC RELEVANCE | IMPACT TIMELINE |
|---|---|---|---|
| LNG import infrastructure development in emerging economies | +1.2% | Latin America, South Asia, Southeast Asia | Medium term (2-4 years) |
| Deployment of large-capacity FSRUs at major import terminals | +0.9% | Europe, Asia, Latin America | Medium term (2-4 years) |
| Long-term vessel chartering and terminal operating agreements | +0.7% | Global | Short term (<=2 years) |
| Conversion and redeployment of existing LNG carriers | +0.5% | Global | Long term (>=4 years) |
Source: Fact.MR analysis. Updated Nov 5, 2026
Restraints Impact Analysis
| RESTRAINT | (~) % IMPACT ON CAGR | GEOGRAPHIC RELEVANCE | IMPACT TIMELINE |
|---|---|---|---|
| High construction costs and limited specialized shipyard capacity | -1.1% | Global, particularly East Asia | Medium term (2-4 years) |
| LNG price volatility and uncertain long-term import economics | -0.9% | Europe, Asia, Latin America | Short term (<=2 years) |
| Competition from permanent onshore LNG terminals | -0.7% | Europe, East Asia, North America | Long term (>=4 years) |
| Port development, permitting and pipeline connection delays | -0.5% | Global | Medium term (2-4 years) |
Source: Fact.MR analysis. Updated Nov 5, 2026
Which countries are scaling the Floating Storage and Regasification Unit (FSRU) Market through 2036?
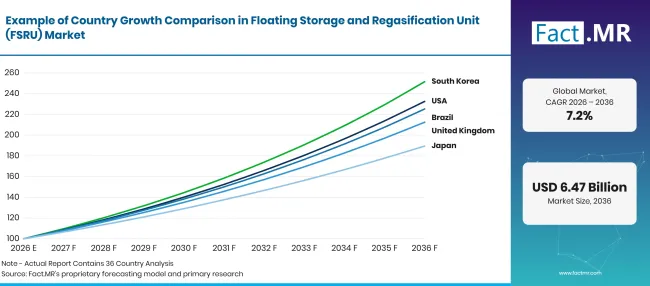
Floating Storage And Regasification Unit Fsru Market Growth Index | Source: Fact.MR
| Country | CAGR (2026 to 2036) |
|---|---|
| United States | 8.8% |
| Brazil | 8.5% |
| United Kingdom | 7.8% |
| Japan | 6.6% |
| Germany | 5.4% |
Source: Fact.MR analysis. Updated Nov 5, 2026
What supports FSRU demand in the United States?
8.8% CAGR, driven by US-based FSRU owners and the export supply that feeds floating import terminals abroad.
US LNG exports averaged 15.1 Bcf/d in 2025, about 26% of global exports, according to the U.S. Energy Information Administration [6]. New liquefaction keeps adding volume: Corpus Christi Stage 3 shipped its first cargo in February 2025 and brings 1.3 Bcf/d of nominal capacity across seven midscale trains [7]. US-headquartered owners charter FSRUs to the buyers of these cargoes, and domestic engineering firms supply mooring, metering and send-out systems for projects overseas.
How is Brazil expanding its FSRU market?
8.5% CAGR, backed by gas-fired plants that cover dry years in the hydro system.
Floating units supply almost all of Brazil’s import capacity along its coast, with a further unit at Suape in Pernambuco scheduled for early 2026 [3]. Hydropower generated 56% of the country’s electricity in 2024, and gas plants linked to FSRUs raise output when reservoirs fall, as they did when key regions dropped to 29% of capacity that year [3]. Regional grids in the north and south are the next candidates for floating capacity.
What is shaping the United Kingdom’s market growth?
7.8% CAGR, as falling North Sea output raises the share of gas that arrives by ship.
Great Britain has three LNG import terminals, at Isle of Grain and at Dragon and South Hook in Milford Haven, with combined capacity of 150 mcm/d, according to the Department for Energy Security and Net Zero’s December 2025 security of supply report [8]. LNG met 21% of gross annual gas supply on a five-year average [8]. Pipeline links to Norway and the continent cover much of the gap today, so floating capacity in the UK will serve peak and contingency roles.
What is driving Japan’s FSRU market?
6.6% CAGR, reflecting near-total reliance on imported LNG and interest in flexible backup terminals.
Japan imported about 66 million tonnes of natural gas in 2024, with Australia supplying about 38.2% and Malaysia about 15.5%, according to the Agency for Natural Resources and Energy [9]. Its coastal network of onshore terminals already covers most demand. Growth will come from remote islands, disaster resilience planning and Japanese shipping lines that charter FSRUs to buyers abroad.
How will Germany’s FSRU market develop?
5.4% CAGR, helped by floating terminals that already carry a tenth of national gas imports.
Germany imported 106 TWh of natural gas through its LNG terminals in 2025, or 10.3% of all imports, the Federal Network Agency reported [10]. Floating units operate at Wilhelmshaven, Brunsbüttel and Mukran. Deutsche ReGas will charter an FSRU from Mitsui O.S.K. Lines for its Mukran terminal from 2028 under a long-term contract [11]. Slower growth reflects a shift toward permanent sites once current charters run their course.
Who leads the Floating Storage and Regasification Unit (FSRU) Market?
Vessel owners and operators, including Excelerate Energy, Höegh Evi, BW LNG and Mitsui O.S.K. Lines, compete on fleet availability, terminal development skills and the ability to package the vessel with shore works and LNG supply. Excelerate signed a definitive agreement in October 2025 for a fully integrated floating LNG import terminal at Khor Al Zubair in Iraq [4], and Höegh Evi agreed in September 2026 to develop, own and operate an FSRU-based terminal in Sarawak with PETROS [12].
Shipbuilders, chiefly HD Hyundai Heavy Industries and Hanwha Ocean, compete on containment technology, regasification integration and delivery slots, and Hanwha Ocean began building Singapore’s new unit in October 2025 [5]. Owners without free vessels will struggle to win near-term tenders, while yards with spare capacity hold pricing power. Over the forecast period, the deciding factor will be who can offer a ready vessel plus a full terminal package at a bankable charter rate.
Which companies are the key providers?
Key companies in the Floating Storage and Regasification Unit (FSRU) Market include Excelerate Energy, Höegh Evi, BW LNG, Mitsui O.S.K. Lines, HD Hyundai Heavy Industries and Hanwha Ocean.
- Excelerate Energy, Inc.
- Höegh Evi Ltd.
- BW LNG
- Mitsui O.S.K. Lines, Ltd.
- HD Hyundai Heavy Industries Co., Ltd.
- Hanwha Ocean Co., Ltd.
Bibliography
- [1] International Energy Agency. (2026, January). Growth in global demand for natural gas is set to accelerate in 2026 as LNG wave spreads through markets.
- [2]International Energy Agency. (2026, April). Gas Market Report, Q2-2026.
- [3] U.S. Energy Information Administration. (2025, October 29). Brazil is expanding its liquefied natural gas import infrastructure.
- [4] Excelerate Energy. (2025, October 28). Excelerate Energy Signs Definitive Agreement for Fully Integrated Floating LNG Import Terminal in Iraq.
- [5] Singapore LNG Corporation. (2025, October 24). Construction of the FSRU for Singapore’s Second LNG Terminal Begins.
- [6] U.S. Energy Information Administration. (2026, July 14). Global liquefied natural gas trade volumes reached record high in 2025.
- [7] U.S. Energy Information Administration. (2025, March 11). First liquefied natural gas cargo produced at Corpus Christi Stage 3 export facility.
- [8] Department for Energy Security and Net Zero. (2025, December 17). Statutory Security of Supply Report 2025.
- [9] Agency for Natural Resources and Energy. (2026, February). Japan’s Energy 2025.
- [10] Bundesnetzagentur. (2026, January 12). Bundesnetzagentur publishes gas supply figures for 2025.
- [11] Mitsui O.S.K. Lines. (2026, October 29). MOL Signs Long-Term Charter Contract with Deutsche ReGas for Energie-Terminal "Deutsche Ostsee" in Germany.
- [12] Höegh Evi. (2026, September 30). Höegh Evi and PETROS to develop LNG terminal in Sarawak, Malaysia.
This Report Answers
- How much value will FSRUs add between 2026 and 2036, and where will new charters come from?
- Why do large-scale vessels, power utilities and the up to 140,000 m³ size band hold the biggest shares?
- What separates growth in the United States, Brazil, the United Kingdom, Japan and Germany?
- Which owners, operators and shipyards shape vessel supply, and how do their strategies differ?
- How do LNG supply growth, new importing countries and hydro variability lift demand?
- Where do build costs, price swings and onshore terminals limit uptake?
What does the Floating Storage and Regasification Unit (FSRU) Market cover?
This market tracks vessels that take on liquefied natural gas, store it in insulated tanks and convert it back to gas on board before sending it ashore. Each unit combines cargo containment, regasification trains, high-pressure pumps, heat exchangers and gas metering in one floating asset.
Value is measured on vessel construction, conversion and charter revenue across large-scale and small-scale units, the four application groups and both capacity bands. Shore links such as flow control equipment are counted only when delivered as part of the FSRU package.
What is included in the scope?
Purpose-built FSRUs with onboard storage and regasification systems.
LNG carriers converted to floating storage and regasification service.Charter and terminal service revenue tied to FSRU operation, for permanent and temporary import sites.Onboard gas transfer, mooring interface and send-out systems delivered with the vessel.
What is excluded from the scope?
LNG carriers without regasification equipment and floating storage units that cannot convert gas.
Onshore LNG receiving terminals, liquefaction plants and upstream gas production.LNG cargo trading and natural gas commodity sales.Power generation revenue and pipeline networks beyond the terminal connection point.
How Was the Analysis Built?
The analysis draws on 120+ sources, 35+ company portfolios, 25+ countries, and more than 20 industry interviews.
- Primary Research: Primary research includes discussions with manufacturers, service providers, technology developers, distributors, end users, and subject-matter experts. These conversations examine purchasing priorities, product adoption, operational challenges, approval requirements, competitive positioning, and the factors that influence wider market acceptance.
- Desk Research: Desk research covers government statistics, regulatory publications, company filings, trade data, technical studies, industry associations, standards, public policy, and other authoritative sources. Every source used in the analysis is documented in the bibliography.
- Market Sizing and Forecasting: Market estimates combine historical performance, demand indicators, pricing and volume trends, segment shares, company participation, country-level growth, adoption patterns, investment activity, and barriers to market expansion.
- Data Validation and Update Cycle: Findings are validated by comparing primary interviews with public data, company activity, regulatory changes, trade patterns, and industry developments. Regular updates review new product launches, capacity changes, partnerships, approvals, and shifts in commercial adoption.
Segmentation
What is the report’s scope and coverage?
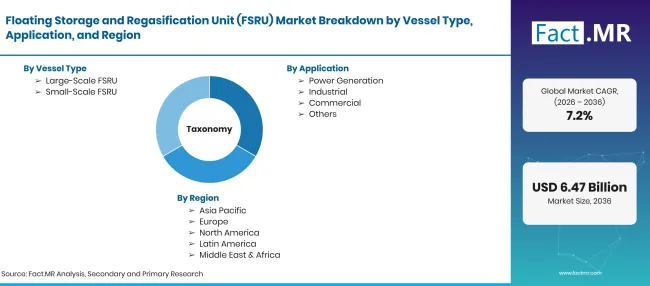
Floating Storage And Regasification Unit Fsru Market Taxonomy | Source: Fact.MR
| Attribute | Details |
|---|---|
| Quantitative Units | USD billion |
| Market Definition | Floating vessels that receive, store and regasify liquefied natural gas before sending natural gas to onshore pipelines or offshore distribution systems, covering purpose-built and converted FSRUs. |
| Vessel Type | Large-Scale FSRU; Small-Scale FSRU |
| Application | Power Generation; Industrial; Commercial; Others |
| Capacity | Up to 140,000 m³; Above 140,000 m³ |
| Regions Covered | North America; Latin America; Western Europe; Eastern Europe; East Asia; South Asia & Pacific; Middle East & Africa |
| Countries Covered | United States; Brazil; United Kingdom; Japan; Germany |
| Companies Profiled | Excelerate Energy; Höegh Evi; BW LNG; Mitsui O.S.K. Lines; HD Hyundai Heavy Industries; Hanwha Ocean |
| Forecast Period | 2026 to 2036 |
| Approach | Hybrid top-down and bottom-up model built on FSRU fleet capacity, newbuild and conversion orders, charter activity and regasification capacity by country. |
Source: Fact.MR analysis. Updated Nov 5, 2026
How is the market segmented?
-
By Vessel Type
- Large-Scale FSRU
- Small-Scale FSRU
-
By Application
- Power Generation
- Industrial
- Commercial
- Others
-
By Capacity
- Up to 140,000 m³
- Above 140,000 m³
-
By Region
- North America
- Latin America
- Western Europe
- Eastern Europe
- East Asia
- South Asia & Pacific
- Middle East & Africa
Frequently Asked Questions
How large is the Floating Storage and Regasification Unit (FSRU) Market in 2026?
What growth rate will the FSRU market record from 2026 to 2036?
Which vessel type leads the FSRU market?
Which application holds the greatest share?
Which capacity band contributes the most?
Which country will grow quickest?
Who are the main companies in the FSRU market?
What holds the FSRU market back?
Who worked on this report


Preview the report firsthand - request a free sample
Free SampleGet the brochure for pricing and purchase details
Download PDF