- Market Value (2025): USD 6.4 Bn
- Estimated Value (2026): USD 7.8 Bn
- Forecast Value (2036): USD 52.9 Bn
- CAGR (2026-2036): 21.1%
What is the Generative Adversarial Networks Market forecast to be worth by 2036?
USD 7.8 billion in 2026 to USD 52.9 billion by 2036 at 21.1% CAGR.
- The generative adversarial networks market reached USD 6.4 billion in 2025 as synthetic visual data moved from research trials into governed business workflows.
- Demand is projected to increase from USD 7.8 billion in 2026 to USD 52.9 billion by 2036.
- The market is forecast to record 21.1% CAGR from 2026 to 2036 as cloud training and controlled output review make paid use easier to approve.
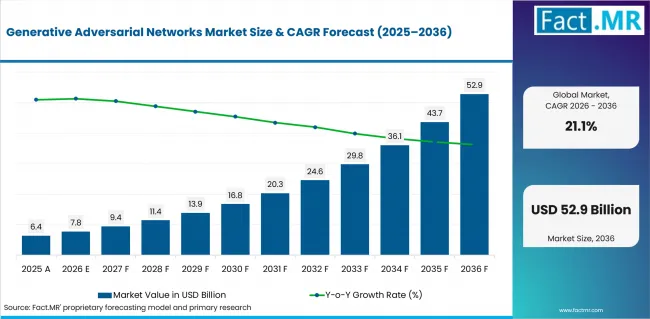
Generative Adversarial Networks Market Value Analysis | Source: Fact.MR
What are the defining numbers behind Generative Adversarial Networks Market growth?
USD 45.1 billion absolute opportunity by 2036.
- Demand Drivers in the Market
- Creative teams need controllable image variation when brand work requires many approved versions of the same asset.
- Data-science teams use synthetic records when real images are too scarce or sensitive for model testing.
- Cloud access reduces early buying friction since teams can test training runs before approving fixed infrastructure.
- Key Segments Analyzed
- By Deployment: Cloud-Based is expected to hold 64.0% share in 2026 because elastic capacity fits repeated training runs.
- By Application: Image Generation & Editing is projected to account for 31.0% share in 2026 since buyers can review visual output quickly.
- By End User: Large Enterprises are anticipated to represent 49.0% share in 2026 due to their governance budget and integration capacity.
- Analyst Opinion at Fact.MR
- Shambhu Nath Jha, Sr. Consultant at Fact.MR, opines: “GAN adoption depends on whether synthetic output can pass the buyer’s quality, rights and reproducibility review. Suppliers need to demonstrate how model controls operate in the exact image, video or data workflow being approved.”
- Strategic Implications
- AI platform teams need a production-readiness checklist before model results enter live workflows.
- Cloud providers can strengthen buying cases by making training cost easier to explain.
- Investors need to separate broad AI exposure from defined GAN workflows.
South Korea is expected to record a 22.5% CAGR from 2026 to 2036. The USA is projected at 21.8%. Canada is anticipated to post 21.4%. The UK is estimated at 21.1%. Germany is forecast at 20.8%. Australia is projected to reach 20.5%. Japan follows at 20.0%.
How does the Generative Adversarial Networks Market break down by segment?
Cloud-Based deployment is expected to lead Deployment at 64.0% share in 2026. Image Generation & Editing is projected to lead Application at 31.0% share in 2026.
Why does Cloud-Based lead Deployment?
Cloud-Based is projected to account for 64.0% share in 2026.
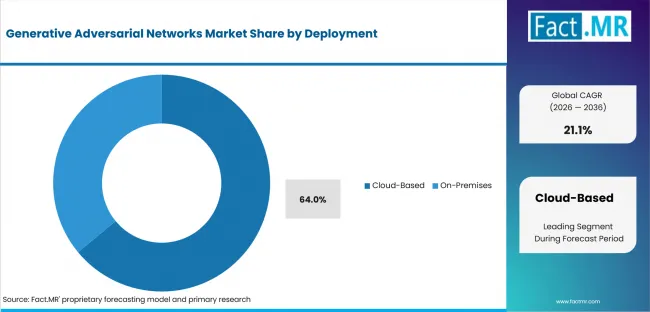
Generative Adversarial Networks Market Analysis By Deployment | Source: Fact.MR
GAN work needs repeated training and tuning. Cloud deployment gives teams temporary compute access without a new hardware approval. On-premises systems remain relevant when data cannot leave a controlled environment.
Why does Image Generation & Editing lead Application?
Image Generation & Editing is expected to hold 31.0% share in 2026.
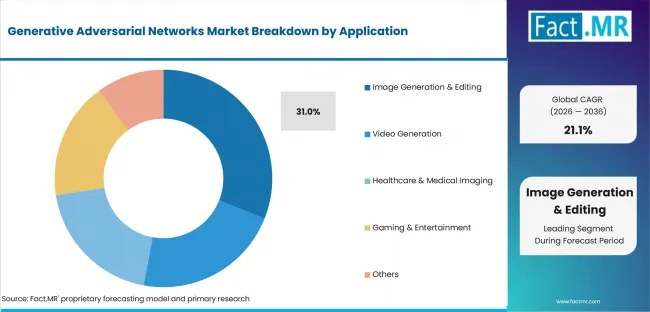
Generative Adversarial Networks Market Analysis By Application | Source: Fact.MR
Image workflows give buyers a clear way to judge value. Teams can review fidelity and brand fit on a finished asset. Video generation remains harder because review cost is higher.
Why do Large Enterprises lead End User?
Large Enterprises are anticipated to represent 49.0% share in 2026.
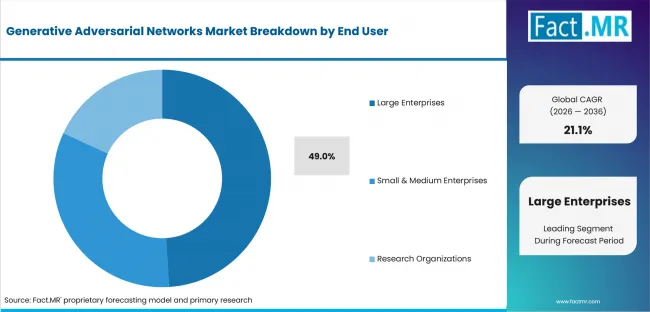
Generative Adversarial Networks Market Analysis By End User | Source: Fact.MR
Large enterprises can fund the buying group needed for production use. Data teams define model behavior. Platform teams manage deployment. Legal teams review permissions. Business units test whether output improves cost or speed.
What is accelerating Generative Adversarial Networks Market adoption, and what is holding it back?
Demand is expected to rise through synthetic data use. Growth may be limited by unstable training and data-rights concerns.
Drivers Impact Analysis
| DRIVER | RELATIVE IMPACT | GEOGRAPHIC RELEVANCE | IMPACT TIMELINE |
|---|---|---|---|
| Controllable synthetic visual data | High | USA, South Korea, UK | Short term (<= 2 years) |
| Cloud-based training access | High | USA, Canada, Australia | Short term (<= 2 years) |
| Enterprise governance requirements | Moderate | Germany, UK, Japan | Medium term (2-4 years) |
| Domain-specific data augmentation | Moderate | Japan, Germany, South Korea | Medium term (2-4 years) |
| Creative workflow integration | Low | USA, UK, Canada | Long term (>= 4 years) |
Source: Fact.MR analysis. Updated Aug 3, 2026
- Controllable synthetic visual data: Buyers are expected to use GANs when real images are limited by privacy or collection cost.
- Cloud-based training access: Elastic compute is expected to reduce early approval delays since teams can test model behavior before fixed infrastructure decisions.
- Enterprise governance requirements: Procurement teams are likely to favor suppliers that provide audit trails and access controls.
Opportunity Impact Analysis
| OPPORTUNITY | RELATIVE IMPACT | GEOGRAPHIC RELEVANCE | IMPACT TIMELINE |
|---|---|---|---|
| Governed domain-specific deployments | Moderate | Japan and Germany | Medium term (2-4 years) |
| Synthetic data for rare events | Moderate | USA and South Korea | Medium term (2-4 years) |
| Content authenticity tooling | Low | UK, USA, Canada | Long term (>= 4 years) |
| Enterprise model evaluation services | Low | Global enterprise buyers | Long term (>= 4 years) |
Source: Fact.MR analysis. Updated Aug 3, 2026
- Governed domain-specific deployments: The primary opening is controlled synthetic data where real observations are scarce or sensitive.
- Synthetic data for rare events: Buyers can test uncommon cases without waiting for enough real-world observations to appear in normal operations.
- Content authenticity tooling: Suppliers that attach credentials and usage permissions are expected to gain access to brand-sensitive workflows.
Restraints Impact Analysis
| RESTRAINT | RELATIVE IMPACT | GEOGRAPHIC RELEVANCE | IMPACT TIMELINE |
|---|---|---|---|
| Training instability and mode collapse | High | Global | Short term (<= 2 years) |
| Rights and consent risk | Moderate | USA, UK, Germany | Short term (<= 2 years) |
| GPU iteration cost | Moderate | Smaller buyers and pilot teams | Medium term (2-4 years) |
| Validation and renewal burden | Low | Regulated industries | Long term (>= 4 years) |
Source: Fact.MR analysis. Updated Aug 3, 2026
- Training instability and mode collapse: Output quality can shift during repeated training runs. This raises the time needed to reproduce acceptable results.
- GPU iteration cost: Heavy experimentation can raise project cost before the model reaches useful fidelity or control.
Which countries are scaling Generative Adversarial Networks Market fastest?
South Korea leads the listed countries at 22.5%, followed by the USA at 21.8%, Canada at 21.4%, the UK at 21.1%, Germany at 20.8%, Australia at 20.5% and Japan at 20.0%.
- South Korea leads because platform readiness and digital-content demand increase the need for controlled deployment evidence. The USA remains near the top through enterprise cloud use and larger buyer review capacity.
- Canada benefits from research commercialization and service-led enterprise adoption.
- The UK gains from media production and public-sector AI interest. Germany follows a documentation-led path where industrial buyers need reproducible proof.
- Australia develops demand through managed cloud use and integration support. Japan remains measured because supplier qualification and reliability review take priority.
Comparable CAGRs can therefore create different market entry conditions. Deployment timing depends on governance evidence and local service availability. Commercial readiness depends on whether buyers can name a repeatable output.
The full report provides country-level CAGR analysis across North America; Latin America; Western Europe; Eastern Europe; East Asia; South Asia and Pacific; and Middle East & Africa.
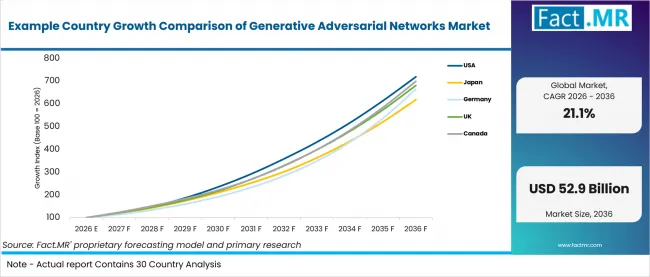
Example Country Growth Comparison Of Generative Adversarial Networks Market | Source: Fact.MR
| Country | CAGR (2026-2036) |
|---|---|
| South Korea | 22.5% |
| USA | 21.8% |
| Canada | 21.4% |
| UK | 21.1% |
| Germany | 20.8% |
| Australia | 20.5% |
| Japan | 20.0% |
Source: Fact.MR analysis. Updated Aug 3, 2026
What supports USA adoption?
21.8% CAGR, supported by enterprise cloud budgets and governed synthetic-media use.
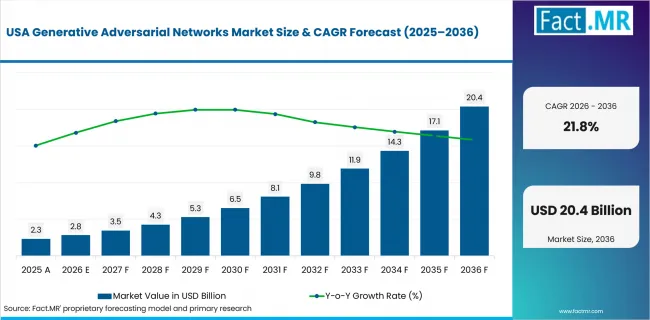
Generative Adversarial Networks Market Country Value Analysis | Source: Fact.MR
USA buyers often separate model experiments from enterprise deployment. Legal and security teams join after a use case shows repeatable value. Suppliers need clear evidence on data rights before broad rollout.
How is Japan scaling demand?
20.0% CAGR, driven by reliability-focused procurement and controlled rollout.
Japanese enterprises place weight on reliability before expanding a model. Supplier support and process fit matter during approval. Vendors gain ground when they explain output limits clearly.
What shapes Germany’s adoption route?
20.8% CAGR, backed by industrial data use and documentation-heavy procurement.
German buyers combine research demand with careful data review. Reproducibility is expected to guide supplier selection. Vendors with clear model records are better placed for enterprise accounts.
How does the UK build demand?
21.1% CAGR, supported by media production and public-sector AI interest.
The UK route is shaped by media users and university research. Creative teams can adopt faster when rights review is built into the tool. Enterprise demand improves when suppliers provide governance support.
What supports Canada’s outlook?
21.4% CAGR, led by research commercialization and enterprise services demand.
Canada’s outlook reflects AI research depth and cloud-based enterprise services. Buyers are expected to value partners that connect model development with privacy review.
How is Australia developing adoption?
20.5% CAGR, backed by managed cloud use and service integration.
Australian demand is expected to develop through enterprises that want practical AI workflows without specialized infrastructure. Managed deployment and local support are likely to matter most.
Why does South Korea lead the listed countries?
22.5% CAGR, supported by AI governance and digital-content activity.
South Korea’s lead reflects demand for controlled synthetic media. Digital-content workflows create a direct reason to test GAN tools. Buyers are expected to prefer suppliers with transparency features.
Who leads the Generative Adversarial Networks Market?
The listed companies span cloud and accelerated-compute providers, enterprise software vendors, creative-AI platforms, and synthetic-data specialists relevant to GAN workflows.
NVIDIA, Google, Microsoft and Amazon Web Services provide compute, cloud or model-development environments that can support GAN workloads. IBM, DataCebo, Gretel and YData offer enterprise data or synthetic-data capabilities, while Adobe and The MathWorks provide tools relevant to creative or technical model workflows. Buyers should verify the provider’s current GAN-specific capability for the intended use case.
Which companies are the key providers?
Key companies include NVIDIA Corporation, Google LLC, Microsoft Corporation, Adobe Inc., Amazon Web Services, Inc., IBM Corporation, DataCebo, Inc., Gretel Labs, Inc., YData Labs Inc., and The MathWorks, Inc.
- NVIDIA Corporation
- Google LLC
- Microsoft Corporation
- Adobe Inc.
- Amazon Web Services, Inc.
- IBM Corporation
- DataCebo, Inc.
- Gretel Labs, Inc.
- YData Labs Inc.
- The MathWorks, Inc.
Bibliography
- U.S. Government Accountability Office. (2025, April 22). Artificial intelligence: Generative AI’s environmental and human effects (GAO-25-107172).
- Adobe. (2025, February 12). Adobe expands generative AI offerings delivering new Firefly app with industry’s first commercially safe video model.
- Amazon Web Services. (2025, November 30). AWS Clean Rooms supports synthetic dataset generation for custom ML training.
This Report Answers
- The report provides strategic intelligence on the Generative Adversarial Networks Market across Deployment and Application choices that shape AI workflow adoption.
- Segment analysis covers Cloud-Based deployment and Image Generation & Editing as the share leaders within the 2026 market.
- Country outlook evaluates the USA and Japan alongside Germany and the UK. Canada and South Korea complete the upper comparison. Australia completes the profiled market set.
- Competitive analysis profiles NVIDIA Corporation and Google LLC. Microsoft Corporation and Adobe Inc. add enterprise and creative depth. Amazon Web Services and IBM complete the cloud group. DataCebo, Inc. and Meta Platforms add model depth. YData Labs Inc. and The MathWorks, Inc. complete the provider set.
- Technology assessment covers Conditional GAN and image-to-image translation. Guided image synthesis and Deep Convolutional GAN complete the technology view.
What does the Generative Adversarial Networks Market cover?
Generative adversarial networks create synthetic outputs through a generator and discriminator process. The market covers software and managed cloud tools used to train GAN workflows. It includes image generation and editing when the buyer uses GAN-based methods.
The market differs from general AI spending because value comes from controlled generation and review. General cloud infrastructure is excluded when revenue cannot be assigned to GAN workloads.
What is included in the scope?
The scope includes Cloud-Based and On-Premises deployment. Application coverage includes Image Generation & Editing; Image Synthesis; Super Resolution; and Video Generation. Technology coverage includes Conditional GAN and image-to-image translation.
Industry coverage includes Media & Entertainment and Healthcare. The scope covers implementation and support services when sold with a GAN workflow.
What is excluded from the scope?
The scope excludes general generative AI tools that do not use a GAN-enabled workflow. Broad infrastructure revenue and finished creative output revenue remain outside the boundary. Unpaid open-source use is excluded unless it leads to paid implementation or support. Internal labor cost is excluded when no commercial transaction occurs.
How Was the Analysis Built?
The analysis integrates public regulatory, technical, company and market evidence relevant to GAN software, deployment and synthetic-output workflows.
- Evidence Review: The review considers public technical documentation, company disclosures, policy materials and evidence relevant to deployment, output controls, data rights and application requirements.
- Market Sizing and Forecasting: Estimates combine paid GAN software and service revenue, deployment mix, application demand, enterprise adoption and country requirements within the stated market boundary.
- Market Monitoring: The analysis is reviewed as provider capabilities, model controls, buyer requirements and policy conditions change.
Segmentation
What is the report’s scope and coverage?
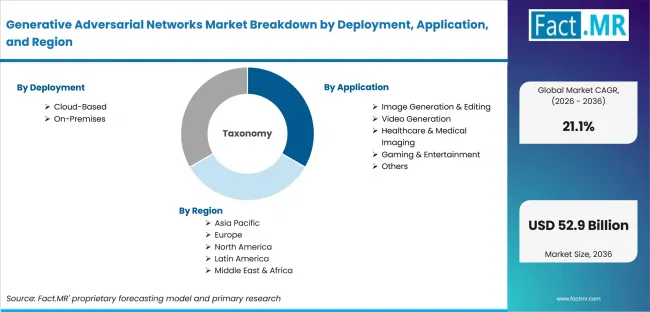
Generative Adversarial Networks Market Breakdown By Deployment, Application, And Region | Source: Fact.MR
| Attribute | Details |
|---|---|
| Quantitative Units | USD 7.8 billion in 2026 to USD 52.9 billion by 2036 at 21.1% CAGR |
| Market Definition | Revenue from GAN software, cloud access, APIs, model tools, implementation and support services used for GAN-based workflows |
| Deployment | Cloud-Based; Public Cloud; Private Cloud; On-Premises; Enterprise Infrastructure; Hybrid Deployment |
| Application | Image Generation & Editing; Image Synthesis; Super Resolution; Video Generation; Video Enhancement; Deepfake Generation; Healthcare & Medical Imaging; Diagnostic Imaging; Synthetic Medical Data; Gaming & Entertainment; Game Asset Creation; Virtual Characters; Others; Autonomous Vehicles; Cybersecurity |
| End User | Large Enterprises; Technology Companies; Media Enterprises; Small & Medium Enterprises; AI Startups; Digital Agencies; Research Organizations; Universities; R&D Institutes |
| Technology | Conditional GAN (CGAN); Image-to-Image Translation; Guided Image Synthesis; Deep Convolutional GAN (DCGAN); Image Generation; Feature Learning; CycleGAN; Domain Adaptation; StyleGAN; Wasserstein GAN (WGAN) |
| Industry Vertical | Media & Entertainment; Film Production; Content Creation; Healthcare; Medical Imaging; Drug Discovery; Automotive; Autonomous Driving; Simulation; Retail & E-commerce; Product Visualization; Marketing Content; Others; BFSI; Education; Manufacturing |
| Regions Covered | North America; Latin America; Western Europe; Eastern Europe; East Asia; South Asia and Pacific; Middle East & Africa |
| Key Countries Highlighted | South Korea; USA; Canada; UK; Germany; Australia; Japan |
| Key Companies Profiled | NVIDIA Corporation; Google LLC; Microsoft Corporation; Adobe Inc.; Amazon Web Services, Inc.; IBM Corporation; DataCebo, Inc.; Gretel Labs, Inc.; YData Labs Inc.; The MathWorks, Inc. |
| Forecast Period | 2026 to 2036 |
| Approach | Estimates combine paid GAN software and service revenue, deployment mix, application demand, enterprise adoption and country requirements within the stated market boundary. |
Source: Fact.MR analysis. Updated Aug 3, 2026
How is the market segmented?
-
By Deployment:
- Cloud-Based
- Public Cloud
- Private Cloud
- On-Premises
- Enterprise Infrastructure
- Hybrid Deployment
- Cloud-Based
-
By Application:
- Image Generation & Editing
- Image Synthesis
- Super Resolution
- Video Generation
- Video Enhancement
- Deepfake Generation
- Healthcare & Medical Imaging
- Diagnostic Imaging
- Synthetic Medical Data
- Gaming & Entertainment
- Game Asset Creation
- Virtual Characters
- Others
- Autonomous Vehicles
- Cybersecurity
- Image Generation & Editing
-
By End User:
- Large Enterprises
- Technology Companies
- Media Enterprises
- Small & Medium Enterprises
- AI Startups
- Digital Agencies
- Research Organizations
- Universities
- R&D Institutes
- Large Enterprises
-
By Technology:
- Conditional GAN (CGAN)
- Image-to-Image Translation
- Guided Image Synthesis
- Deep Convolutional GAN (DCGAN)
- Image Generation
- Feature Learning
- CycleGAN
- Domain Adaptation
- Image Translation
- Others
- StyleGAN
- Wasserstein GAN (WGAN)
- Conditional GAN (CGAN)
-
By Industry Vertical:
- Media & Entertainment
- Film Production
- Content Creation
- Healthcare
- Medical Imaging
- Drug Discovery
- Automotive
- Autonomous Driving
- Simulation
- Retail & E-commerce
- Product Visualization
- Marketing Content
- Others
- BFSI
- Education
- Manufacturing
- Media & Entertainment
-
By Region:
- North America
- Latin America
- Western Europe
- Eastern Europe
- East Asia
- South Asia and Pacific
- Middle East & Africa
Frequently Asked Questions
Which Deployment leads the market?
Which Application leads the market?
Which End User leads the market?
Which country records the highest listed CAGR?
What is the primary driver in this market?
What is the main restraint?
Why do Large Enterprises lead demand?
How are suppliers expected to compete?
Who worked on this report


Preview the report firsthand - request a free sample
Free SampleGet the brochure for pricing and purchase details
Download PDF