- Market Value (2025): USD 642.4 Mn
- Estimated Value (2026): USD 740.0 Mn
- Forecast Value (2036): USD 3050.0 Mn
- CAGR (2026-2036): 15.2%
What is the Green DevOps and Carbon Aware CI CD Software Market forecast to be worth by 2036?
USD 740.0 million in 2026 to USD 3,050.0 million by 2036 at 15.2% CAGR.
- The green DevOps and carbon aware CI CD software market reached USD 642.4 million in 2025 as cloud-native software delivery started to include carbon reporting and release timing controls.
- Demand is projected to increase from USD 740.0 million in 2026 to USD 3050.0 million by 2036.
- The market is forecast to record 15.2% CAGR from 2026 to 2036 owing to pipeline optimization and wider enterprise use of automated build systems.
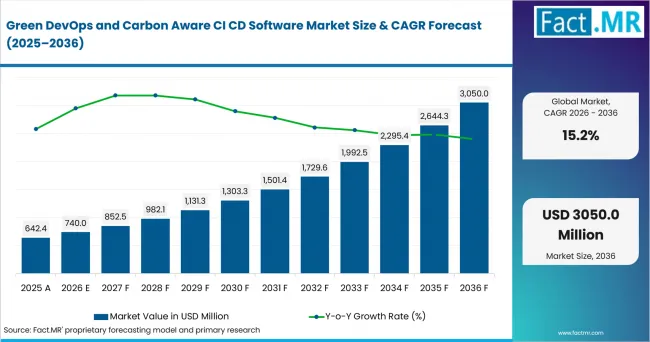
Green Devops And Carbon Aware Ci Cd Software Market Value Analysis | Source: Fact.MR
What are the defining numbers behind Green DevOps and Carbon Aware CI CD Software Market growth?
USD 2,300 million absolute opportunity is forecast by 2036.
- Demand Drivers in the Market
- Cloud-native engineering teams need release tools that can time compute-intensive builds around lower-carbon electricity windows.
- Enterprises using cloud native technologies are expected to add sustainability checks to the same systems used for software quality and security approval.
- Platform teams benefit when CI/CD tools connect emissions estimates with build duration and release governance.
- Key Segments Analyzed
- By Software Suite: Carbon-aware CI/CD Platforms are expected to hold 43.0% share in 2026 because they operate inside core release workflows.
- By Primary Application: Carbon-efficient Build Optimization is projected to account for 39.0% share in 2026 as enterprises target compute-heavy stages of software delivery.
- By End User: Large Enterprises are anticipated to capture 46.0% share in 2026 since they operate many repositories and governance checkpoints.
- By Deployment Model: Cloud-based Deployment is estimated to represent 58.0% share in 2026 due to easier rollout across distributed engineering teams.
- By Optimization Technology: Carbon-aware Workload Scheduling is forecast to hold 44.0% share in 2026 as teams move flexible jobs toward lower-emission compute windows.
- Analyst Opinion at Fact.MR
- Shambhu Nath Jha, Senior Consultant at Fact.MR, states, “Green DevOps tools are moving from optional sustainability dashboards into release governance. Buyers are expected to value platforms that reduce waste in build pipelines, document carbon signals and still protect developer speed during daily delivery cycles.”
- Strategic Implications
- Software vendors should connect carbon-aware scheduling with existing CI/CD controls so engineering teams avoid a separate sustainability workflow.
- Cloud providers can strengthen adoption by exposing grid-carbon signals and pipeline execution controls inside developer platforms.
- Enterprise buyers should assess whether each platform supports emissions reporting without adding manual approval steps to every release.
The USA leads at 16.4% CAGR through cloud infrastructure scale and enterprise DevOps maturity. Germany follows at 15.8% as industrial software teams add efficiency checks to digital operations. The UK reaches 15.1% through financial services and professional software delivery. Canada records 14.5% through cloud adoption and technology services. Singapore posts 13.8% through regional headquarters activity. Japan reaches 13.2% through enterprise modernization. Australia records 12.6% through cloud adoption and public-sector digital programs.
How does the Green DevOps and Carbon Aware CI CD Software Market break down by segment?
Carbon-aware CI/CD Platforms are expected to lead Software Suite at 43.0% share in 2026. Carbon-efficient Build Optimization is projected to lead Primary Application at 39.0% share in 2026.
Which software suite dominates?
Carbon-aware CI/CD Platforms are projected to account for 43.0% share in 2026.
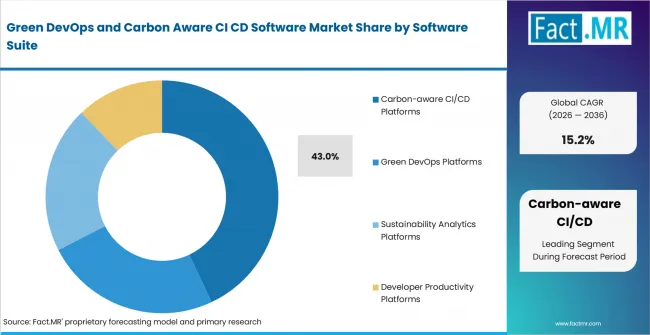
Green Devops And Carbon Aware Ci Cd Software Market Analysis By Software Suite | Source: Fact.MR
Their dominance comes from control over build and deployment stages, where compute timing can be adjusted without disrupting software delivery. Emissions-aware analytics add the measurement layer, while pipeline tools create value by turning carbon signals into practical release decisions. This keeps the segment closely tied to enterprise digital decarbonization work.
What leads the Primary Application segment?
Carbon-efficient Build Optimization is expected to hold 39.0% share in 2026.
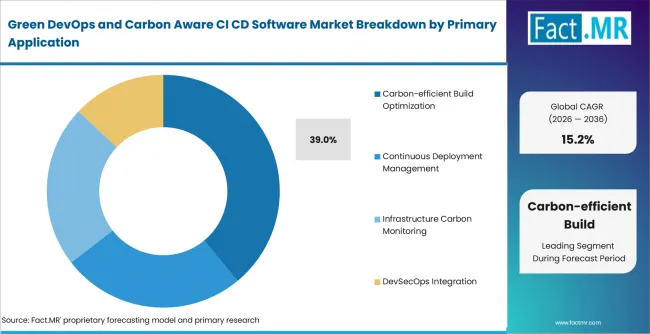
Green Devops And Carbon Aware Ci Cd Software Market Analysis By Primary Application | Source: Fact.MR
Large codebases generate repeated build and test jobs across many development teams. Optimizing these jobs reduces wasted compute, lowers developer wait time and improves pipeline efficiency. Once teams identify the most resource-heavy jobs, energy-aware test scheduling becomes a practical next step.
How do Large Enterprises shape demand?
Large Enterprises are anticipated to lead with 46.0% share in 2026.
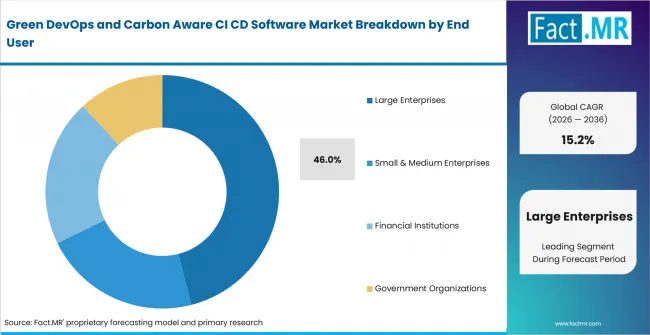
Green Devops And Carbon Aware Ci Cd Software Market Analysis By End User | Source: Fact.MR
Enterprise demand is shaped by the scale of software delivery across multiple business units, repositories and approval workflows. Centralized governance becomes important when carbon policies need to apply consistently across teams. Smaller software vendors may adopt faster, but larger buyers create greater spending because implementation reaches more pipelines.
What supports Cloud-based Deployment?
Cloud-based Deployment is estimated to represent 58.0% share in 2026.
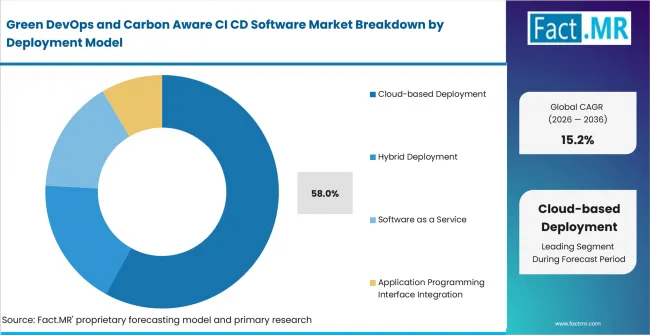
Green Devops And Carbon Aware Ci Cd Software Market Analysis By Deployment Model | Source: Fact.MR
Cloud deployment fits Green DevOps because carbon signals, build metrics and pipeline updates can be managed across distributed teams. It also supports faster rollout where software teams already work in shared development environments. Hybrid and on-premise models remain relevant for regulated buyers or security-sensitive monitoring needs.
Why does Carbon-aware Workload Scheduling lead Optimization Technology?
Carbon-aware Workload Scheduling is forecast to hold 44.0% share in 2026.
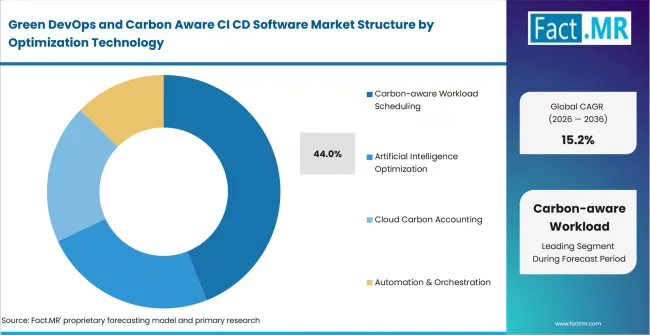
Green Devops And Carbon Aware Ci Cd Software Market Analysis By Optimization Technology | Source: Fact.MR
This technology gains priority because many CI/CD jobs do not need to run immediately. Teams can shift non-urgent builds toward cleaner grid periods without changing product code. Real-time grid signals, caching and serverless environments strengthen this approach by making workload timing easier to adjust.
What is accelerating Green DevOps and Carbon Aware CI CD Software Market adoption, and what is holding it back?
Demand is expected to rise through carbon-aware release control and lower wasted compute. Growth may be limited by integration work and uneven carbon data quality.
Drivers Impact Analysis
| DRIVER | (~) % IMPACT ON CAGR | GEOGRAPHIC RELEVANCE | IMPACT TIMELINE |
|---|---|---|---|
| Carbon-aware CI/CD workflow adoption | +3.6% | North America, Europe | Short term (<= 2 years) |
| Cloud infrastructure emissions visibility | +2.9% | Global | Short term (<= 2 years) |
| Enterprise software governance | +2.4% | USA, Germany, UK | Medium term (2-4 years) |
| Developer productivity and cost control | +1.7% | Global | Medium term (2-4 years) |
| Sustainability reporting alignment | +1.1% | North America, Europe, Singapore | Long term (>= 4 years) |
- Carbon-aware CI/CD workflow adoption: Engineering teams are expected to add carbon checks inside release tools because the pipeline is where scheduling choices can be automated.
- Cloud infrastructure emissions visibility: Buyers need cloud-region signals and usage data before software delivery can feed wider carbon reporting across cloud managed services.
- Enterprise software governance: Large buyers are expected to combine sustainability controls with quality and security approval steps.
Opportunity Impact Analysis
| OPPORTUNITY | (~) % IMPACT ON CAGR | GEOGRAPHIC RELEVANCE | IMPACT TIMELINE |
|---|---|---|---|
| Pipeline-level carbon dashboards | +1.5% | USA, UK, Germany | Medium term (2-4 years) |
| AI-assisted build tuning | +1.2% | Cloud-first markets | Medium term (2-4 years) |
| Low-carbon deployment windows | +0.9% | Europe, Singapore, Australia | Long term (>= 4 years) |
| Managed Green DevOps services | +0.7% | Canada, Japan, Australia | Long term (>= 4 years) |
- Pipeline-level carbon dashboards: DevOps leaders are expected to prefer tools that show emissions signals beside cost and application performance metrics within data center asset management workflows.
- AI-assisted build tuning: AI software can help teams identify jobs that should be cached or delayed without forcing developers to inspect every pipeline manually.
- Low-carbon deployment windows: Release teams can shift non-urgent workloads when customer risk is low and carbon intensity is more favorable.
Restraints Impact Analysis
| RESTRAINT | (~) % IMPACT ON CAGR | GEOGRAPHIC RELEVANCE | IMPACT TIMELINE |
|---|---|---|---|
| Carbon data inconsistency | -1.4% | Global | Short term (<= 2 years) |
| Pipeline integration complexity | -1.0% | Large enterprises | Short term (<= 2 years) |
| Developer workflow resistance | -0.8% | Global | Medium term (2-4 years) |
| Budget competition with core DevOps tools | -0.6% | Developing markets | Long term (>= 4 years) |
- Carbon data inconsistency: Grid signals and cloud emissions factors can differ by provider and region. This makes comparable reporting difficult for enterprise buyers.
- Pipeline integration complexity: Legacy release processes and fragmented toolchains raise setup effort before carbon-aware scheduling can produce repeatable results.
- Developer workflow resistance: Engineering teams may resist controls that slow urgent builds. Vendors therefore need automation that protects release speed.
Which countries are scaling Green DevOps and Carbon Aware CI CD Software Market fastest?
- The country comparison spans 3.8 percentage points and forms three practical growth bands across the forecast period.
- The USA remains 0.6 percentage points above Germany through cloud infrastructure scale and mature software delivery practices.
- Germany remains 0.7 percentage points above the UK as industrial software teams add efficiency controls to digital operations.
- The UK remains 0.6 percentage points above Canada through financial services and professional software delivery.
- Canada remains 0.7 percentage points above Singapore as cloud migration supports Green DevOps evaluation.
- Singapore remains 0.6 percentage points above Japan through regional headquarters activity and cloud-first enterprise operations.
- Japan remains 0.6 percentage points above Australia as enterprise modernization supports structured release governance.
Comparable CAGRs can create different entry conditions due to software maturity and procurement rules. Full report coverage includes North America and Latin America. Coverage extends to Europe and East Asia. South Asia and Pacific and Middle East and Africa are included.
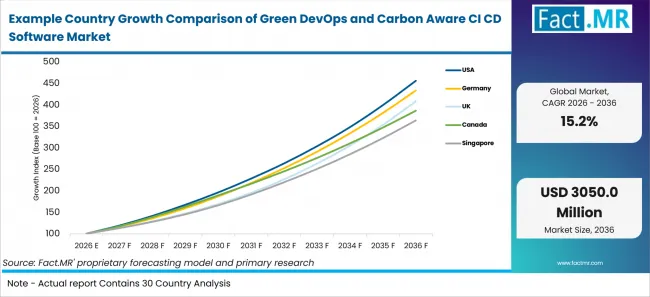
Example Country Growth Comparison Of Green Devops And Carbon Aware Ci Cd Software Market | Source: Fact.MR
| Country | CAGR (2026-2036) |
|---|---|
| USA | 16.4% |
| Germany | 15.8% |
| UK | 15.1% |
| Canada | 14.5% |
| Singapore | 13.8% |
| Japan | 13.2% |
| Australia | 12.6% |
What supports USA adoption?
16.4% CAGR, supported by cloud platform depth and enterprise DevOps maturity.
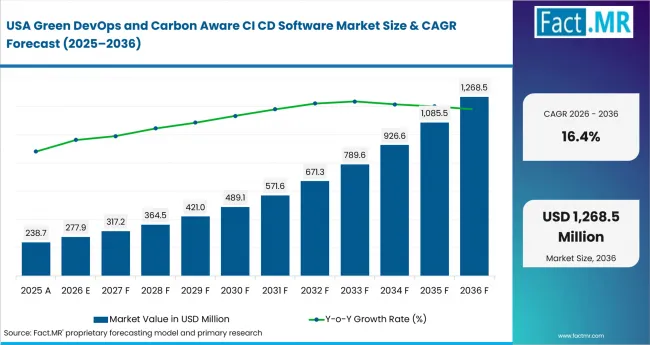
Green Devops And Carbon Aware Ci Cd Software Market Country Value Analysis | Source: Fact.MR
The USA benefits from advanced build, testing and deployment workflows already used across large software teams. Adoption is likely to center on tools that cut unnecessary compute consumption while keeping urgent releases fast and reliable.
How is Germany scaling demand?
15.8% CAGR, driven by industrial digitalization and manufacturing software demand.
Germany’s demand is shaped by modernization programs across industrial and manufacturing software environments. Buyers are expected to move carefully, with tool approval tied to IT governance, supplier validation and compatibility with existing enterprise systems.
What is driving the UK from 2026 to 2036?
15.1% CAGR, backed by financial services and professional software delivery.
The UK’s growth comes from banks, fintech firms and software service providers that manage frequent release cycles. Regulated applications may require slower adoption because security review and compliance controls remain central to platform changes.
How is Canada developing demand?
14.5% CAGR, supported by cloud adoption and technology-sector growth.
Canada’s market is likely to expand through software vendors, cloud users and managed service providers. For many buyers, approval will depend on whether carbon-aware tools also support cloud cost control and sustainability reporting needs.
What supports Singapore’s growth?
13.8% CAGR, backed by regional headquarters activity and financial technology.
Singapore’s position reflects regional IT teams that manage cloud platforms across multiple markets. These buyers are likely to prefer cloud-based tools that provide clear reporting for leadership while supporting consistent DevOps practices across distributed teams.
How does Japan perform?
13.2% CAGR, led by enterprise technology modernization.
Japan’s adoption path is expected to be steady rather than rapid, as large enterprises modernize software delivery without disrupting operational stability. Vendor support, documentation and integration assistance are likely to play a major role in approval decisions.
What supports Australia’s growth?
12.6% CAGR, supported by cloud adoption and digital government programs.
Australia’s growth reflects enterprise cloud migration, public-sector modernization and rising interest in efficient software delivery. Managed service providers can support adoption where smaller teams need help applying carbon-aware scheduling without adding operational complexity.
Who leads the Green DevOps and Carbon Aware CI CD Software Market?
Microsoft Corporation and GitLab Inc. show direct relevance through developer platforms and pipeline automation. GitHub, AWS and Google strengthen the cloud delivery layer. IBM and Red Hat add hybrid-cloud automation. HashiCorp, Dynatrace and New Relic add governance and observability depth.
Microsoft and GitLab support CI/CD workflow control. GitHub, AWS and Google support cloud-region choice. IBM and Red Hat add infrastructure governance. HashiCorp, Dynatrace and New Relic add monitoring relevance for data center accelerator workloads.
Which companies are the key providers?
Key companies include Microsoft Corporation, GitLab Inc., GitHub, Inc., Amazon Web Services, Inc., Google LLC – Google Cloud, IBM Corporation, Red Hat, Inc., Cycloid SAS, Dynatrace LLC, and Greenpixie Ltd.
- Microsoft Corporation
- GitLab Inc.
- GitHub, Inc.
- Amazon Web Services, Inc.
- Google LLC – Google Cloud
- IBM Corporation
- Red Hat, Inc.
- Cycloid SAS
- Dynatrace LLC
- Greenpixie Ltd.
Bibliography
- GitHub, Inc. (2024, October 29). Octoverse: AI leads Python to top language as the number of global developers surges.
- GitLab Inc. (2024, June 25). GitLab survey reveals tension around AI, security, and developer productivity within organizations.
- Green Software Foundation (2024, April 16). Celebrating the Graduation of the Carbon Aware SDK.
This Report Answers
- The report provides strategic intelligence on Software Suite and Primary Application choices that shape enterprise pipeline optimization.
- Segment analysis covers Carbon-aware CI/CD Platforms and Carbon-efficient Build Optimization as the share leaders within the 2026 market.
- Country outlook evaluates the USA and Germany alongside the UK and Canada. Singapore, Japan and Australia complete the profiled markets.
- Competitive analysis profiles Microsoft Corporation and GitLab Inc. The review covers GitHub, AWS and Google. IBM and Red Hat are included. HashiCorp completes the provider set with Dynatrace and New Relic.
- Technology assessment covers Carbon-aware Workload Scheduling and Real-time Grid Carbon Signals. Build-cache Optimization, AI-assisted Pipeline Tuning and Energy-aware Test Selection complete the process view.
What does the Green DevOps and Carbon Aware CI CD Software Market cover?
Green DevOps and Carbon Aware CI CD Software helps software teams reduce wasted compute and schedule pipeline activity around lower-emission conditions.
The market covers carbon-aware CI/CD platforms and build optimization. It includes emissions-aware DevOps analytics and developer carbon reporting. Grid signals and AI-assisted tuning are included.
What is included in the scope?
Green DevOps tools are used across large enterprises and cloud-native software vendors. Financial services firms, technology services providers and public-sector teams are included.
The scope includes Software Suite and Primary Application alongside End User, Deployment Model and Optimization Technology. It covers tools that connect build activity with carbon signals and release governance.
What is excluded from the scope?
General ESG reporting software and unrelated cloud cost tools remain outside the scope of this market.
The scope excludes sustainability platforms that do not address software delivery workflows. General DevOps tools and cloud billing platforms are excluded unless they provide carbon-aware controls.
How Was the Analysis Built?
The analysis draws on 120+ sources, 35+ company portfolios, 25+ countries, and more than 20 interviews.
- Primary Research: Interviews with manufacturers, retailers, salon operators, and experts examine purchase priorities, adoption, approval requirements, and competitive positioning.
- Desk Research: Desk research covers government statistics, regulatory publications, company filings, trade data, technical studies, industry associations, standards, and public policy.
- Market Sizing and Forecasting: Estimates combine historical performance, demand indicators, pricing, segment shares, company participation, country growth, adoption patterns, and barriers to expansion.
- Data Validation and Update Cycle: Findings are validated against public data, company activity, regulatory changes, product launches, recalls, and adoption shifts.
What is the report's scope and coverage?
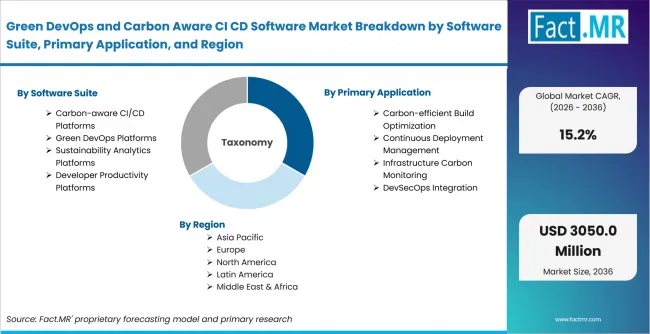
Green Devops And Carbon Aware Ci Cd Software Market Breakdown By Software Suite, Primary Application, And Region | Source: Fact.MR
| Attribute | Details |
|---|---|
| Quantitative Units | USD million in 2026 to USD million by 2036 at CAGR |
| Market Definition | Software used to reduce emissions from code build, test, deployment and release governance where carbon signals and compute scheduling determine adoption |
| Software Suite | Carbon-aware CI/CD Platforms; Emissions-aware DevOps Analytics; Green Build Orchestration Tools; Sustainable Infrastructure-as-Code Tools; Developer Carbon Reporting Dashboards |
| Primary Application | Carbon-efficient Build Optimization; Energy-aware Test Scheduling; Low-carbon Deployment Windows; Cloud Region Carbon Selection; Software Carbon Reporting |
| End User | Large Enterprises; Cloud-native Software Vendors; Financial Services Firms; Technology Services Providers; Government and Public Sector Teams |
| Deployment Model | Cloud-based Deployment; Hybrid Deployment; On-premise Deployment; Managed Service Deployment |
| Optimization Technology | Carbon-aware Workload Scheduling; Real-time Grid Carbon Signals; Build-cache Optimization; AI-assisted Pipeline Tuning; Energy-aware Test Selection |
| Regions Covered | North America; Latin America; Europe; East Asia; South Asia and Pacific; Middle East and Africa |
| Countries Covered | USA; Germany; UK; Canada; Singapore; Japan; Australia |
| Key Companies Profiled | Microsoft Corporation; GitLab Inc.; GitHub, Inc.; Amazon Web Services, Inc.; Google LLC – Google Cloud; IBM Corporation; Red Hat, Inc.; Cycloid SAS; Dynatrace LLC; Greenpixie Ltd. |
| Forecast Period | 2026 to 2036 |
| Approach | Hybrid top-down and bottom-up approach using enterprise software demand; CI/CD platform adoption; cloud migration; delivery frequency; carbon signal availability; country adoption patterns and company portfolio review |
How is the market segmented?
-
By Software Suite
- Carbon-aware CI/CD Platforms
- Pipeline Carbon Optimization
- Emission Monitoring Dashboards
- Green DevOps Platforms
- Release Optimization Tools
- Resource Utilization Monitoring
- Sustainability Analytics Platforms
- Cloud Emission Analytics
- Application Carbon Dashboards
- Developer Productivity Platforms
- Green Developer Toolkits
- Engineering Productivity Analytics
- Carbon-aware CI/CD Platforms
-
By Primary Application
- Carbon-efficient Build Optimization
- Build Energy Optimization
- Continuous Integration Optimization
- Continuous Deployment Management
- Green Software Delivery
- Application Lifecycle Sustainability
- Infrastructure Carbon Monitoring
- Container Energy Monitoring
- Kubernetes Sustainability
- DevSecOps Integration
- Secure Sustainable Delivery
- Continuous Compliance Automation
- Carbon-efficient Build Optimization
-
By End User
- Large Enterprises
- Global Technology Companies
- Cloud Service Providers
- Small & Medium Enterprises
- Application Development Firms
- Managed Service Providers
- Financial Institutions
- Banking Organizations
- Healthcare Organizations
- Government Organizations
- Public Sector Agencies
- Educational & Research Institutions
- Large Enterprises
-
By Deployment Model
- Cloud-based Deployment
- Public Cloud
- Private Cloud
- Hybrid Deployment
- On-premises Deployment
- Edge-enabled Infrastructure
- Software as a Service
- Managed Cloud Services
- Multi-cloud Platform
- Application Programming Interface Integration
- Low-code Integration
- Enterprise System Integration
- Cloud-based Deployment
-
By Optimization Technology
- Carbon-aware Workload Scheduling
- Energy-aware Scheduling Algorithms
- Real-time Carbon Intensity Analytics
- Artificial Intelligence Optimization
- Machine Learning Optimization
- Automated Resource Allocation
- Cloud Carbon Accounting
- Cloud Resource Optimization
- Kubernetes-aware Scheduling
- Automation & Orchestration
- Intelligent Workflow Automation
- Predictive Carbon Intelligence
- Carbon-aware Workload Scheduling
-
By Region
- North America
- Latin America
- Western Europe
- Eastern Europe
- East Asia
- South Asia and Pacific
- Middle East & Africa