- Market Value (2025): USD 2.3 Bn
- Estimated Value (2026): USD 2.6 Bn
- Forecast Value (2036): USD 8.9 Bn
- CAGR (2026-2036): 13.1%
What is the Green IT Asset Management ITAM Software Market forecast to be worth by 2036?
USD 2.6 billion in 2026 to USD 8.9 billion by 2036 at 13.1% CAGR.
- The green IT asset management ITAM software market reached USD 2.3 billion in 2025 as enterprise asset inventories became harder to govern across cloud and device estates.
- Demand is forecast to increase from USD 2.6 billion in 2026 to USD 8.9 billion by 2036.
- The market is projected to expand at 13.1% CAGR from 2026 to 2036.
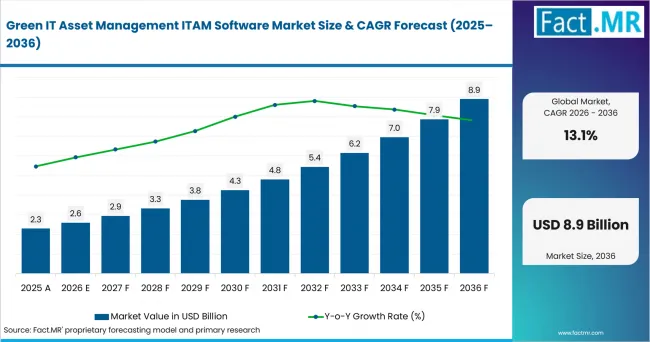
Green It Asset Management Itam Software Market Value Analysis | Source: Fact.MR
What are the defining numbers behind Green IT Asset Management ITAM Software Market growth?
USD 6.3 billion absolute opportunity by 2036 is led by IT asset lifecycle management and asset lifecycle optimization.
- Demand Drivers in the Market
- Enterprise technology estates are expected to require asset records that cover devices and software licenses. Cloud accounts and retirement status add further control needs.
- License renewal pressure is anticipated to keep ITAM tools close to procurement and finance teams.
- Cloud cost reviews are projected to support demand for Green ITAM platforms that compare owned assets with cloud computing estates.
- Sustainability teams are expected to need clearer evidence on reuse and life extension. E-waste handling must be documented before reporting cycles close.
- Key Segments Analyzed
- By Software Module: IT Asset Lifecycle Management is expected to hold 42.0% share in 2026 because it gives enterprises the main control layer for device status and retirement.
- By Application: Asset Lifecycle Optimization is projected to account for 38.0% share in 2026 as buyers look for longer equipment use and lower waste.
- By End User: Large Enterprises are anticipated to capture 44.0% share in 2026 since multi-site technology estates require stronger governance.
- By Deployment Model: Cloud-based Deployment is estimated to represent 61.0% share in 2026 as IT teams prefer faster rollout and remote access.
- By Sustainability Capability: Carbon Footprint Analytics is forecast to hold 47.0% share in 2026 because asset data is becoming part of sustainability reporting.
- Analyst Opinion at Fact.MR
- Shambhu Nath Jha, Senior Consultant at Fact.MR, states, “Green ITAM software is becoming a practical control point for enterprises that need technology inventory and sustainability evidence. Buyers are expected to favor platforms that combine asset lifecycle data with license governance and carbon reporting without heavy manual work.”
- Strategic Implications
- Software vendors should place lifecycle status and license exposure inside the same workspace. Sustainability fields should be visible there as well.
- Service providers can support buyers by cleaning asset records before implementation starts.
- Enterprise IT teams should align procurement and finance owners before platform selection. Security and sustainability owners should join the same review.
The USA leads at 14.2% CAGR through enterprise software scale and cloud operations. Germany follows at 13.7% as industrial digitalization shapes asset governance. The UK reaches 13.2%. Singapore records 12.6%, Canada posts 12.0% and Japan reaches 11.5%. Australia reaches 10.9%.
How does the Green IT Asset Management ITAM Software Market break down by segment?
IT Asset Lifecycle Management leads Software Module at 42.0% share in 2026. Asset Lifecycle Optimization leads Application at 38.0% share in 2026.
Why does IT Asset Lifecycle Management lead Software Module?
IT Asset Lifecycle Management is projected to account for 42.0% share in 2026.
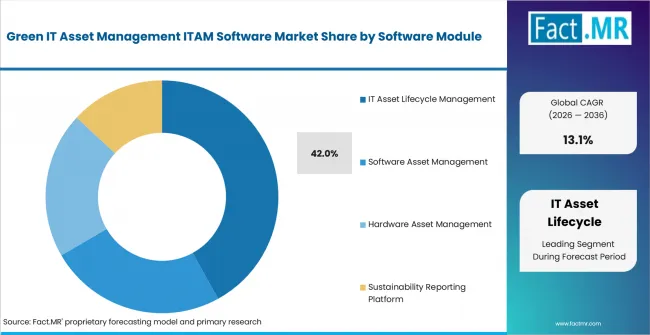
Green It Asset Management Itam Software Market Analysis By Software Module | Source: Fact.MR
Enterprises need one governed record from request to retirement. This module is expected to lead because it shows active assets and idle devices inside the same workflow. Reused equipment and retired stock stay visible as well. Buyers can use that record to support data center asset controls and wider technology governance.
Why does Asset Lifecycle Optimization lead Application?
Asset Lifecycle Optimization is expected to hold 38.0% share in 2026.
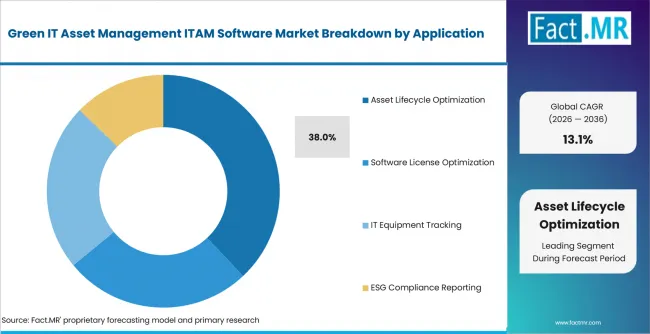
Green It Asset Management Itam Software Market Analysis By Application | Source: Fact.MR
Cost pressure gives this application a clear role in purchase timing. It helps teams compare repair and reuse choices before a new buying cycle starts. Replacement and disposal timing can then follow the same record. The commercial value is strongest where asset age and license status affect the same budget decision.
Why do Large Enterprises lead End User?
Large Enterprises are anticipated to represent 44.0% share in 2026.
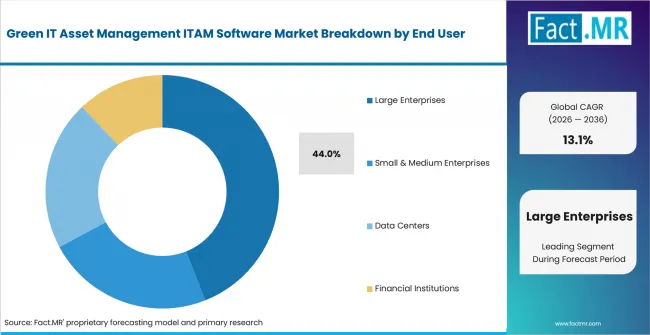
Green It Asset Management Itam Software Market Analysis By End User | Source: Fact.MR
Large enterprises manage hardware and software across many owners. SaaS and cloud portfolios add another control layer. Separate tools make verified ownership and retirement data hard to maintain. Green ITAM platforms are expected to gain preference when they reduce duplicate records and make audit preparation calmer.
Why does Cloud-based Deployment lead Deployment Model?
Cloud-based Deployment is estimated to account for 61.0% share in 2026.
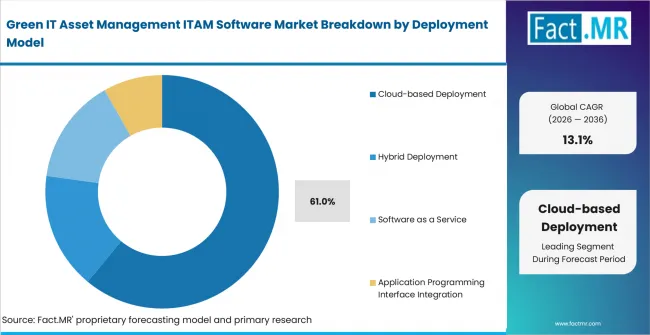
Green It Asset Management Itam Software Market Analysis By Deployment Model | Source: Fact.MR
Distributed IT teams need access to asset records without waiting for local infrastructure. Cloud deployment gives faster rollout and easier updates for multi-location estates. It fits enterprises that already rely on public cloud services and remote administration.
Why does Carbon Footprint Analytics lead Sustainability Capability?
Carbon Footprint Analytics is forecast to hold 47.0% share in 2026.
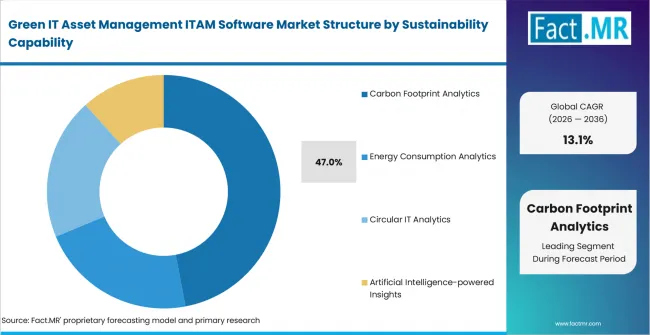
Green It Asset Management Itam Software Market Analysis By Sustainability Capability | Source: Fact.MR
Sustainability teams need asset-level evidence before they can explain refresh and retirement choices. Carbon analytics is expected to lead because it turns inventory data into reporting inputs.
What is accelerating Green IT Asset Management ITAM Software Market adoption, and what is holding it back?
Demand is expected to rise through stronger asset governance and sustainability reporting. Growth is likely to be limited by fragmented inventories and integration cost.
Drivers Impact Analysis
| DRIVER | (~) % IMPACT ON CAGR | GEOGRAPHIC RELEVANCE | IMPACT TIMELINE |
|---|---|---|---|
| Enterprise asset visibility | +3.4% | North America, Europe | Short term (<= 2 years) |
| Software license governance | +2.6% | USA, Germany, UK | Short term (<= 2 years) |
| Cloud and SaaS control | +2.2% | Global enterprises | Medium term (2-4 years) |
| Sustainability reporting need | +1.7% | Europe, Japan, Australia | Medium term (2-4 years) |
| E-waste lifecycle governance | +1.1% | Regulated enterprise markets | Long term (>= 4 years) |
- Enterprise asset visibility: IT teams are expected to value platforms that show hardware and software assets in one governed record. Cloud and SaaS assets add the next layer.
- Software license governance: Audit pressure is anticipated to keep license rights and real use close to finance and procurement decisions.
- Cloud and SaaS control: ITAM platforms that work with managed cloud environments are expected to improve spend control.
Opportunity Impact Analysis
| OPPORTUNITY | (~) % IMPACT ON CAGR | GEOGRAPHIC RELEVANCE | IMPACT TIMELINE |
|---|---|---|---|
| Carbon-aware asset records | +1.5% | Europe and North America | Medium term (2-4 years) |
| Automated disposal workflows | +1.1% | USA, UK, Australia | Medium term (2-4 years) |
| SaaS and hardware reconciliation | +0.9% | Global enterprises | Long term (>= 4 years) |
| Procurement integration | +0.6% | Large enterprise buyers | Long term (>= 4 years) |
- Carbon-aware asset records: Platforms that complement energy intelligence tools are expected to appeal to reporting-led buyers.
- Automated disposal workflows: Buyers are likely to prefer tools that document reuse and redeployment. Donation, resale or certified recycling steps can follow the same workflow.
- SaaS and hardware reconciliation: Vendors that combine application usage with device ownership are expected to win complex accounts.
Restraints Impact Analysis
| RESTRAINT | (~) % IMPACT ON CAGR | GEOGRAPHIC RELEVANCE | IMPACT TIMELINE |
|---|---|---|---|
| Fragmented legacy inventories | -1.3% | Global | Short term (<= 2 years) |
| Integration cost and data cleanup | -1.0% | Mid-market and large estates | Short term (<= 2 years) |
| Weak process ownership | -0.8% | Distributed enterprises | Medium term (2-4 years) |
| Limited sustainability data quality | -0.5% | Emerging reporting markets | Long term (>= 4 years) |
- Fragmented legacy inventories: Old records are expected to slow implementation when asset owners and device status do not match.
- Integration cost and data cleanup: Migration work can delay rollout when CMDB and endpoint data use different names. Procurement and SaaS records add another cleanup layer.
- Weak process ownership: Projects are expected to stall when IT and finance teams disagree on asset responsibility. Security and sustainability teams must be aligned early.
Which countries are scaling Green IT Asset Management ITAM Software Market fastest?
- The country comparison spans 3.3% points and forms three practical growth bands across the forecast period.
- The USA remains 0.5% point above Germany through enterprise software depth and cloud operations.
- Germany remains 0.5% point above the UK as industrial digitalization supports asset governance.
- The UK remains 0.6% point above Singapore through finance-led software control and service-sector demand.
- Singapore remains 0.6% point above Canada through regional headquarters and technology operations.
- Canada remains 0.5% point above Japan as technology firms widen ITAM and cloud governance use.
- Japan remains 0.6% point above Australia through enterprise modernization and disciplined lifecycle controls.
Comparable CAGRs create different buying conditions because enterprise size and compliance maturity vary by country. Cloud activity and sustainability reporting pressure shape local purchase timing.
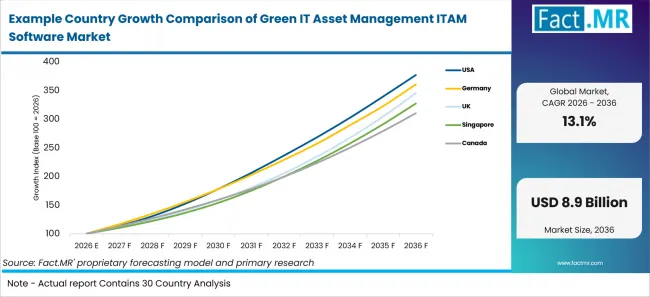
Example Country Growth Comparison Of Green It Asset Management Itam Software Market | Source: Fact.MR
| Country | CAGR (2026-2036) |
|---|---|
| USA | 14.2% |
| Germany | 13.7% |
| UK | 13.2% |
| Singapore | 12.6% |
| Canada | 12.0% |
| Japan | 11.5% |
| Australia | 10.9% |
What supports USA adoption?
14.2% CAGR, supported by software scale and cloud maturity.
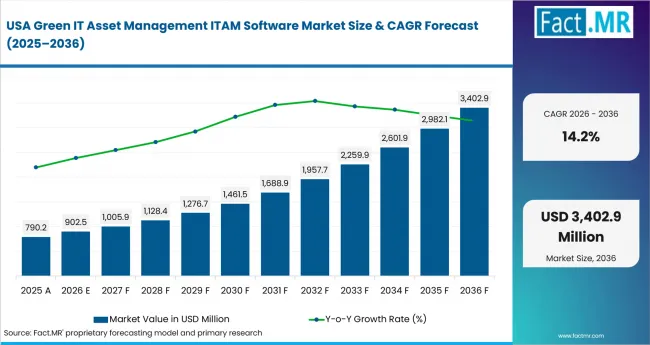
Green It Asset Management Itam Software Market Country Value Analysis | Source: Fact.MR
The USA’s growth reflects large IT estates where device ownership, SaaS accounts and infrastructure records need tighter control. License governance keeps ITAM close to procurement decisions, while cloud-heavy users require better subscription and infrastructure reconciliation. Adoption may slow where legacy CMDB gaps, decentralized buying and weak disposal records reduce audit confidence.
How is Germany developing demand?
13.7% CAGR, backed by industrial digitalization and manufacturing software demand.
Germany’s demand is shaped by manufacturers that need ITAM visibility across factory systems, office estates and regulated enterprise environments. Procurement teams are expected to value lifecycle evidence before approving replacement plans. However, operational technology inventories, data protection reviews and older systems can extend integration timelines.
What is driving the UK from 2026 to 2036?
13.2% CAGR, driven by financial services and professional services.
The UK’s growth comes from financial institutions and service firms that need stronger software-use evidence across mobile and cloud-based teams. Procurement leaders are likely to target unused subscriptions, while sustainability teams connect refresh policies with reporting needs. Legacy contract data and unclear savings may still delay platform selection.
What supports Singapore growth?
12.6% CAGR, supported by regional headquarters and financial technology operations.
Singapore benefits from regional headquarters and fintech users that require asset visibility across multiple markets. Centralized IT structures can support faster policy rollout, especially when platforms are integration-ready. Demand may be restrained where cross-border records, security reviews and smaller local estates reduce the need for complex suites.
How is Canada scaling demand?
12.0% CAGR, driven by technology sector growth and digital transformation.
Canada’s market is developing through technology firms, cloud operations and enterprises that need better control over SaaS records and device age. Lifecycle data also supports reuse planning for sustainability teams. Implementation can move more slowly when dispersed operations, early cleanup costs and cost-center mismatches raise verification work.
How does Japan perform?
11.5% CAGR, led by enterprise modernization and lifecycle discipline.
Japan’s growth is likely to remain steady as large enterprises connect ITAM with modernization programs and documented refresh planning. Manufacturing users are expected to value dependable inventory controls and e-waste analytics. Long replacement cycles, customization needs and older systems may limit the pace of wider adoption.
What supports Australia adoption?
10.9% CAGR, backed by cloud adoption and digital government programs.
Australia’s demand is supported by cloud adoption, hybrid work and government preference for auditable procurement records. ITAM platforms can help sustainability teams plan reuse and track asset movement more clearly. Smaller estates, incomplete records and supplier documentation gaps may still restrict broader deployment.
Who leads the Green IT Asset Management ITAM Software Market?
Enterprise software vendors lead when they already manage asset and service records. License and discovery data strengthen that position. Selection is expected to depend on data quality and workflow fit. Buyers value one record for IT and finance teams. Security and sustainability teams use the same record.
Flexera Software LLC – Snow Software provides technology intelligence. ServiceNow, Inc. and IBM Corporation add workflow platforms. Ivanti, Inc. strengthens asset visibility. Lansweeper NV and Matrix42 AG add discovery and software asset management depth. Zoho Corporation Pvt. Ltd. – ManageEngine adds asset tooling depth. BMC Software, Inc. and OpenText Corporation complete the provider set.
Which companies are the key providers?
Key companies profiled Flexera Software LLC – Snow Software, ServiceNow, Inc., IBM Corporation, Ivanti, Inc., BMC Software, Inc., Lansweeper NV, Matrix42 AG, Zoho Corporation Pvt. Ltd. – ManageEngine, and OpenText Corporation.
- Flexera Software LLC – Snow Software
- ServiceNow, Inc.
- IBM Corporation
- Ivanti, Inc.
- BMC Software, Inc.
- Lansweeper NV
- Matrix42 AG
- Zoho Corporation Pvt. Ltd. – ManageEngine
- OpenText Corporation
Bibliography
- Department for Environment, Food & Rural Affairs. (2026, July 16). Greening Government Commitments ICT annual report 2024 to 2025.
- Digital Transformation Agency. (2025, July 2). Reducing waste in the APS: Sustainable Device Management Guide now live.
- European Commission. (2025, April 16). Ecodesign for sustainable products and energy labelling working plan 2025–2030 (COM(2025) 187 final).
- Flexera. (2025, June 18). IT teams are losing visibility as tech cost pressures mount, according to Flexera 2025 State of ITAM Report.
This Report Answers
- The report provides strategic intelligence on the Green IT Asset Management ITAM Software Market across Software Module and Application choices that shape enterprise asset governance.
- Segment analysis covers IT Asset Lifecycle Management and Asset Lifecycle Optimization as the share leaders within the 2026 market.
- Country outlook evaluates the USA and Germany alongside the UK and Singapore. Canada, Japan and Australia complete the growth comparison across the profiled markets.
- Competitive analysis profiles Flexera Software LLC – Snow Software and ServiceNow, Inc. alongside IBM Corporation. Ivanti, BMC Software, Lansweeper, Matrix42, ManageEngine and OpenText complete the provider set.
- Sustainability-capability assessment covers Carbon Footprint Analytics and Energy Use Tracking. E-waste Reporting, Circularity Analytics and Supplier Emissions Tracking complete the sustainability view alongside lifecycle and license governance.
What does the Green IT Asset Management ITAM Software Market cover?
Green ITAM software tracks IT assets from purchase to retirement. It connects technology inventory with cost control and license compliance. Security visibility and sustainability evidence use the same record.
The market covers hardware and software records. Cloud and e-waste records are included. Lifecycle optimization and license compliance lead the application view.
What is included in the scope?
The scope includes asset discovery and lifecycle tracking. License governance, cloud inventory and disposal documentation are included. Enterprise users include large enterprises and SMEs. Government users and IT operators are included. BFSI firms and manufacturers are included.
The scope includes Software Module and Application. End User and Deployment Model complete the structure. Sustainability Capability and Region are included. It covers carbon footprint analytics and e-waste reporting when calculations use infrastructure monitoring tools.
What is excluded from the scope?
The scope excludes ESG consulting without IT asset data. Hardware resale and recycling services are excluded unless software revenue depends on ITAM workflows.
General IT service management revenue is excluded unless the module controls lifecycle and license data. Cloud or sustainability data must be present. Unrelated company revenue is excluded.
How Was the Analysis Built?
The analysis draws on 120+ sources, 35+ company portfolios, 25+ countries, and more than 20 interviews.
- Primary Research: Interviews with manufacturers, retailers, salon operators, and experts examine purchase priorities, adoption, approval requirements, and competitive positioning.
- Desk Research: Desk research covers government statistics, regulatory publications, company filings, trade data, technical studies, industry associations, standards, and public policy.
- Market Sizing and Forecasting: Estimates combine historical performance, demand indicators, pricing, segment shares, company participation, country growth, adoption patterns, and barriers to expansion.
- Data Validation and Update Cycle: Findings are validated against public data, company activity, regulatory changes, product launches, recalls, and adoption shifts.
What is the report’s scope and coverage?
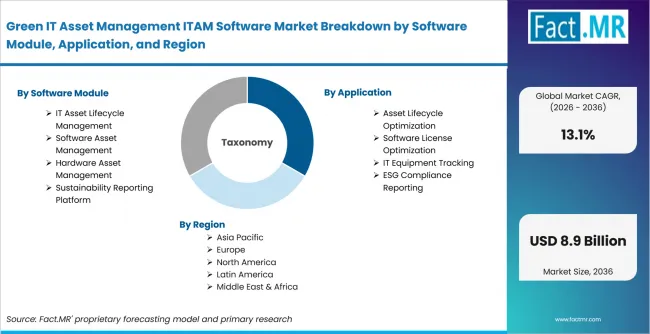
Green It Asset Management Itam Software Market Breakdown By Software Module, Application, And Region | Source: Fact.MR
| Attribute | Details |
|---|---|
| Quantitative Units | USD billion in 2026 to USD billion by 2036 at CAGR |
| Market Definition | Software used to govern enterprise IT assets with lifecycle, license, cloud, carbon and e-waste controls. The market covers platforms that connect hardware records, software-license use, cloud resources, retirement plans and carbon analytics to support asset governance, procurement review and sustainability reporting. |
| Software Module | IT Asset Lifecycle Management; Software License Management; Hardware Asset Tracking; Cloud Asset Management; E-waste Lifecycle Management |
| Application | Asset Lifecycle Optimization; License Compliance; IT Cost Optimization; Carbon-aware Procurement; E-waste Governance |
| End User | Large Enterprises; Small and Medium Enterprises; Government and Public Sector; IT and Telecom; BFSI; Manufacturing |
| Deployment Model | Cloud-based Deployment; On-premises Deployment; Hybrid Deployment |
| Sustainability Capability | Carbon Footprint Analytics; Energy Use Tracking; E-waste Reporting; Circularity Analytics; Supplier Emissions Tracking |
| Regions Covered | North America; Latin America; Europe; East Asia; South Asia and Pacific; Middle East and Africa |
| Countries Covered | USA; Germany; UK; Singapore; Canada; Japan; Australia |
| Key Companies Profiled | Flexera Software LLC – Snow Software; ServiceNow, Inc.; IBM Corporation; Ivanti, Inc.; BMC Software, Inc.; Lansweeper NV; Matrix42 AG; Zoho Corporation Pvt. Ltd. – ManageEngine; OpenText Corporation |
| Forecast Period | 2026 to 2036 |
| Approach | Hybrid top-down and bottom-up approach using enterprise software demand; IT asset lifecycle requirements; cloud inventory needs; country adoption patterns and company portfolio review |
How is the market segmented?
-
By Software Module
- IT Asset Lifecycle Management
- Procurement Management
- Asset Retirement Management
- Software Asset Management
- License Compliance
- SaaS License Management
- Hardware Asset Management
- Device Inventory
- Mobile Asset Tracking
- Sustainability Reporting Platform
- Carbon Reporting
- Green IT Dashboards
- IT Asset Lifecycle Management
-
By Application
- Asset Lifecycle Optimization
- IT Procurement Optimization
- E-waste Reduction
- Software License Optimization
- License Cost Optimization
- SaaS Utilization Analysis
- IT Equipment Tracking
- Server Lifecycle Management
- End-user Device Monitoring
- ESG Compliance Reporting
- Scope 3 IT Emissions Reporting
- Environmental Audit Reporting
- Asset Lifecycle Optimization
-
By End User
- Large Enterprises
- Global Enterprises
- Multinational Corporations
- Small & Medium Enterprises
- Managed Service Providers
- Public Sector Organizations
- Data Centers
- Cloud Service Providers
- Educational Institutions
- Financial Institutions
- Banking Organizations
- Healthcare Organizations
- Large Enterprises
-
By Deployment Model
- Cloud-based Deployment
- Public Cloud
- Private Cloud
- Hybrid Deployment
- On-premises Deployment
- Edge-enabled Infrastructure
- Software as a Service
- Managed Services
- Multi-tenant Platform
- Application Programming Interface Integration
- Low-code Integration
- Enterprise System Integration
- Cloud-based Deployment
-
By Sustainability Capability
- Carbon Footprint Analytics
- Asset Carbon Tracking
- Emissions Monitoring Dashboard
- Energy Consumption Analytics
- Power Usage Monitoring
- Device Energy Optimization
- Circular IT Analytics
- Hardware Reuse Analytics
- Electronic Waste Reporting
- Artificial Intelligence-powered Insights
- Predictive Sustainability Analytics
- Automated ESG Reporting
- Carbon Footprint Analytics
-
By Region
- North America
- Latin America
- Western Europe
- Eastern Europe
- East Asia
- South Asia and Pacific
- Middle East & Africa