- Market Value (2025): USD 22.1 Bn
- Estimated Value (2026): USD 24.8 Bn
- Forecast Value (2036): USD 79.1 Bn
- CAGR (2026-2036): 12.3%
What is the Green IT Services Market forecast to be worth by 2036?
USD 24.8 billion in 2026 to USD 79.1 billion by 2036 at 12.3% CAGR.
- The green IT services market reached USD 22.1 billion in 2025 as enterprise customers increased spending on data center efficiency and IT asset lifecycle programs.
- Demand is projected to increase from USD 24.8 billion in 2026 to USD 79.1 billion by 2036.
- The market is forecast to record 12.3% CAGR from 2026 to 2036. Energy management and device refurbishment remain relevant service considerations.
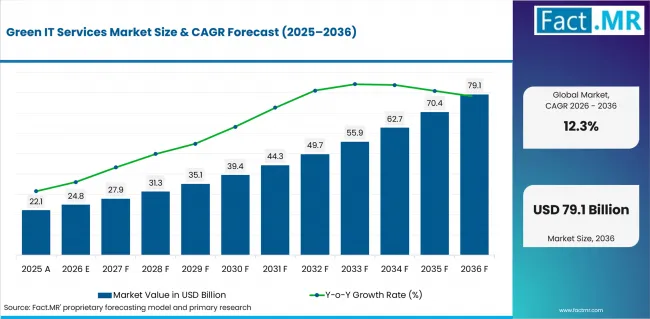
Green It Services Market Value Analysis | Source: Fact.MR
What are the defining numbers behind Green IT Services Market growth?
USD 54.3 billion absolute opportunity by 2036.
- Demand Drivers in the Market
- Data center efficiency reviews are expected to raise demand for services that reduce power use and improve cooling decisions.
- Cloud migration is expected to change the purchase path as workloads are reviewed for cost and carbon impact together.
- Large enterprises are expected to remain the clearest customer group since they manage distributed assets and board-level sustainability targets.
- Key Segments Analyzed
- By Service: Green Data Center Services is projected to hold 39.8% share in 2026 as it gives enterprises a direct route to facility-level IT efficiency.
- By Deployment: Cloud is expected to account for 52.8% share in 2026 because cloud computing turns workload placement into a sustainability review point.
- By Organization Size: Large Enterprises are anticipated to capture 43.9% share in 2026 since wider IT estates require more managed infrastructure support.
- By End Use: IT & Telecom is estimated to represent 33.6% share in 2026 as networks and data centers place energy management close to service reliability.
- By Solution: Energy Management is forecast to hold 45.1% share in 2026 because customers prioritize power monitoring before wider carbon programs.
- Analyst Opinion at Fact.MR
- Shambhu Nath Jha, Sr. Consultant at Fact.MR, opines, “Green IT services must show where the operating benefit appears inside data center work and cloud or asset lifecycle programs. Customers are expected to reward providers that prove measurable service outcomes instead of broad consulting claims.”
- Strategic Implications
- Enterprise IT leaders should rank Green Data Center Services by measured energy outcomes before they expand consulting scopes.
- Service companies are expected to strengthen proposals by pairing cloud migration with server virtualization and IT asset lifecycle work.
- Investors should separate direct green IT services demand from wider data center infrastructure spend. Electronics recycling becomes relevant when asset recovery and disposal documentation shape renewal contracts.
Canada is projected to record a 8.6% CAGR from 2026 to 2036. Its lead is supported by enterprise sustainability programs and service coverage needs. The UK is expected to record a 13.0% CAGR as cloud review shapes demand. The USA is anticipated to post a 16.0% CAGR through large-enterprise IT estate review. Japan is estimated at 10.1% through reliability-led optimization. Germany is forecast at 14.6% through compliance-driven energy management. France is projected to reach 11.6% through service procurement and cloud workload review.
How does the Green IT Services Market break down by segment?
Green Data Center Services is expected to lead Service at 39.8% share. Cloud is projected to lead Deployment at 52.8% share in 2026.
Why does Green Data Center Services lead Service?
Green Data Center Services is projected to account for 39.8% share in 2026.
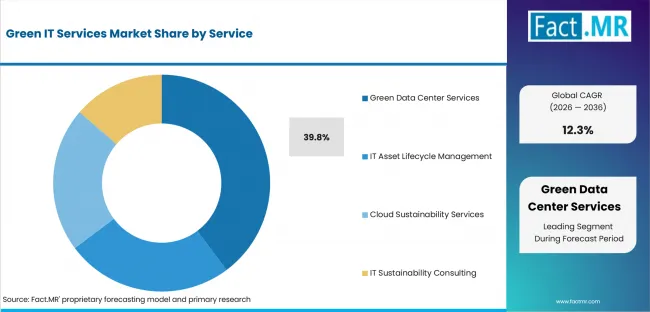
Green It Services Market Analysis By Service | Source: Fact.MR
For Service, Green Data Center Services has the clearest buying case because the outcome is visible in power and cooling control. Data Center Optimization and Server Virtualization remain useful where customers want measurable improvements without a full operating change. Energy-efficient Infrastructure and IT Sustainability Consulting support broader programs after the first service case is proven.
Why does Cloud lead Deployment?
Cloud is expected to hold 52.8% share in 2026.
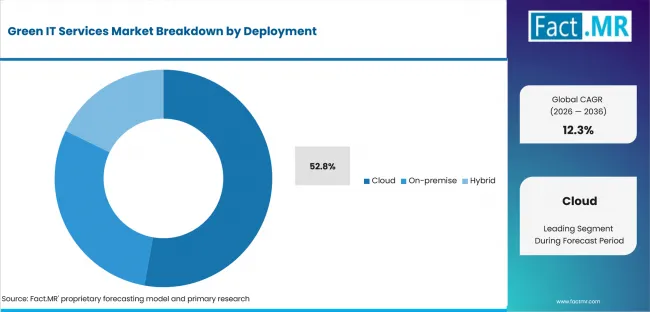
Green It Services Market Analysis By Deployment | Source: Fact.MR
Cloud leads Deployment because migration planning gives customers a chance to review cost and carbon impact at the same time. Public Cloud and Private Cloud remain important where control needs differ. Hybrid Cloud and Edge Computing serve customers that need local processing before broader cloud sustainability services are approved.
Why do Large Enterprises lead Organization Size?
Large Enterprises are anticipated to account for 43.9% share in 2026.
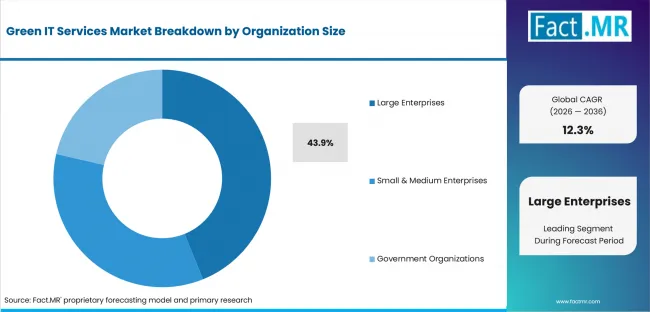
Green It Services Market Analysis By Organization Size | Source: Fact.MR
Large Enterprises lead Organization Size through wider IT estates and stronger internal review duties. Global Enterprises and Multinational Corporations need consistent service delivery across countries. Small and medium enterprises still adopt green IT services through narrower projects or cloud-focused optimization.
Why does IT & Telecom lead End Use?
IT & Telecom is estimated to account for 33.6% share in 2026.
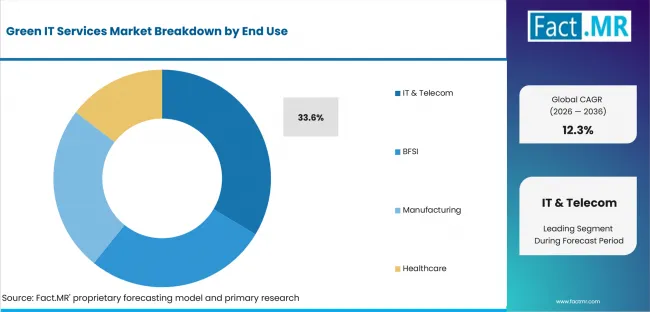
Green It Services Market Analysis By End Use | Source: Fact.MR
IT & Telecom carries the leading End Use position because networks and data centers make energy use a service-quality issue. BFSI and Manufacturing remain relevant where reporting and process continuity matter. Healthcare demand is expected to depend on reliability requirements before larger sustainability programs are approved.
Why does Energy Management lead Solution?
Energy Management is forecast to hold 45.1% share in 2026.
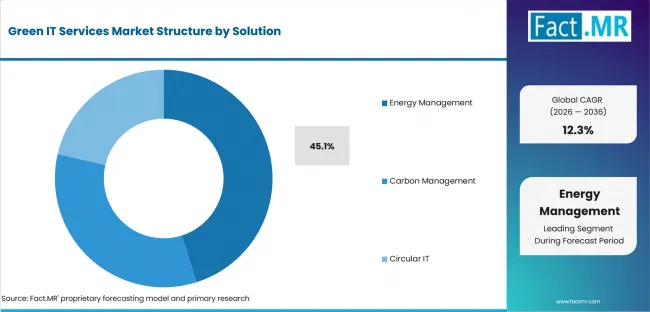
Green It Services Market Analysis By Solution | Source: Fact.MR
Energy Management leads Solution because customers often begin with power monitoring and cooling optimization. Carbon Management gains value after operating readings improve. Circular IT supports demand where device reuse and hardware recycling become part of renewal planning.
What is accelerating Green IT Services Market adoption, and what is holding it back?
Demand is expected to grow through data center efficiency and cloud optimization. Adoption may be limited by unclear cost savings and slow service approvals.
Drivers Impact Analysis
| DRIVER | QUALITATIVE RELEVANCE | GEOGRAPHIC RELEVANCE | IMPACT TIMELINE |
|---|---|---|---|
| Green data center modernization | High | Canada; USA | Short term (<= 2 years) |
| Cloud workload optimization | High | UK; USA | Short term (<= 2 years) |
| Enterprise sustainability reporting | High | Canada; Germany | Medium term (2-4 years) |
| IT asset lifecycle controls | High | USA; France | Medium term (2-4 years) |
| Energy management integration | High | Japan; Germany | Long term (>= 4 years) |
Source: Fact.MR analysis. Updated Jul 29, 2026
- Green data center modernization: Enterprises are expected to use green data center services where power and cooling decisions are already under review.
- Cloud workload optimization: Cloud use is expected to widen demand for carbon-aware migration and workload placement support.
- Enterprise sustainability reporting: Reporting duties are expected to turn IT performance data into a procurement requirement.
Opportunity Impact Analysis
| OPPORTUNITY | QUALITATIVE RELEVANCE | GEOGRAPHIC RELEVANCE | IMPACT TIMELINE |
|---|---|---|---|
| Carbon-aware cloud migration | High | Canada and UK | Medium term (2-4 years) |
| IT asset disposition partnerships | Moderate | USA and Germany | Medium term (2-4 years) |
| Data center monitoring services | Moderate | Japan and France | Long term (>= 4 years) |
| Sustainable procurement programs | Moderate | Large enterprise accounts | Long term (>= 4 years) |
Source: Fact.MR analysis. Updated Jul 29, 2026
- Carbon-aware cloud migration: Service providers are expected to convert cloud refresh cycles into larger programs when customers need cost control and sustainability reporting together.
- IT asset disposition partnerships: Partnerships with recycling and refurbishment specialists are expected to improve the service case.
- Data center monitoring services: Monitoring-led projects are expected to create follow-on work for energy analytics and cooling optimization.
Restraints Impact Analysis
| RESTRAINT | QUALITATIVE RELEVANCE | GEOGRAPHIC RELEVANCE | IMPACT TIMELINE |
|---|---|---|---|
| Unclear savings proof | High | Global | Short term (<= 2 years) |
| Integration burden across legacy IT | Moderate | Large enterprises | Short term (<= 2 years) |
| Limited carbon accounting maturity | Moderate | UK; France; Germany | Medium term (2-4 years) |
| Procurement delays for service programs | Selective | Public and regulated customers | Long term (>= 4 years) |
Source: Fact.MR analysis. Updated Jul 29, 2026
- Unclear savings proof: Adoption slows when customers cannot see how a service lowers energy use or asset waste. Providers need a clear baseline before they ask for wider program approval.
- Integration burden across legacy IT: Older systems and mixed cloud estates make service delivery harder to standardize. This raises project time and is expected to delay larger green IT programs.
- Limited carbon accounting maturity: Carbon data is often stored outside infrastructure operations. That separation makes it harder to translate energy readings into useful emissions reporting.
Which countries are scaling Green IT Services Market fastest?
The country comparison is led by the USA at 16.0% CAGR, followed by Germany at 14.6%, the UK at 13.0%, France at 11.6%, Japan at 10.1%, and Canada at 8.6%. The spread between the USA and Canada is 7.4 percentage points.
- The USA, Germany, and the UK record the three highest listed country CAGRs.
- France and Japan form the middle of the profiled country range.
- Canada records 8.6% CAGR from 2026 to 2036.
The full report covers North America; Latin America; Europe; East Asia; South Asia & Pacific; and Middle East and Africa.
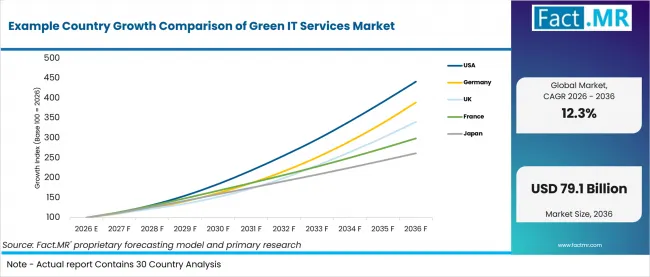
Example Country Growth Comparison Of Green It Services Market | Source: Fact.MR
| Country | CAGR (2026-2036) |
|---|---|
| Canada | 8.6% |
| UK | 13.0% |
| USA | 16.0% |
| Japan | 10.1% |
| Germany | 14.6% |
| France | 11.6% |
Source: Fact.MR analysis. Updated Jul 29, 2026
What supports Canada adoption?
8.6% CAGR, supported by large-enterprise service coverage and data center efficiency review.
Canada’s demand path starts with large organizations that operate distributed IT estates. Green Data Center Services is expected to gain acceptance when providers show how energy management and monitoring reduce operating uncertainty.
How is the UK scaling demand?
13.0% CAGR, driven by cloud workload review and enterprise reporting discipline.
In the UK, adoption is expected to follow cloud migration and service-governance reviews. Customers favor providers that explain workload placement in simple cost and sustainability terms.
What is driving USA growth from 2026 to 2036?
16.0% CAGR, backed by large-enterprise IT estate review and infrastructure modernization.
USA demand is shaped by large IT estates that need clearer operating proof before wider deployment. Cloud and data center services are expected to remain central to project approval.
How is Japan developing demand?
10.1% CAGR, driven by reliability-led optimization and careful service validation.
Japan’s demand path is expected to reflect customer preference for stable operations and tested service outcomes. Green IT services gain approval when they improve energy visibility without weakening uptime.
How does Germany perform?
14.6% CAGR, led by compliance-oriented energy management and structured technology procurement.
Germany’s growth is supported by customers that ask for evidence before changing infrastructure service partners. Energy Management and carbon reporting services are expected to appeal where audit readiness shapes procurement.
What supports France’s growth?
11.6% CAGR, backed by service procurement discipline and cloud workload review.
France is expected to build demand through staged adoption across cloud and asset lifecycle services. Providers gain more work when they show measurable outcomes and a simple reporting path.
Who leads the Green IT Services Market?
Accenture plc and IBM Corporation show the clearest direct relevance through sustainable IT services and responsible computing work. Capgemini SE strengthens the field through services that cover data centers and application-level emissions review.
Infosys Limited and Wipro Limited extend the provider group through sustainability technology services. Tata Consultancy Services and Cognizant Technology Solutions add scale through enterprise transformation and IT operations support.
Which companies are the key providers?
Key companies include Accenture plc; IBM Corporation; Capgemini SE; Infosys Limited; Wipro Limited; Tata Consultancy Services; and Cognizant Technology Solutions.
- Accenture plc
- IBM Corporation
- Capgemini SE
- Infosys Limited
- Wipro Limited
- Tata Consultancy Services
- Cognizant Technology Solutions
Bibliography
- U.S. Department of Energy. (2024, December 20).
- Capgemini. (2025, January 22).
- IBM Institute for Business Value. (2024, September 18).
This Report Answers
- The report provides strategic intelligence on the Green IT Services Market across Service and Deployment choices that shape enterprise data center and cloud sustainability programs.
- Segment analysis covers Green Data Center Services and Cloud as the share leaders within the 2026 market structure.
- Country outlook evaluates Canada and the UK alongside the USA and Japan. Germany and France complete the growth comparison across the profiled markets.
- Competitive analysis profiles Accenture plc and IBM Corporation alongside Capgemini SE and Infosys Limited. Wipro Limited and Tata Consultancy Services complete the provider view with Cognizant Technology Solutions.
- Solution assessment covers Energy Management and Carbon Management. Circular IT and Sustainable Procurement complete the solution view alongside cloud and asset lifecycle services.
What does the Green IT Services Market cover?
Green IT Services covers service work that improves environmental performance inside enterprise IT operations and supports measurable energy or asset outcomes.
The Green IT Services Market covers Green Data Center Services and data center optimization. Coverage extends to server virtualization and cloud sustainability services. It includes IT asset lifecycle management and carbon management when these services change IT operations or reporting outcomes.
What is included in the scope?
The scope includes services used across large enterprises and IT & Telecom customers. BFSI and manufacturing accounts are included when service use affects IT operations. Healthcare accounts follow the same rule when IT operations are affected.
Coverage includes Service and Deployment alongside Organization Size and End Use. It also includes the Solution segment and Region. Cloud and On-premise patterns are included. Hybrid and Edge Computing deployment patterns are covered when they support green IT service delivery.
What is excluded from the scope?
General corporate sustainability work and unrelated infrastructure spending remain outside the scope of this market.
The scope excludes services that do not address IT energy use or IT asset lifecycle work. Standalone hardware sales are excluded unless they are part of a managed service. General recycling and broad ESG consulting are excluded when they are not tied to enterprise IT operations.
How Was the Analysis Built?
The analysis draws on 120+ sources and 35+ company portfolios. It also reviews 25+ countries and more than 20 industry interviews.
- Primary Research: Primary research includes discussions with manufacturers and service providers. It also covers technology developers and distributors. Interviews with end users and procurement teams examine purchasing priorities and approval requirements. Subject-matter experts help validate the factors that influence wider market acceptance.
- Desk Research: Desk research covers government statistics and regulatory publications. Company filings and trade data are reviewed with technical studies. Industry associations and standards are used where they clarify operating conditions. Every source used in the analysis is documented in the bibliography.
- Market Sizing and Forecasting: Market estimates combine historical performance with demand indicators. Pricing and volume trends are compared with segment shares and company participation. Country-level growth and adoption patterns are then reviewed against investment activity and barriers to market expansion.
- Data Validation and Update Cycle: Findings are validated by comparing primary interviews with public data and company activity. Regulatory changes and trade patterns are reviewed during each update. Regular updates check product launches and capacity changes. Partnerships and procurement trends are reviewed for shifts in commercial adoption.
Segmentation
What is the report’s scope and coverage?
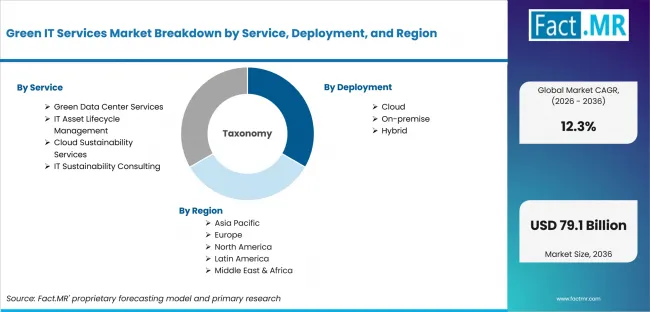
Green It Services Market Breakdown By Service, Deployment, And Region | Source: Fact.MR
| Attribute | Details |
|---|---|
| Quantitative Units | USD billion in 2026 to USD billion by 2036 at CAGR |
| Market Definition | Services used to lower IT energy use and reduce asset waste across enterprise IT operations through data center work; cloud sustainability services; lifecycle programs; energy management; and sustainability reporting support |
| Service | Green Data Center Services; Data Center Optimization; Server Virtualization; Energy-efficient Infrastructure; IT Asset Lifecycle Management; IT Asset Disposition; Device Refurbishment; E-waste Management; Cloud Sustainability Services; Carbon-aware Cloud Migration; Green Cloud Optimization; Multi-cloud Sustainability; IT Sustainability Consulting; ESG Consulting; Carbon Footprint Assessment; Sustainability Strategy Development |
| Deployment | Cloud; Public Cloud; Private Cloud; Hybrid Cloud; On-premise; Enterprise Data Centers; Private Infrastructure; Edge Computing; Hybrid; Cloud-integrated Infrastructure; Multi-cloud Deployment; Distributed IT Environment |
| Organization Size | Large Enterprises; Global Enterprises; Multinational Corporations; Public Sector Enterprises; Small & Medium Enterprises; Medium-sized Businesses; Small Businesses; Startups; Government Organizations; Federal Agencies; State Governments; Public Institutions |
| End Use | IT & Telecom; Telecommunication Providers; Software Companies; IT Service Providers; BFSI; Banking; Insurance; Financial Services; Manufacturing; Discrete Manufacturing; Process Manufacturing; Industrial Automation; Healthcare; Hospitals; Pharmaceutical Companies; Healthcare Providers |
| Solution | Energy Management; Power Monitoring; Cooling Optimization; Energy Analytics; Carbon Management; Carbon Accounting; Emission Reporting; Net-zero Planning; Circular IT; Device Refurbishment; Hardware Recycling; Sustainable Procurement |
| Regions Covered | North America; Latin America; Europe; East Asia; South Asia & Pacific; Middle East and Africa |
| Countries Covered | Canada; UK; USA; Japan; Germany; France |
| Key Companies Profiled | Accenture plc; IBM Corporation; Capgemini SE; Infosys Limited; Wipro Limited; Tata Consultancy Services; Cognizant Technology Solutions |
| Forecast Period | 2026 to 2036 |
| Approach | Hybrid top-down and bottom-up approach using green IT service demand; data center efficiency needs; cloud deployment patterns; enterprise reporting requirements; asset lifecycle activity; energy management adoption; company participation; country-level growth; and customer validation |
Source: Fact.MR analysis. Updated Jul 29, 2026
How is the market segmented?
-
By Service:
- Green Data Center Services
- Data Center Optimization
- Server Virtualization
- Energy-efficient Infrastructure
- IT Asset Lifecycle Management
- IT Asset Disposition
- Device Refurbishment
- E-waste Management
- Cloud Sustainability Services
- Carbon-aware Cloud Migration
- Green Cloud Optimization
- Multi-cloud Sustainability
- IT Sustainability Consulting
- ESG Consulting
- Carbon Footprint Assessment
- Sustainability Strategy Development
-
By Deployment:
- Cloud
- Public Cloud
- Private Cloud
- Hybrid Cloud
- On-premise
- Enterprise Data Centers
- Private Infrastructure
- Edge Computing
- Hybrid
- Cloud-integrated Infrastructure
- Multi-cloud Deployment
- Distributed IT Environment
-
By Organization Size:
- Large Enterprises
- Global Enterprises
- Multinational Corporations
- Public Sector Enterprises
- Small & Medium Enterprises
- Medium-sized Businesses
- Small Businesses
- Startups
- Government Organizations
- Federal Agencies
- State Governments
- Public Institutions
-
By End Use:
- IT & Telecom
- Telecommunication Providers
- Software Companies
- IT Service Providers
- BFSI
- Banking
- Insurance
- Financial Services
- Manufacturing
- Discrete Manufacturing
- Process Manufacturing
- Industrial Automation
- Healthcare
- Hospitals
- Pharmaceutical Companies
- Healthcare Providers
-
By Solution:
- Energy Management
- Power Monitoring
- Cooling Optimization
- Energy Analytics
- Carbon Management
- Carbon Accounting
- Emission Reporting
- Net-zero Planning
- Circular IT
- Device Refurbishment
- Hardware Recycling
- Sustainable Procurement
-
By Region:
- North America
- Canada
- USA
- Europe
- UK
- Germany
- France
- East Asia
- Japan
- Latin America
- South Asia & Pacific
- Middle East and Africa
Frequently Asked Questions
Which Service leads the market?
Which Deployment leads the market?
Which Organization Size leads the market?
Which End Use leads the market?
Which Solution leads the market?
Which country records the highest listed CAGR?
What is the primary driver in this market?
What is the main restraint?
Why do large enterprises lead demand?
Who worked on this report


Preview the report firsthand - request a free sample
Free SampleGet the brochure for pricing and purchase details
Download PDF