- Market Value (2025): USD 2.9 Bn
- Estimated Value (2026): USD 3.1 Bn
- Forecast Value (2036): USD 6.3 Bn
- CAGR (2026-2036): 7.3%
What is the Ingredient Dosing Systems Market forecast to be worth by 2036?
USD 3.1 Billion in 2026 to USD 6.3 Billion by 2036 at a 7.3% CAGR.
- The Ingredient Dosing Systems Market crossed a valuation of USD 2.9 Billion in 2025.
- Demand is projected to increase from USD 3.1 Billion in 2026 to USD 6.3 Billion by 2036.
- The market is forecast to record 7.3% CAGR from 2026 to 2036, supported by bakery and prepared food lines that need repeatable recipe dosing.
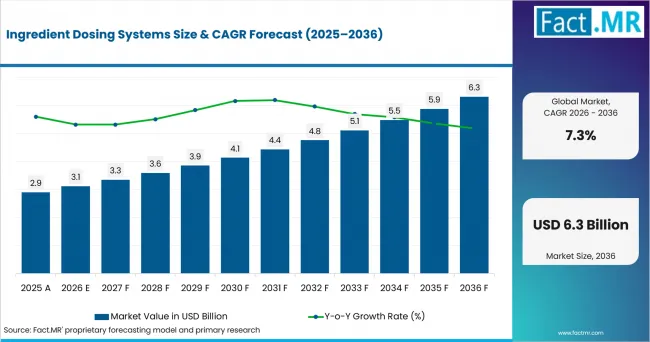
Ingredient Dosing Systems Value Analysis | Source: Fact.MR
What are the defining numbers behind Ingredient Dosing Systems Market growth?
USD 3.2 Billion absolute opportunity is expected between 2026 and 2036.
- Demand Drivers in the Market
- Bakery plant operators need recipe-controlled powder dosing where flour, improver and minor-ingredient errors change dough behavior across repeated batches.
- ONS reported on July 24, 2026 that the manufacture of food represented 22.9% of total UK manufacturers’ product sales in 2025 and remained the largest manufacturing division by product sales.
- USDA ERS reported on June 11, 2026 that inflation-adjusted U.S. food-away-from-home spending reached USD 1.41 trillion in 2025, expressed in 2025 dollars.
- Quality teams need electronic lot links so ingredient changes are matched with finished-batch records and allergen checks.
- Pet food producers need closed-loop weighing so premix, palatant and micronutrient dosing is checked against recipe targets.
- Key Segments Analyzed
- By Dosing Mode: Gravimetric is expected to hold 37.0% share in 2026, driven by weight feedback that fits powders and inclusions.
- By Ingredient: Powders / flours are projected to account for 31.0% share in 2026, supported by bakery and dry-mix operations.
- By Industry: Bakery is anticipated to capture 26.0% share in 2026, owing to flour-intensive processing and minor-ingredient control.
- By Automation: PLC recipe controlled systems are estimated to represent 38.0% share in 2026, shaped by stored set points and batch records.
- Analyst Opinion at Fact.MR
- Shambhu Nath Jha, Principal Consultant at Fact.MR, states, “Ingredient is becoming a recipe-control decision before it is an equipment purchase. The market is expected to reward systems that combine weighing accuracy, cleanability and batch records while avoiding full-line rebuilds. Suppliers with hygienic hardware, PLC recipes and field service support are better placed with bakeries, dairies and pet food plants.”
- Strategic Implications
- Equipment vendors should show dosing accuracy by ingredient type, especially for powders that bridge or lose flow during long production runs.
- Food processors should compare recipe-change time and start-up waste before choosing between gravimetric and volumetric systems.
- Automation integrators should align batch records with plant PLC and MES environments already used on mixing lines.
- Quality teams should align lot records, allergen checks and recipe documentation before connecting dosing data to plant systems.
The UK is forecast to record 8.4% CAGR through 2036, led by bakery automation and prepared meal production. France is anticipated to post 8.1%, supported by formulation work and nutrition-label reform. The USA is estimated to advance at 7.2%, shaped by foodservice scale and traceability preparation. Germany is projected to hold 6.5%, reinforced by ready-meal output. Italy is expected to reach 6.1% owing to reliable metering needs in pasta, bakery and dairy plants.
How does the Ingredient Dosing Systems Market break down by segment?
Gravimetric leads at 37.0%; PLC recipe controlled systems lead at 38.0%.
Which Dosing Mode dominates?
Gravimetric holds 37.0% share in 2026.
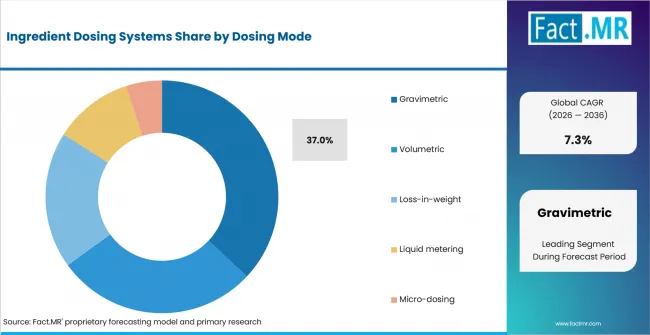
Ingredient Dosing Systems Analysis By Dosing Mode | Source: Fact.MR
Gravimetric systems are expected to hold 37.0% share in 2026, driven by weight feedback that checks each dose. The mode fits powders and inclusions where small deviations affect finished quality. Coperion said in April 2025 that its K3 vibratory feeders achieve 35% higher accuracy on average than conventional models.
What leads the Ingredient segment?
Powders / flours account for 31.0% share in 2026.
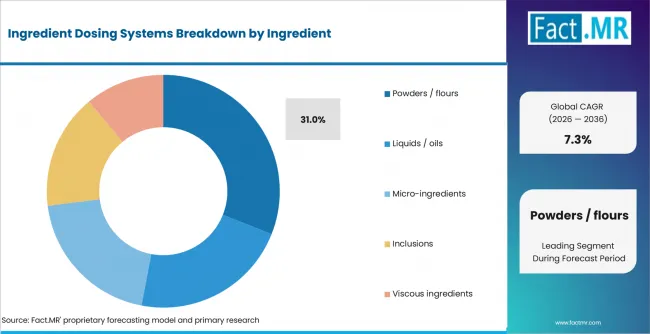
Ingredient Dosing Systems Analysis By Ingredient | Source: Fact.MR
Powders / flours are projected to account for 31.0% share in 2026, supported by bakery and dry-mix operations. These ingredients need flow control when humidity changes powder behavior. Bühler’s micro-dosing system covers vitamins, additives and trace elements for feed and pet food formulas.
How does Industry shape demand?
Bakery captures 26.0% share in 2026.
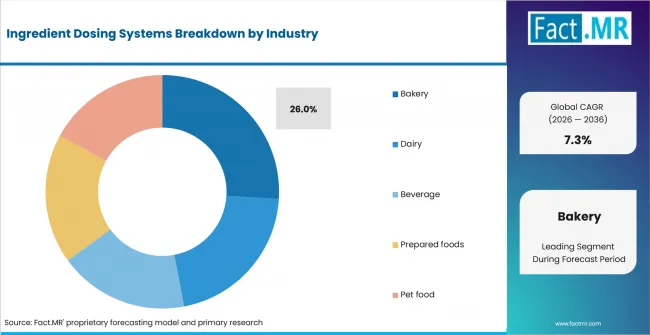
Ingredient Dosing Systems Analysis By Industry | Source: Fact.MR
Bakery is anticipated to capture 26.0% share in 2026, owing to flour and minor-ingredient weighing across repeated runs. Automated dosing helps plants keep recipe changes consistent. Santé publique France reported on 19 March 2026 that 30% to 40% of products are expected to change Nutri-Score under the 2025 algorithm.
What supports PLC recipe controlled Automation?
PLC recipe controlled systems represent 38.0% share in 2026.
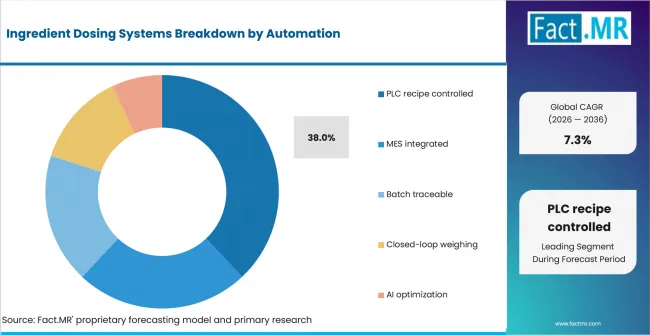
Ingredient Dosing Systems Analysis By Automation | Source: Fact.MR
PLC recipe controlled systems are estimated to represent 38.0% share in 2026, shaped by stored set points and batch sequence control. Plants use these systems for recipe changeovers and batch records. GEA states that its Codex Recipe Manager automatically produces production records with recipe setpoints and measured values and supports flexible interaction at PLC level.
What is accelerating Ingredient Dosing Systems Market adoption, and what is holding it back?
Recipe-control demand drives it; integration cost restrains it.
Drivers Impact Analysis
| Driver | (~) % Impact on CAGR | Geographic Relevance | Impact Timeline |
|---|---|---|---|
| Recipe-controlled bakery and prepared food lines | +1.4% | Europe, North America | Short term (<= 2 years) |
| Traceability and allergen documentation | +1.1% | USA, UK, EU | Medium term (2-4 years) |
| Waste reduction in inclusion dosing | +0.9% | Global | Short term (<= 2 years) |
| Pet food and premix automation | +0.7% | North America, Europe | Long term (>= 4 years) |
Source: Fact.MR analysis. Updated Sep 11, 2026
Opportunity Impact Analysis
| Opportunity | (~) % Impact on CAGR | Geographic Relevance | Impact Timeline |
|---|---|---|---|
| Closed-loop weighing retrofits | +0.8% | Europe, North America | Medium term (2-4 years) |
| MES-connected batch records | +0.7% | USA, UK, France | Medium term (2-4 years) |
| Micro-ingredient dosing for nutrition claims | +0.6% | Global | Short term (<= 2 years) |
| Liquid and viscous ingredient metering | +0.5% | Global | Long term (>= 4 years) |
Source: Fact.MR analysis. Updated Sep 11, 2026
Restraints Impact Analysis
| Restraint | (~) % Impact on CAGR | Geographic Relevance | Impact Timeline |
|---|---|---|---|
| High validation cost for smaller plants | -0.6% | Global | Short term (<= 2 years) |
| Difficult-flow ingredients and cleaning burden | -0.4% | Global | Medium term (2-4 years) |
| Legacy PLC and data integration gaps | -0.3% | Europe, North America | Medium term (2-4 years) |
| Food price pressure on capital budgets | -0.2% | USA, Europe | Short term (<= 2 years) |
Source: Fact.MR analysis. Updated Sep 11, 2026
Which countries are scaling the Ingredient Dosing Systems Market through 2036?
- The country comparison spans 2.3 percentage points and forms three practical growth bands across the forecast period.
- The UK remains 0.3 percentage point above France through prepared-food scale and recipe-controlled bakery production.
- France remains 0.9 percentage point above the USA as nutrition-label reform increases formulation discipline.
- The USA remains 0.7 percentage point above Germany as foodservice scale supports repeatable prepared components.
- Germany remains 0.4 percentage point above Italy through ready-meal output and plant-based recipe work.
- Italy closes the displayed range through agri-food processing depth and powder-intensive recipes.
Comparable CAGRs create different entry conditions due to manufacturing scale, ingredient formats, traceability rules and capital approval cycles. Full report coverage includes North America, Latin America, Western Europe, Eastern Europe, East Asia, South Asia & Pacific, Middle East & Africa.
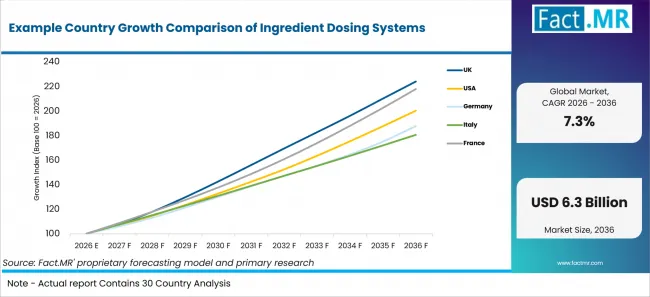
Example Country Growth Comparison Of Ingredient Dosing Systems | Source: Fact.MR
| Country | CAGR |
|---|---|
| United Kingdom | 8.4% |
| France | 8.1% |
| United States | 7.2% |
| Germany | 6.5% |
| Italy | 6.1% |
Source: Fact.MR analysis. Updated Sep 11, 2026
What supports UK adoption?
8.4% CAGR, supported by food manufacturing scale and recipe-controlled prepared meal production.
ONS reported on 24 July 2026 that prepared meals and dishes based on meat reached GBP 3.0 billion in 2025. The UK is forecast to record 8.4% CAGR through 2036 where bakeries and chilled-food plants adopt stored recipes. Equipment decisions are expected to center on dosing repeatability and batch record transfer.
What supports France growth?
8.1% CAGR, driven by food manufacturing value and nutrition-label reform.
INSEE reported on July 21, 2026 that production in value for the manufacture of food products, beverages and tobacco products was EUR 207 billion in 2025; INSEE marks the 2025 data as provisional. France is anticipated to post 8.1% CAGR through 2036 because reformulation work raises the value of accurate micro-ingredient dosing. Food processors are expected to prioritize systems that connect recipes with weighing records.
What supports USA demand?
7.2% CAGR, shaped by foodservice scale and lot-level traceability preparation.
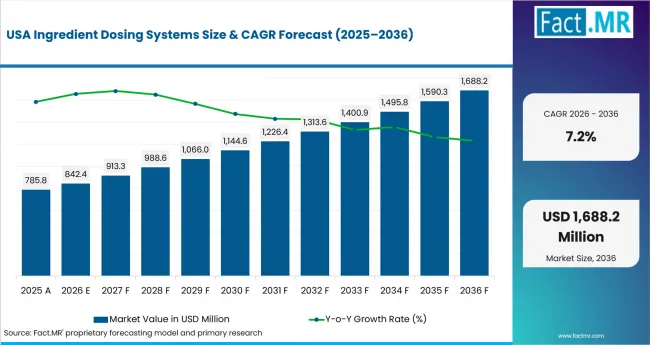
Ingredient Dosing Systems Country Value Analysis | Source: Fact.MR
USDA ERS reported on June 11, 2026 that inflation-adjusted total U.S. food spending reached USD 2.51 trillion in 2025, expressed in 2025 dollars. The USA is estimated to advance at 7.2% CAGR through 2036 supported by foodservice scale and repeatable prepared components. Lot-level record needs are expected to keep dosing data inside equipment evaluations.
What supports Germany adoption?
6.5% CAGR, supported by ready-meal output and process-equipment depth.
Destatis reported on 14 January 2026 that German industry produced 1.7 million tonnes of ready meals in 2024. Germany is projected to hold 6.5% CAGR through 2036 owing to controlled powder handling needs in prepared food and plant-based recipes. Dosing suppliers are expected to compete on hygienic design and ingredient testing depth.
How does Italy perform?
6.1% CAGR, led by agri-food processing depth and powder-intensive recipes.
Istat reported on 12 June 2026 that Italy’s agri-food sector generated EUR 89 billion in value added in 2025. Italy is expected to reach 6.1% CAGR through 2036 because pasta, bakery and dairy plants add tighter ingredient control. Adoption is expected to move through targeted upgrades around powders and liquid metering.
Who leads the Ingredient Dosing Systems Market?
Among the profiled suppliers, Bühler and Coperion offer ingredient dosing and feeding systems, while GEA and Tetra Pak offer food-processing dosing or ingredient-handling solutions.
Bühler is active in micro-dosing systems for vitamins, additives and trace elements used in feed and pet food formulations. Coperion offers volumetric and gravimetric feeding technologies through its K-Tron portfolio, including loss-in-weight and liquid feeding systems. The former Schenck Process Food and Performance Materials operations officially transitioned to Coperion in August 2024, expanding Coperion’s portfolio of food-processing and material-handling technologies.
GEA serves food processors through dosing and feeding systems supporting ingredient preparation, pre-mixing, recipe handling and blending. AZO provides dosing and weighing solutions for bulk, medium, minor and micro components across bakery and dairy processing. Qlar returned to the global food and pet food markets in September 2025 with weighing and feeding solutions. Tetra Pak provides inclusion dosing through its Ingredient Doser 4000 A3 for ice cream and other food applications.
Which companies are the key providers?
Key companies includes Bühler, Coperion, GEA, AZO, Qlar Group and Tetra Pak.
- Bühler
- Coperion
- GEA
- AZO
- Qlar Group (formerly Schenck Process Group)
- Tetra Pak
Bibliography
- Coperion. (2024, August 1). The company formerly known as Schenck Process FPM has officially transitioned its name to Coperion.
- Coperion. (2025, April 15). Trailblazing technologies for manufacturing tasty, nutritious meat alternatives.
- Ducrot, P., & Serry, A.-J. (2026, March 19). Evaluation of the Nutri-Score 2025 Campaign. Santé publique France.
- Institut national de la statistique et des études économiques. (2026, July 21). Indicateurs macroéconomiques de l’industrie manufacturière: Données annuelles de 2010 à 2025.
- Istat. (2026, June 12). Economic accounts for agriculture – Year 2025.
- Office for National Statistics. (2026, July 24). UK manufacturers’ sales by product: 2025.
- Qlar Group. (2025, September 2). Qlar (formerly Schenck Process) returns to the food and pet food industry with bold rebrand.
- Statistisches Bundesamt (Destatis). (2026, January 14). Produktion von Fertiggerichten binnen fünf Jahren mengenmäßig um 25,6 % gestiegen.
- Tetra Pak. (2025, March 11). Ice cream manufacturers can cut start-up waste by 67% with new Tetra Pak® Ingredient Doser 4000 A3.
- U.S. Department of Agriculture, Economic Research Service. (2026, August 25). Food Price Outlook – Summary findings.
- U.S. Food and Drug Administration. (2026, June 15). FDA public meeting – Challenges and solutions in lot-level food traceability.
- Zeballos, E., & Sinclair, W. (2026, June 11). Total U.S. food spending reached $2.51 trillion in 2025. U.S. Department of Agriculture, Economic Research Service.
This Report Answers
- The report explains where ingredient dosing systems are used across dosing mode and ingredient format.
- Segment analysis identifies gravimetric dosing and PLC recipe controlled systems as main supplier-selection points.
- Country analysis examines the UK, France, the USA, Germany and Italy.
- Competitive analysis reviews Bühler, Coperion, GEA, AZO, Qlar Group and Tetra Pak.
- Application analysis assesses recipe accuracy, batch records, cleanability and integration needs across food plants.
What does the Ingredient Dosing Systems Market cover?
Gravimetric, volumetric, loss-in-weight and liquid metering systems used for food ingredient control.
The Ingredient Dosing Systems Market covers equipment and controls used to measure and release food ingredients into recipes. It connects with adjacent dosing systems where precision release is central to production control. Dosing pump systems remain adjacent when flow control is broader than food ingredient recipes.
The assessment differs from broad food and beverage industry pumps coverage by focusing on the dosing point. Related dosing units are included when they meter ingredients inside a recipe.
What is included in the scope?
Ingredient dosing systems used in food, beverage, dairy, bakery, prepared food and pet food production.
The scope includes gravimetric, volumetric, loss-in-weight, liquid metering and micro-dosing equipment. It covers systems that dose powders, oils and inclusions into food recipes. Adjacent fruit-based food inclusions and sensory additives coverage is relevant where finished quality depends on controlled ingredient addition.
Application coverage spans bakery, dairy, beverage, prepared foods and pet food production. The scope connects to automated pet production lines when dosing records support recipe consistency. It aligns with food thickening agents where viscosity claims need repeatable metering.
What is excluded from the scope?
General conveying equipment and non-food chemical dosing systems are outside the scope.
Standalone silos, mixers, ovens, extruders, filling machines and packaging equipment are outside the scope when their role is movement or processing. Finished ingredient categories such as food ingredient encapsulation systems and functional food texture systems are adjacent when sold as ingredient technologies.
Water-treatment chemical dosing, pharmaceutical drug dosing and laboratory dispensing systems are outside food production coverage. Manual scooping, hand-weighing scales and recipe software sold separately from dosing hardware are excluded from market revenue.
How Was the Analysis Built?
120+ sources, 35+ company portfolios, 25+ countries and more than 20 industry interviews.
- Primary Research: Primary research includes discussions with food processors, bakery operators, dairy users, pet food producers, automation integrators and process engineers. Interviews examine dosing accuracy, cleanability and batch documentation.
- Desk Research: Desk research covers government statistics, food manufacturing data, product pages, official company announcements, food safety rules and supplier technical materials. The bibliography documents source material used in the analysis.
- Market Sizing and Forecasting: Market estimates combine historical equipment demand, food production indicators, replacement cycles, automation mix, ingredient format shares and country-level adoption patterns.
- Data Validation and Update Cycle: Findings are validated through provider checks, official source review, portfolio mapping and interviews with food processing specialists. Updates review product launches, traceability changes and plant automation spending.
Segmentation
What is the report’s scope and coverage?
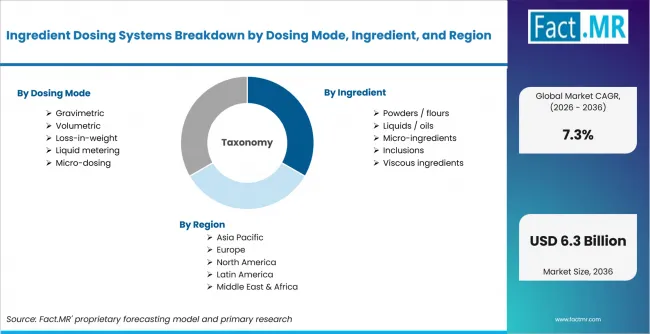
Ingredient Dosing Systems Breakdown By Dosing Mode, Ingredient, And Region | Source: Fact.MR
| Attribute | Details |
|---|---|
| Quantitative Units | USD Billion |
| Market Definition | Equipment and controls used to measure, weigh, meter and release food ingredients into recipes across batch or continuous production. |
| Dosing Mode | Gravimetric; Volumetric; Loss-in-weight; Liquid metering; Micro-dosing |
| Ingredient | Powders / flours; Liquids / oils; Micro-ingredients; Inclusions; Viscous ingredients |
| Industry | Bakery; Dairy; Beverage; Prepared foods; Pet food |
| Automation | PLC recipe controlled; MES integrated; Batch traceable; Closed-loop weighing; AI optimization |
| Regions Covered | North America; Latin America; Western Europe; Eastern Europe; East Asia; South Asia & Pacific; Middle East & Africa |
| Countries Covered | United Kingdom; France; United States; Germany; Italy |
| Key Companies Profiled | Bühler; Coperion; GEA; AZO; Qlar Group; Tetra Pak |
| Forecast Period | 2026 to 2036 |
| Approach | Hybrid top-down and bottom-up approach using food production indicators, ingredient formats, dosing mode mix, automation adoption and provider portfolio review. |
Source: Fact.MR analysis. Updated Sep 11, 2026
How is the market segmented?
-
By Dosing Mode
- Gravimetric
- Volumetric
- Loss-in-weight
- Liquid metering
- Micro-dosing
-
By Ingredient
- Powders / flours
- Liquids / oils
- Micro-ingredients
- Inclusions
- Viscous ingredients
-
By Industry
- Bakery
- Dairy
- Beverage
- Prepared foods
- Pet food
-
By Automation
- PLC recipe controlled
- MES integrated
- Batch traceable
- Closed-loop weighing
- AI optimization
-
By Region
- North America
- Latin America
- Western Europe
- Eastern Europe
- East Asia
- South Asia & Pacific
- Middle East & Africa
Frequently Asked Questions
How big is the Ingredient Dosing Systems Market in 2026?
What is the CAGR of the Ingredient Dosing Systems Market from 2026 to 2036?
Which dosing mode leads the Ingredient Dosing Systems Market?
Which automation type leads the Ingredient Dosing Systems Market?
Which companies are profiled in the Ingredient Dosing Systems Market?
Who worked on this report


Preview the report firsthand - request a free sample
Free SampleGet the brochure for pricing and purchase details
Download PDF