- Market Value (2025): USD 11.5 Bn
- Estimated Value (2026): USD 12.8 Bn
- Forecast Value (2036): USD 38.4 Bn
- CAGR (2026-2036): 11.6%
What is the IoT Node Gateway Market forecast to be worth by 2036?
USD 12.8 billion in 2026 to USD 38.4 billion by 2036 at 11.6% CAGR.
- The IoT node gateway market reached USD 11.5 billion in 2025 as buyers kept funding gateways for connected equipment and operating data capture.
- Demand is projected to increase from USD 12.8 billion in 2026 to USD 38.4 billion by 2036.
- The market is forecast to record 11.6% CAGR from 2026 to 2036 because buyers place more value on protocol translation and secure device control.
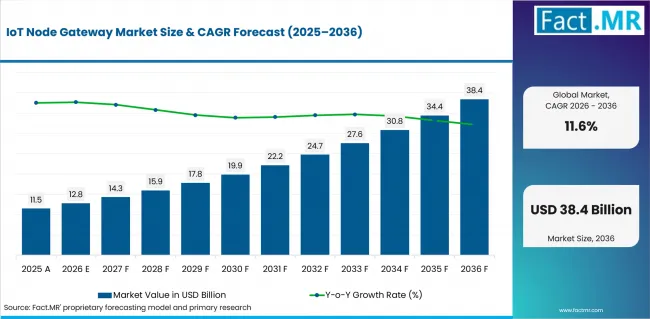
Iot Node Gateway Market Value Analysis | Source: Fact.MR
What are the defining numbers behind IoT Node Gateway Market growth?
USD 25.6 billion absolute opportunity by 2036, led by Industrial IoT Gateways and Industrial Automation alongside Manufacturing Enterprises and Direct Sales.
- Demand Drivers in the Market
- Industrial IoT Gateways are expected to remain the first specification point where plants need a reliable bridge between machines and software. Buyers ask for proof that the device can translate protocols and support secure updates before wider rollout.
- Industrial automation programs are anticipated to raise gateway demand when factories need local data handling near production lines. This matters for the market because the gateway reduces delay before data reaches control or maintenance teams.
- Manufacturing enterprises are likely to prioritize gateway fleets that can be maintained across their life. Clear rules for updates and device identity help buyers reduce approval friction after installation.
- Direct Sales is expected to support adoption when projects need supplier-led design help. Buyers prefer direct contact when gateway choice affects uptime and cybersecurity review.
- Key Segments Analyzed
- By Product Type: Industrial IoT Gateways are projected to hold 36.8% share in 2026 because they handle protocol translation near equipment.
- By Application: Industrial Automation is expected to hold 30.9% share in 2026 where factories need gateways to connect equipment signals with control systems.
- By End User: Manufacturing Enterprises are anticipated to capture 32.0% share in 2026 since connected production lines need gateway fleets that match daily operating routines.
- By Distribution Channel: Direct Sales are estimated to hold 31.4% share in 2026 when larger projects require technical sizing and account-level support.
- By Connectivity Technology: Wi-Fi is forecast to lead with 42.6% share in 2026 where buyers want familiar coverage for plant and facility nodes.
- Analyst Opinion at Fact.MR
- Shambhu Nath Jha, Senior Analyst at Fact.MR, states, "The IoT node gateway purchase test is practical. Buyers want proof that a gateway can translate field data. They expect device identity protection and simple maintenance after deployment."
- Strategic Implications
- Enterprises can use Industrial IoT Gateways where equipment data must reach operating teams with less delay. The purchase case improves when the device solves a named control or visibility problem.
- Suppliers can strengthen proposals by showing how product choices fit application demand. The stronger offer explains installation steps and service access before the buyer asks for clarification.
- Investors should separate gateway revenue from broad connected-device spending. Demand from edge computing becomes more useful when the gateway improves uptime or security review in a measurable way.
The USA is expected to record a 15.1% CAGR from 2026 to 2036 through documentation-led enterprise buying. Japan is projected to record 13.9% CAGR where compact automation sites value reliability. Germany is anticipated to post 12.8% CAGR with validation-led industrial demand. The UK is estimated at 11.6% CAGR as suppliers compete on support depth. Canada is forecast at 10.5% CAGR through service coverage across large operating areas. Australia is projected to reach 9.3% CAGR where remote facilities need dependable gateway support. Brazil is expected to record 8.1% CAGR on the back of distributor-led access.
How does the IoT Node Gateway Market break down by segment?
Industrial IoT Gateways are expected to lead Product Type at 36.8% share in 2026. Industrial Automation is projected to lead Application at 30.9% share in 2026.
Why does Industrial IoT Gateways lead Product Type?
Industrial IoT Gateways are projected to account for 36.8% share in 2026.
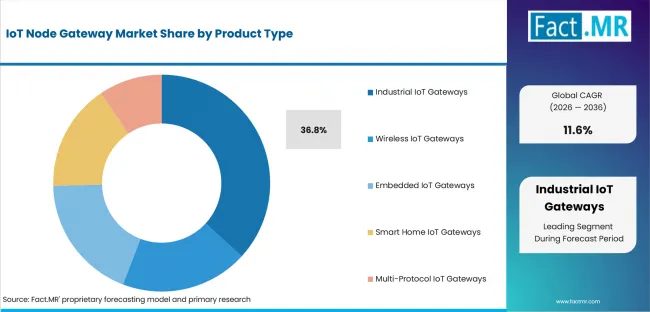
Iot Node Gateway Market Analysis By Product Type | Source: Fact.MR
Industrial IoT Gateways hold the largest share because they connect equipment that uses different communication protocols. Edge Computing Gateways support applications that need faster local processing. Rugged IoT Gateways suit harsh industrial sites, while Wireless IoT Gateways help facilities where cable installation is difficult.
Why does Industrial Automation lead Application?
Industrial Automation is expected to hold 30.9% share in 2026.
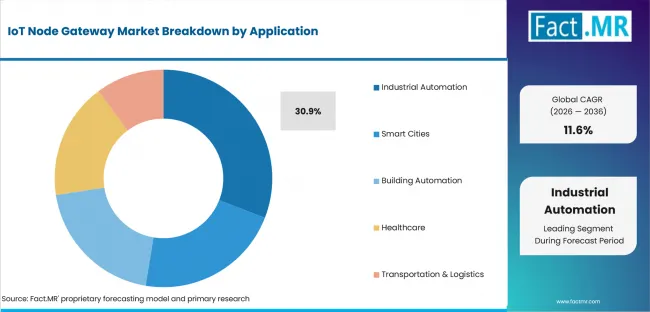
Iot Node Gateway Market Analysis By Application | Source: Fact.MR
Gateways help automation teams transfer machine data into control and maintenance systems. This makes Industrial Automation the leading application. Smart Manufacturing expands demand by giving operators a broader view of plant performance. Process Automation and Smart Cities also use gateways where many connected assets must share data reliably.
How do Manufacturing Enterprises shape End User demand?
Manufacturing Enterprises are anticipated to lead with 32.0% share in 2026.
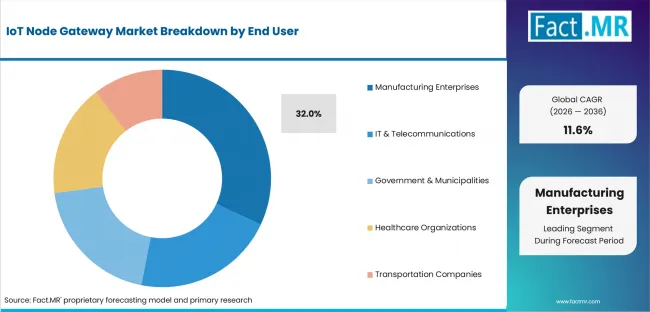
Iot Node Gateway Market Analysis By End User | Source: Fact.MR
Production uptime gives Manufacturing Enterprises a strong reason to invest in gateways. Discrete Manufacturing users mainly seek equipment-level monitoring and faster fault detection. Process Manufacturing users focus more on stable data flow because continuous operations depend on consistent system performance.
What supports Direct Sales within Distribution Channel?
Direct Sales are estimated to represent 31.4% share in 2026.
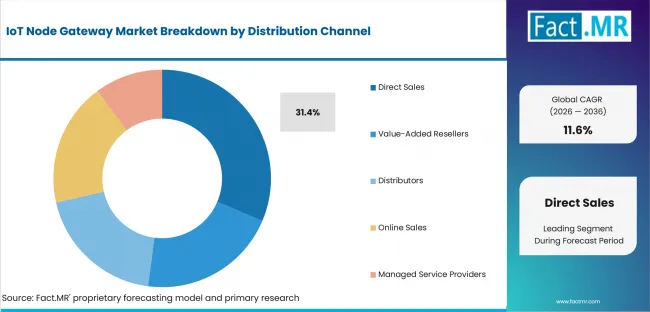
Iot Node Gateway Market Analysis By Distribution Channel | Source: Fact.MR
Many gateway projects require technical planning before installation, which supports Direct Sales. OEM Sales remain useful when gateways are built into larger equipment systems. Enterprise Contracts suit large deployments, whereas Value-Added Resellers help buyers that need bundled hardware, software and support.
Why does Wi-Fi lead Connectivity?
Wi-Fi is expected to hold the leading share in 2026.
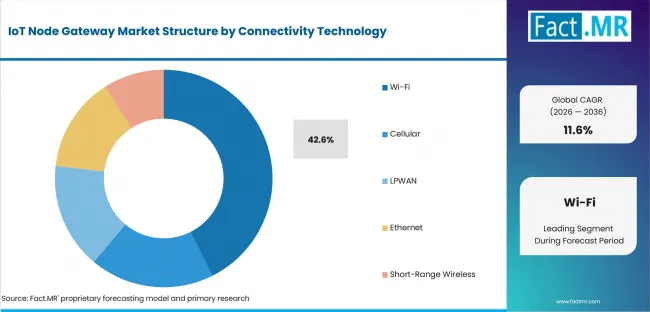
Iot Node Gateway Market Analysis By Connectivity Technology | Source: Fact.MR
Facility operators already understand Wi-Fi coverage and can test performance before expanding gateway use. Wi-Fi 5 and Wi-Fi 6/6E support upgrades across industrial sites. Cellular connectivity becomes more useful when equipment operates outside reliable facility networks.
What is accelerating IoT Node Gateway Market adoption, and what is holding it back?
Demand will rise as companies need suitable gateways and secure automation links. High switching costs and different communication protocols may limit adoption.
Drivers Impact Analysis
| DRIVER | QUALITATIVE RELEVANCE | GEOGRAPHIC RELEVANCE | IMPACT TIMELINE |
|---|---|---|---|
| Industrial gateway specification pull | High | USA and Japan | Short term (<= 2 years) |
| Automation protocol integration | High | Japan and Germany | Short term (<= 2 years) |
| Secure device identity requirements | High | USA and UK | Medium term (2-4 years) |
| Edge data processing needs | High | Canada and Australia | Medium term (2-4 years) |
| Channel and lifecycle support | Moderate | Brazil and distributor-led markets | Long term (>= 4 years) |
Source: Fact.MR analysis. Updated Jul 29, 2026
- Industrial gateway specification pull: Buyers are expected to approve gateways faster when suppliers show protocol fit and secure update support. The driver matters because the gateway becomes part of daily equipment control.
- Automation protocol integration: Plant teams need gateways that fit existing controls before automation programs expand. Demand improves when suppliers can map supported protocols to real machines and maintenance workflows.
- IoT security controls: Procurement teams are likely to test whether each gateway can be identified and updated through its life. Security review therefore becomes part of the gateway selection process.
- Edge data processing needs: Facilities that cannot move every sensor signal to the cloud need local filtering. Gateways become more useful when they reduce data noise before information reaches enterprise systems.
- Channel and lifecycle support: Regional projects depend on training and service response after installation. Suppliers with clear lifecycle duties are expected to convert more pilot projects into repeat orders.
Opportunity Impact Analysis
| OPPORTUNITY | QUALITATIVE RELEVANCE | GEOGRAPHIC RELEVANCE | IMPACT TIMELINE |
|---|---|---|---|
| Managed gateway services | High | USA and UK | Medium term (2-4 years) |
| Wi-Fi 6/6E and cellular gateway refresh | Moderate | Japan and Canada | Medium term (2-4 years) |
| Smart facility retrofits | Moderate | Germany and Australia | Long term (>= 4 years) |
| Secure edge orchestration | Selective | Global enterprise accounts | Long term (>= 4 years) |
Source: Fact.MR analysis. Updated Jul 29, 2026
- Managed gateway services: Suppliers can convert more demand by pairing gateway hardware with monitoring and update support. This model helps buyers that lack internal teams for fleet maintenance.
- Wi-Fi gateway refresh: Connectivity upgrades create replacement openings when existing nodes cannot handle newer coverage needs. Buyers still need proof that refreshed gateways remain compatible with installed devices.
- Smart facility retrofits: Older buildings and smart city projects create opportunity where gateways connect equipment without a full control rebuild. Retrofit demand depends on simple installation and limited downtime.
- Secure edge orchestration: Enterprise accounts need a cleaner way to manage gateways across plants and remote assets. Platforms that simplify policy control and update visibility are expected to gain attention.
Restraints Impact Analysis
| RESTRAINT | QUALITATIVE RELEVANCE | GEOGRAPHIC RELEVANCE | IMPACT TIMELINE |
|---|---|---|---|
| Integration complexity and switching cost | High | Global | Short term (<= 2 years) |
| Cybersecurity approval delays | Moderate | USA and UK | Short term (<= 2 years) |
| Price pressure in distributor-led projects | Moderate | Brazil and Australia | Medium term (2-4 years) |
| Protocol fragmentation and maintenance load | Selective | Industrial sites | Long term (>= 4 years) |
Source: Fact.MR analysis. Updated Jul 29, 2026
- Integration complexity and switching cost: Conversion slows when buyers cannot compare gateway options against existing control equipment. Migration risk rises when replacement affects device access or operator training.
- Cybersecurity approval delays: Gateway purchases can stall when security teams cannot confirm update control and access rules. Suppliers need clearer documentation to move projects through review.
- Price pressure in distributor-led projects: Smaller buyers may delay upgrades when gateway price is judged apart from service support. The risk grows when distributors cannot prove installation help.
- Protocol fragmentation and maintenance load: Mixed devices increase support work after rollout. Buyers are expected to avoid gateway fleets that require too many separate tools for updates and diagnostics.
Which countries are scaling IoT Node Gateway Market fastest?
The country comparison is shaped by a narrow spread around the global 11.6% CAGR. The USA and Japan form the upper pair. Germany stays aligned with the global rate. The UK and Canada follow through service-led conditions. Australia and Brazil depend more on distributor readiness after installation.
- The USA records the highest listed CAGR where gateway buyers place more weight on documentation and supplier accountability. This route favors vendors that explain secure device control before wider rollout.
- Japan stays close to the USA through compact automation sites that value reliable operation and local service access. Germany follows a validation-led route across industrial buyers that test fit before changeover.
- The UK and Canada advance through support depth and coverage across spread-out operating sites. Australia and Brazil depend more on distributor readiness and service comfort after installation.
Comparable CAGRs can still create different market entry conditions across these countries. Deployment timing depends on integration evidence and the ability to support gateway fleets after installation.
The full report provides country-level CAGR analysis across North America and Latin America. Europe and East Asia are also covered. South Asia and Oceania follow alongside the Middle East and Africa.
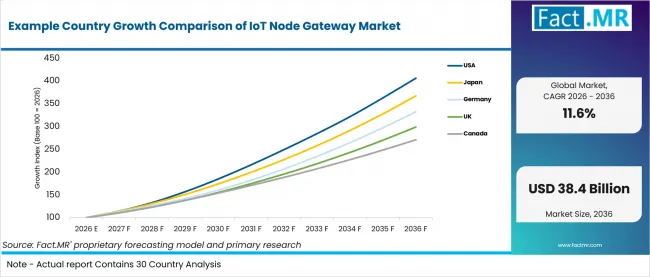
Example Country Growth Comparison Of Iot Node Gateway Market | Source: Fact.MR
| Country | CAGR (2026-2036) |
|---|---|
| USA | 15.1% |
| Japan | 13.9% |
| Germany | 12.8% |
| UK | 11.6% |
| Canada | 10.5% |
| Australia | 9.3% |
| Brazil | 8.1% |
Source: Fact.MR analysis. Updated Jul 29, 2026
What supports USA adoption?
15.1% CAGR, supported by documentation-led buying and direct supplier engagement.
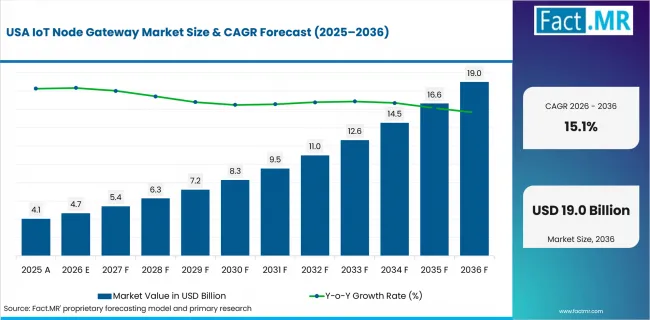
Iot Node Gateway Market Country Value Analysis | Source: Fact.MR
Enterprise buyers in the USA evaluate gateway projects through documentation and support accountability before scaling connected equipment. The market benefits when suppliers explain device identity control and service access in plain terms.
How is Japan building demand?
13.9% CAGR, driven by compact automation needs and reliability-focused approval.
Compact automation sites in Japan place weight on dependable gateway behavior in limited operating footprints. Buyers are expected to favor suppliers that explain firmware control and integration steps before fleets move into production routines.
What shapes Germany demand through 2036?
12.8% CAGR, backed by manufacturing validation and disciplined integration review.
Germany’s industrial buyers compare gateways through performance evidence and process fit. Suppliers are better placed when they show how devices work with installed machinery and support maintenance teams after deployment.
How does the UK convert adoption?
11.6% CAGR, led by supplier support and life-cycle value checks.
UK adoption is expected to advance where buyers compare gateway value against service depth and long-term operating control. Projects move faster when suppliers make update duties and replacement support easy to understand.
What supports Canada demand?
10.5% CAGR, supported by service coverage across spread-out operating sites.
Canadian projects often need dependable support across large operating areas. Gateway suppliers can improve adoption by showing remote maintenance capability and channel reach without adding operating uncertainty.
How is Australia adopting IoT node gateways?
9.3% CAGR, driven by distance-sensitive operations and service dependability.
Australia’s distance-sensitive operations make supplier dependability central to adoption. Remote sites need gateways that can be maintained with limited disruption and supported through practical local channels.
What defines Brazil growth?
8.1% CAGR, backed by distributor-led access and after-sale support needs.
Brazil’s route to growth depends on regional distributors that help buyers judge price and installation readiness. Suppliers that provide training and clear after-sale support are likely to convert more projects beyond trial use.
Who leads the IoT Node Gateway Market?
Cisco Systems Inc. and Advantech Co., Ltd. are among the most visible providers in the IoT node gateway market. Siemens AG broaden the supplier field.
Cisco Systems Inc. supports enterprise networking and connected-infrastructure demand. Advantech Co., Ltd. adds industrial gateway depth for automation settings. Siemens AG contributes industrial automation reach. Huawei Technologies Co., Ltd. and Moxa Inc. strengthen the provider set. Eurotech S.p.A. adds further industrial connectivity exposure.
From 2026 to 2036, competition is expected to depend on gateway reliability and service coverage across mixed equipment environments. Buyers are likely to compare update control and channel support before expanding gateway fleets.
Which companies are the key providers?
Key companies include Cisco Systems Inc.; Advantech Co., Ltd.; Siemens AG; Huawei Technologies Co., Ltd.; Moxa Inc.; and Eurotech S.p.A.
- Cisco Systems Inc.
- Advantech Co., Ltd.
- Siemens AG
- Huawei Technologies Co., Ltd.
- Moxa Inc.
- Eurotech S.p.A.
Bibliography
- Federal Bureau of Investigation. (2025, April 23). FBI releases annual Internet Crime Report.
- National Institute of Standards and Technology. (2026, April 20). Foundational cybersecurity activities for IoT product manufacturers: NIST IR 8259 Revision 1.
- National Institute of Standards and Technology. (2025, November 25). Trusted Internet of Things device network-layer onboarding and lifecycle management: Enhancing Internet Protocol-based IoT device and network security: NIST SP 1800-36.
- Ministry of Economy, Trade and Industry. (2025, May 22). Cybersecurity guidelines for energy resource aggregation business revised. Government of Japan.
This Report Answers
- The report provides strategic intelligence on the IoT Node Gateway Market across Product Type and Application choices that shape connected-equipment projects.
- Segment analysis covers Industrial IoT Gateways and Industrial Automation as the share leaders within the 2026 market structure.
- Country outlook evaluates the USA and Japan alongside Germany and the UK. Canada, Australia and Brazil complete the growth comparison across the profiled markets.
- Competitive analysis profiles Cisco Systems Inc. and Advantech Co., Ltd. alongside Siemens AG. Huawei Technologies Co., Ltd. completes the provider set with Moxa Inc. and Eurotech S.p.A.
- Connectivity assessment covers Wi-Fi and cellular routes alongside LPWAN, Ethernet and short-range wireless options used across gateway deployments.
What does the IoT Node Gateway Market cover?
IoT node gateways connect field devices, machines and enterprise systems where secure data routing and local control matter.
The IoT Node Gateway Market covers commercial activity tied to Industrial IoT Gateways and related configured devices. These devices are used for data capture and system control. Workflow automation and secure digital operations remain inside the use case when the gateway performs the connection role.
The market differs from general networking hardware because commercial value comes from bridging device protocols and supporting lifecycle control. Unrelated corporate IT spending remains outside the boundary. General cloud subscriptions are excluded unless the gateway purchase depends on that deployment.
What is included in the scope?
IoT node gateways are included when they support connected equipment and automation systems. Facility control, healthcare assets and transport operations follow the same gateway-use rule.
The scope includes Product Type and Application. End User and Distribution Channel are included as separate views. Connectivity Technology and Region complete the market scope. It covers Industrial IoT Gateways and Edge Computing Gateways. Rugged IoT Gateways and Wireless IoT Gateways are included where they perform gateway functions. Coverage extends to cloud platforms only when the gateway remains part of the purchasing decision.
What is excluded from the scope?
Unrelated network hardware, general corporate software and adjacent categories outside gateway purchase decisions remain outside the scope.
The scope excludes devices that do not perform gateway functions for connected assets. Standalone routers are excluded unless they are sold as gateway devices for operational data handling. General cybersecurity services and enterprise software remain outside the market boundary when they are not part of a gateway purchase.
How Was the Analysis Built?
The analysis draws on 120+ sources, 35+ company portfolios, 25+ countries, and more than 20 industry interviews.
- Primary Research: Primary research includes discussions with manufacturers, service providers, technology developers, distributors, end users, procurement teams, and subject-matter experts. These conversations examine purchasing priorities, product adoption, operational challenges, approval requirements, competitive positioning, and the factors that influence wider market acceptance.
- Desk Research: Desk research covers government statistics, regulatory publications, company filings, trade data, technical studies, industry associations, standards, public policy, and other authoritative sources. Every source used in the analysis is documented in the bibliography.
- Market Sizing and Forecasting: Market estimates combine historical performance, demand indicators, pricing and volume trends, segment shares, company participation, country-level growth, adoption patterns, investment activity, and barriers to market expansion.
- Data Validation and Update Cycle: Findings are validated by comparing primary interviews with public data, company activity, regulatory changes, trade patterns, and industry developments. Regular updates review new product launches, capacity changes, partnerships, approvals, procurement trends, and shifts in commercial adoption.
Segmentation
What is the report’s scope and coverage?
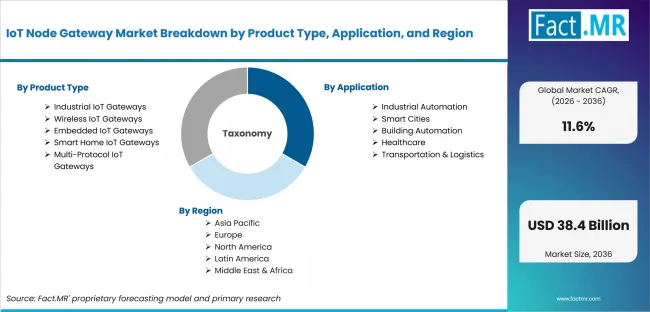
Iot Node Gateway Market Breakdown By Product Type, Application, And Region | Source: Fact.MR
| Attribute | Details |
|---|---|
| Quantitative Units | USD billion in 2026 to USD billion by 2036 at CAGR |
| Market Definition | Commercial buying, supply and use of IoT node gateways that connect sensors, machines and enterprise systems for data capture, system control, workflow automation and secure digital operations |
| Product Type | Industrial IoT Gateways; Edge Computing Gateways; Rugged IoT Gateways; Wireless IoT Gateways; Wi-Fi Gateways; Cellular Gateways; Embedded IoT Gateways; ARM-Based Gateways; x86-Based Gateways; Smart Home IoT Gateways; Zigbee Gateways; Z-Wave Gateways; Multi-Protocol IoT Gateways; LoRaWAN Gateways; Bluetooth Low Energy Gateways |
| Application | Industrial Automation; Smart Manufacturing; Process Automation; Smart Cities; Smart Lighting; Smart Parking; Building Automation; HVAC Management; Security & Surveillance; Healthcare; Remote Patient Monitoring; Medical Asset Tracking; Transportation & Logistics; Fleet Management; Asset Tracking |
| End User | Manufacturing Enterprises; Discrete Manufacturing; Process Manufacturing; IT & Telecommunications; Network Service Providers; Data Center Operators; Government & Municipalities; Smart City Authorities; Public Infrastructure Agencies; Healthcare Organizations; Hospitals; Diagnostic Centers; Transportation Companies; Logistics Providers; Public Transport Operators |
| Distribution Channel | Direct Sales; OEM Sales; Enterprise Contracts; Value-Added Resellers; System Integrators; Channel Partners; Distributors; Regional Distributors; Global Distributors; Online Sales; Manufacturer Websites; B2B E-Commerce Platforms; Managed Service Providers; Cloud Service Providers; IoT Solution Providers |
| Connectivity Technology | Wi-Fi; Wi-Fi 5; Wi-Fi 6/6E; Cellular; 4G LTE; 5G; LPWAN; LoRaWAN; NB-IoT; Ethernet; Gigabit Ethernet; Industrial Ethernet; Short-Range Wireless; Bluetooth Low Energy; Zigbee |
| Regions Covered | North America; Latin America; Europe; East Asia; South Asia and Pacific; Middle East and Africa |
| Countries Covered | USA; Japan; Germany; UK; Canada; Australia; Brazil |
| Key Companies Profiled | Cisco Systems Inc.; Advantech Co., Ltd.; Siemens AG; Huawei Technologies Co., Ltd.; Moxa Inc.; Eurotech S.p.A. |
| Forecast Period | 2026 to 2036 |
| Approach | Hybrid top-down and bottom-up approach using IoT gateway demand; industrial automation programs; secure device management needs; connected-equipment deployment; edge data handling; direct sales activity; regional service coverage; country adoption patterns and company portfolio review |
Source: Fact.MR analysis. Updated Jul 29, 2026
How is the market segmented?
-
By Product Type:
- Industrial IoT Gateways
- Edge Computing Gateways
- Rugged IoT Gateways
- Wireless IoT Gateways
- Wi-Fi Gateways
- Cellular Gateways
- Embedded IoT Gateways
- ARM-Based Gateways
- x86-Based Gateways
- Smart Home IoT Gateways
- Zigbee Gateways
- Z-Wave Gateways
- Multi-Protocol IoT Gateways
- LoRaWAN Gateways
- Bluetooth Low Energy Gateways
-
By Application:
- Industrial Automation
- Smart Manufacturing
- Process Automation
- Smart Cities
- Smart Lighting
- Smart Parking
- Building Automation
- HVAC Management
- Security & Surveillance
- Healthcare
- Remote Patient Monitoring
- Medical Asset Tracking
- Transportation & Logistics
- Fleet Management
- Asset Tracking
-
By End User:
- Manufacturing Enterprises
- Discrete Manufacturing
- Process Manufacturing
- IT & Telecommunications
- Network Service Providers
- Data Center Operators
- Government & Municipalities
- Smart City Authorities
- Public Infrastructure Agencies
- Healthcare Organizations
- Hospitals
- Diagnostic Centers
- Transportation Companies
- Logistics Providers
- Public Transport Operators
-
By Distribution Channel:
- Direct Sales
- OEM Sales
- Enterprise Contracts
- Value-Added Resellers
- System Integrators
- Channel Partners
- Distributors
- Regional Distributors
- Global Distributors
- Online Sales
- Manufacturer Websites
- B2B E-Commerce Platforms
- Managed Service Providers
- Cloud Service Providers
- IoT Solution Providers
-
By Connectivity Technology:
- Wi-Fi
- Wi-Fi 5
- Wi-Fi 6/6E
- Cellular
- 4G LTE
- 5G
- LPWAN
- LoRaWAN
- NB-IoT
- Ethernet
- Gigabit Ethernet
- Industrial Ethernet
- Short-Range Wireless
- Bluetooth Low Energy
- Zigbee
-
By Region:
- North America
- Latin America
- Europe
- East Asia
- South Asia and Oceania
- Middle East and Africa
Frequently Asked Questions
Which Product Type leads the market?
Which Application leads the market?
Which End User leads the market?
Which Distribution Channel leads the market?
Which Connectivity Technology leads the market?
Which country records the highest listed CAGR?
What is the primary driver in this market?
What is the main restraint?
Why do Manufacturing Enterprises lead demand?
Who worked on this report


Preview the report firsthand - request a free sample
Free SampleGet the brochure for pricing and purchase details
Download PDF