- Market Value (2025): USD 651.6 Mn
- Estimated Value (2026): USD 685 Mn
- Forecast Value (2036): USD 1130.0 Mn
- CAGR (2026-2036): 5.1%
What is the Jewelry Display Stands Market forecast to be worth by 2036?
USD 685 million in 2026 to USD 1,130.0 million by 2036 at 5.1% CAGR.
- The jewelry display stands market reached USD 651.6 million in 2025. Demand reflected purchases by independent jewelers and chain retailers.
- Demand is projected to advance from USD 685 million in 2026 to USD 1,130.0 million by 2036.
- The market is forecast to record a 5.1% CAGR from 2026 to 2036 as store refresh work, online content production and replacement purchases continue.
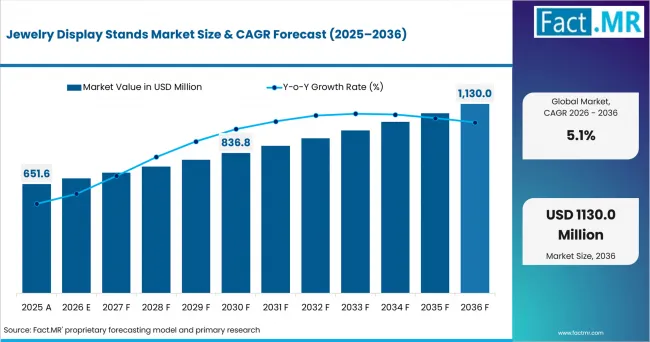
Jewelry Display Stands Market Value Analysis | Source: Fact.MR
What are the defining numbers behind Jewelry Display Stands Market growth?
USD 445 million absolute opportunity by 2036, led by Necklace and bust stands and Velvet/fabric covered products within their respective segments.
- Demand Drivers in the Market
- Necklace busts help retailers show how a necklace falls and where the pendant sits. Flat trays can make the same piece look smaller or less noticeable.
- Independent jewelry stores often use a mix of stands for rings, earrings, bracelets, necklaces, and full sets. This gives them more freedom when arranging different products.
- Online sellers use stands that hold jewelry at the same angle for product photos and short videos. This helps each item look consistent across the catalog.
- Luxury stores often choose custom sizes and finishes so the displays match the store design and packaging style.
- Key Segments Analyzed
- By Display Type: Necklace and bust stands are projected to grow 26.0% share in 2026 because they give necklaces form and vertical scale inside showcases.
- By Material: Velvet/fabric covered is anticipated to hold 31.0% share in 2026 due to low-glare presentation across rings and necklaces.
- By Jewelry Category: Necklaces are estimated to account for 27.0% share in 2026 since pendant position needs upright support.
- By Buyer Type: Independent jewelry stores are forecast to represent 36.0% share in 2026 because owners control counter changes directly.
- By Design Tier: Standard retail is expected to account for 42.0% share in 2026 as catalog formats meet daily merchandising needs.
- Analyst Opinion at Fact.MR
- Shambhu Nath Jha, Senior Analyst at Fact.MR, states, “The commercial value of a display program comes from coordinated fixtures across many small selling points. Fixture makers that help retailers align categories and replace worn pieces are expected to remain useful partners.”
- Strategic Implications
- Retailers can choose display stands by first looking at the type of jewelry they sell and what customers can see clearly inside the case.
- Chain stores benefit from using the same colors, sizes, and finishes across all locations. Visible differences can make the full display look uneven.
- Display makers can create matching sets for necklaces and earrings, then add bracelet and ring stands in the same style.
- Materials described as sustainable are best used only when the company can provide clear proof and explain how worn displays will be replaced.
The United States is expected to register a 6.1% CAGR from 2026 to 2036 supported by demand from independent jewelers, retail chains, online sellers, and exhibitions across standard and portable display formats. The United Arab Emirates is projected to record a 5.3% CAGR through 2036 as destination retail and luxury stores place greater attention on presentation. The United Kingdom remains supported by resale activity and luxury display needs. France and Italy continue to create demand through boutique jewelry stores and carefully designed product presentation.
How does the Jewelry Display Stands Market break down by segment?
Necklace and bust stands lead at 26.0% by Display Type, while Velvet/fabric covered products lead at 31.0% by Material in 2026.
Which Display Type dominates?
Necklace and Bust Stands hold 26.0% share in 2026.
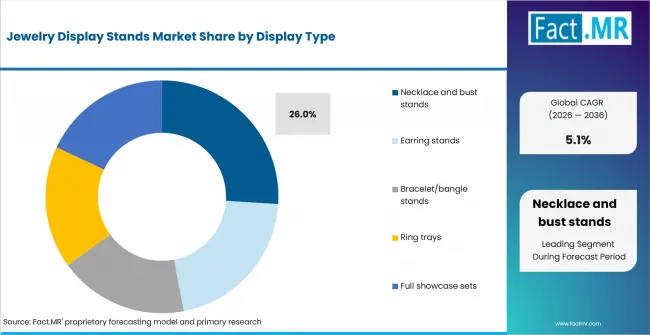
Jewelry Display Stands Market Analysis By Display Type | Source: Fact.MR
Necklace and bust stands lead because they show chain length, pendant position, and overall fall more clearly than flat trays. The upright shape helps customers judge how a necklace may look when worn, which improves presentation at counters, in windows, and during exhibitions. Their fit across everyday pieces and higher-value jewelry gives this format the strongest position within the display-type segment.
What leads the Material segment?
Velvet/Fabric-Covered Products account for 31.0% share in 2026.
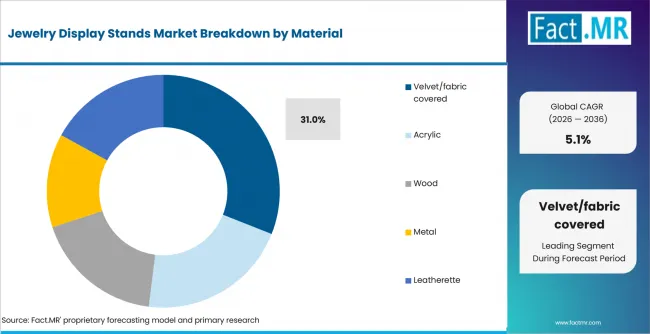
Jewelry Display Stands Market Analysis By Material | Source: Fact.MR
Velvet and fabric-covered stands remain popular because their soft surfaces reduce harsh reflections under display lighting and make polished metals or gemstones easier to see. They also protect jewelry from scratches during handling and daily store use. Retailers can match different fabric shades with store interiors or product collections, giving these stands both a practical role and a strong visual advantage.
Which Jewelry Category creates the most demand?
Necklaces represent 27.0% share in 2026.
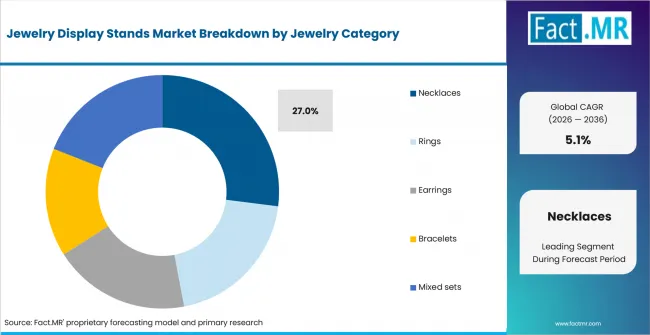
Jewelry Display Stands Market Analysis By Jewelry Category | Source: Fact.MR
Necklaces create the most demand because their shape and length require more support than smaller jewelry pieces. A fitted stand keeps the chain open and places the pendant at the correct height, allowing customers to view the complete design without touching it. This makes necklace displays useful for showcases, windows, exhibitions, sales counters, and product photography across many retail formats.
Which Buyer Type leads the market?
Independent Jewelry Stores hold 36.0% share in 2026.
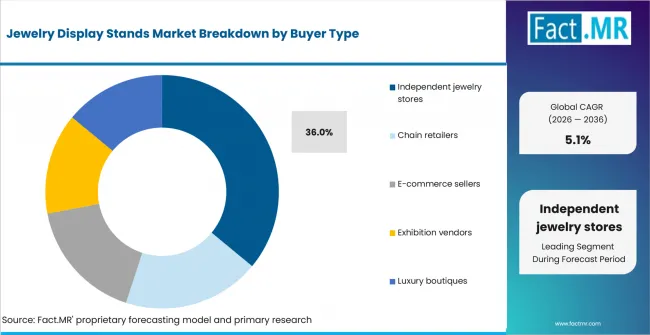
Jewelry Display Stands Market Analysis By Buyer Type | Source: Fact.MR
Independent jewelry stores lead because display choices are often made directly by owners or store managers. These retailers change windows, counters, and product groupings to match new collections or seasonal sales. They also buy several stand styles in smaller quantities instead of following one fixed store-wide format. This flexible purchasing pattern creates steady demand across standard display products.
What leads the Design Tier segment?
Standard Retail Products account for 42.0% share in 2026.
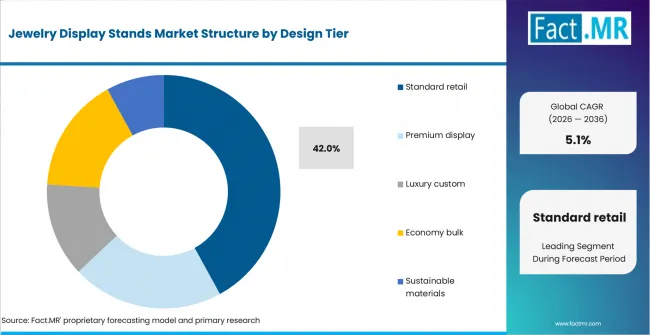
Jewelry Display Stands Market Analysis By Design Tier | Source: Fact.MR
Standard retail displays cover most daily presentation needs without the higher cost and longer planning involved in custom designs. Stores can use them for rings, necklaces, earrings, bracelets, and mixed sets across counters and showcases. They are easy to source, replace, and rearrange when collections change, which makes them the most practical choice for a wide range of jewelry sellers.
What is accelerating Jewelry Display Stands Market adoption, and what is holding it back?
Coordinated presentation systems are expected to lift adoption, while catalog commoditization and replacement inconsistency restrain premium conversion.
Drivers Impact Analysis
| DRIVER | (~) % IMPACT ON CAGR | GEOGRAPHIC RELEVANCE | IMPACT TIMELINE |
|---|---|---|---|
| Store format expansion | +0.8% | United States and Europe. United Arab Emirates is included. | Medium term (2-4 years) |
| Collection-level merchandising | +0.7% | Global jewelry retail | Short term (<= 2 years) |
| Digital selling workflows | +0.6% | United States and Europe. Cross-border e-commerce hubs are included. | Short term (<= 2 years) |
| Exhibition mobility | +0.5% | Regional jewelry trade hubs | Medium term (2-4 years) |
| Boutique differentiation | +0.4% | Italy and luxury retail centers | Long term (>= 4 years) |
Source: Fact.MR analysis. Updated Jul 17, 2026
- Store format expansion: New counters and boutique renovations require display sets before jewelry reaches the selling floor.
- Collection-level merchandising: Retailers group jewelry by occasion or metal color. Coordinated heights and surfaces are expected to help cases read clearly.
- Digital selling workflows: Catalog images and livestreams require repeatable jewelry angles under lights and cameras.
- Exhibition mobility: Traveling vendors need stands that pack safely and rebuild quickly on small booth tables.
- Boutique differentiation: Premium stores in Italy and luxury centers are expected to value custom proportion and material continuity.
Opportunity Impact Analysis
| OPPORTUNITY | (~) % IMPACT ON CAGR | GEOGRAPHIC RELEVANCE | IMPACT TIMELINE |
|---|---|---|---|
| Cross-category modular sets | +0.4% | Independent jewelers and chains | Medium term (2-4 years) |
| Content-ready finishes | +0.4% | E-commerce sellers worldwide | Short term (<= 2 years) |
| Replaceable surface systems | +0.3% | Europe and North America | Long term (>= 4 years) |
| Small-batch customization | +0.3% | Italy and France. United Arab Emirates is included. | Medium term (2-4 years) |
Source: Fact.MR analysis. Updated Jul 17, 2026
- Cross-category modular sets: Shared bases and matching surfaces are expected to let jewelers rebuild cases without replacing every fixture.
- Content-ready finishes: Low-glare surfaces are projected to reduce image preparation work for online sellers.
- Replaceable surface systems: Removable sleeves and face panels are anticipated to extend the working life of core display pieces.
- Small-batch customization: Boutiques are expected to use selective customization when a new collection needs a distinct counter language.
Restraints Impact Analysis
| RESTRAINT | (~) % IMPACT ON CAGR | GEOGRAPHIC RELEVANCE | IMPACT TIMELINE |
|---|---|---|---|
| Catalog commoditization | -0.4% | Global online channels | Short term (<= 2 years) |
| Matching-replacement risk | -0.3% | Chains and established retail stores | Medium term (2-4 years) |
| Bulky storage and transport | -0.2% | Exhibition and seasonal retail | Short term (<= 2 years) |
| Long structural life | -0.2% | Established retail networks | Long term (>= 4 years) |
Source: Fact.MR analysis. Updated Jul 17, 2026
- Catalog commoditization: Standard acrylic and fabric stands are easy to compare online. Price and freight often influence smaller orders after products look interchangeable.
- Matching-replacement risk: Dye lots and stand proportions differ between production runs. That variation is expected to disrupt established cases.
- Bulky storage and transport: Busts and rigid stands take storage space even when they are light enough for frequent movement.
- Long structural life: Stores are anticipated to delay replacement when a stand remains usable despite worn covers or dated colors.
Which countries set the tone for jewelry display purchases?
United States 6.1%; United Arab Emirates 5.3%; United Kingdom 5.2%; France 5.1%; Italy 5.0%.
Regional analysis covers North America, Europe and the Middle East & Africa. Country sections emphasize markets where jewelry retail, destination shopping or boutique presentation requirements are visible demand signals.
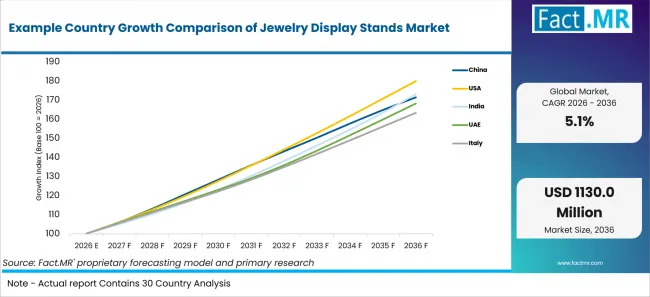
Example Country Growth Comparison Of Jewelry Display Stands Market | Source: Fact.MR
| COUNTRY | CAGR |
|---|---|
| United States | 6.1% |
| United Arab Emirates | 5.3% |
| United Kingdom | 5.2% |
| France | 5.1% |
| Italy | 5.0% |
Source: Fact.MR analysis. Updated Jul 17, 2026
What supports the United States outlook?
6.1% CAGR, supported by store upgrades, online selling, and trade-show activity.
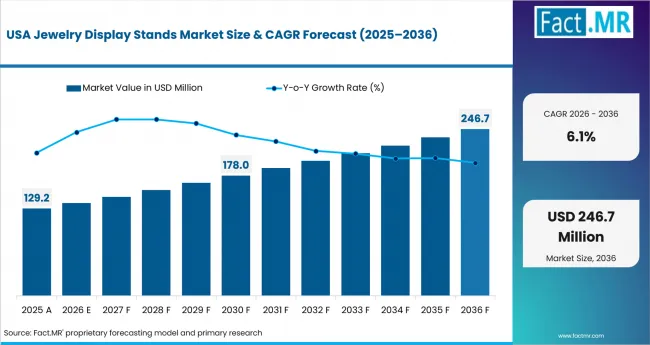
Jewelry Display Stands Market Country Value Analysis | Source: Fact.MR
The United States has several sales routes, including independent jewelers, retail chains, online stores, and temporary exhibition booths. Each channel uses displays differently. Stores need coordinated counter sets, while online sellers use stands for photography and customer appointments. Demand is expected to grow at a 6.1% CAGR by 2036 as sellers refresh displays for new collections and seasonal promotions.
Why is the United Arab Emirates advancing faster than several European markets?
5.3% CAGR, driven by destination shopping and premium jewelry presentation.
Jewelry stores in the United Arab Emirates often operate close to competing sellers in malls, gold markets, and shopping districts. Displays therefore play a direct role in drawing attention and separating one store from another. The market is projected to record a 5.3% CAGR from 2026 to 2036 as retailers invest in bright showcases and coordinated counter arrangements.
How is the United Kingdom supporting display-stand demand?
5.2% CAGR, supported by online selling and frequent assortment changes.
The United Kingdom market includes traditional jewelers, resale businesses, online stores, and sellers focused on affordable fine jewelry. These companies often rotate rings, earrings, and necklaces in response to changing styles and seasonal demand. The market is anticipated to expand at a 5.2% CAGR through 2036 as compact stands support store displays, product photography, appointments, and packing areas.
What keeps France relevant in the market?
5.1% CAGR, backed by design-led jewelry houses and carefully planned stores.
French jewelry stores often match display materials with the style of each collection. Fabric, shape, height, and spacing are selected to support the jewelry and the wider store design. France is estimated to record a 5.1% CAGR from 2026 to 2036 as luxury houses and independent jewelers continue to favor coordinated stands made to fit their presentation needs.
How does Italy fit the Jewelry Display Stands Market?
5.0% CAGR, linked to boutique retail and jewelry shown at international events.
Italian jewelry companies often present the same collection in boutiques, distributor meetings, and exhibition booths. This creates demand for display sets that are easy to carry but still protect the intended brand look. Italy is forecast to post a 5.0% CAGR through 2036 as manufacturers and sellers use portable stands that work across several sales settings.
Who leads the Jewelry Display Stands Market?
Kling and Displays2go lead custom and online display routes, while Westpack and Rio Grande add adjacent channel coverage.
Kling brings coordinated jewelry case and presentation work for retailers that need consistent surface and case language. Displays2go supports online access to standard display products, which helps smaller stores replace common formats quickly. Westpack adds custom point-of-purchase experience for branded retail presentation projects.
Rio Grande provides jewelry supply channel access that includes display and packaging adjacency for professional jewelers. Competition is expected to center on replacement speed, material consistency and the ability to coordinate several display formats inside one retail setting.
Which companies are the key providers?
Kling and Displays2go are key providers. Westpack and Rio Grande are also profiled.
- Kling
- Displays2go
- Westpack
- Rio Grande
Bibliography
- U.S. Census Bureau. (2026, June 17). Advance monthly sales for retail and food services: May 2026. The official release page confirms the title, date, and May 2026 reporting period.
- Kling GmbH. (n.d.). Jewellery Display
- Displays2Go. (n.d.). Jewelry Display Cases.
- Westpack. (n.d.). Jewellery Trays
- Gem & Jewellery Export Promotion Council. (2026, January 5). IIJS Bharat–Signature 2026 to open the global jewellery business calendar as the first trade fair of the year.
- Hong Kong Trade Development Council. (2025, March 9). Twin jewellery shows attract over 82,000 global buyers.
This Report Addresses
- The report provides strategic intelligence on Jewelry Display Stands across Display Type and Material choices that shape retail presentation programs.
- Segment analysis covers Necklace and bust stands and Velvet/fabric covered products as the share within the 2026 market structure.
- Regional outlook evaluates the United States and the United Arab Emirates alongside the United Kingdom, France and Italy.
- Competitive analysis profiles Kling and Displays2go alongside Westpack and Rio Grande.
- Display-type assessment covers Necklace and bust stands and Earring stands. Ring trays, Bracelet/bangle stands and Full showcase sets complete the format review.
- Buyer assessment covers Independent jewelry stores and Chain retailers. E-commerce sellers, Exhibition vendors and Luxury boutiques complete the manufacturers review.
What does the Jewelry Display Stands Market cover?
Necklace and bust stands, Earring stands and Ring trays used for jewelry presentation. Bracelet/bangle stands and Full showcase sets complete the display-type scope.
The Jewelry Display Stands Market covers commercial fixtures designed to hold and arrange jewelry across retail counters. Exhibition booths and image-production settings are also included. Coverage includes display products used for necklaces and rings. Earrings, bracelets and mixed sets are also covered across standard and custom design tiers.
The market differs from store furniture because commercial value comes from jewelry-specific presentation and product visibility. Complete glass showcases and lighting systems remain outside the boundary unless sold as part of a display-stand program. Gift boxes and pouches remain outside standalone display-stand coverage.
What is included in the scope?
Jewelry display fixtures used in retail, exhibition and image-production environments are included in scope.
The scope includes Necklace and bust stands and Earring stands. Ring trays, Bracelet/bangle stands and Full showcase sets complete the display-type coverage. Coverage spans Velvet/fabric covered and Acrylic products. Wood, Metal and Leatherette products are also included. Buyer coverage includes Independent jewelry stores and Chain retailers. E-commerce sellers, Exhibition vendors and Luxury boutiques complete the buyer set. Design Tier coverage includes Standard retail and Premium display. Economy bulk, Luxury custom and Sustainable materials complete the design-tier set.
What is excluded from the scope?
Store architecture, jewelry packaging and household organizers are outside the market boundary.
The scope excludes complete glass showcases and store counters. Lighting systems and signage are also excluded. Security hardware, gift boxes and pouches are outside the scope as well. Dedicated ring-only products are outside this multi-category market when they are sold as separate product markets. Repair and reupholstery services sold alone are also excluded because the revenue pool covers new display stand sales.
How Was the Analysis Built?
The analysis draws on 120+ sources, 35+ company portfolios, 25+ countries, and more than 20 industry interviews.
- Primary Research: Primary research includes discussions with manufacturers, service providers, technology developers, distributors, end users, procurement teams, and subject-matter experts. These conversations examine purchasing priorities, product adoption, operational challenges, approval requirements, competitive positioning, and the factors that influence wider market acceptance.
- Desk Research: Desk research covers government statistics, regulatory publications, company filings, trade data, technical studies, industry associations, standards, public policy, and other authoritative sources. Every source used in the analysis is documented in the bibliography.
- Market Sizing and Forecasting: Market estimates combine historical performance, demand indicators, pricing and volume trends, segment shares, company participation, country-level growth, adoption patterns, investment activity, and barriers to market expansion.
- Data Validation and Update Cycle: Findings are validated by comparing primary interviews with public data, company activity, regulatory changes, trade patterns, and industry developments. Regular updates review new product launches, capacity changes, partnerships, approvals, procurement trends, and shifts in commercial adoption.
Segmentation
What is the report’s scope and coverage?
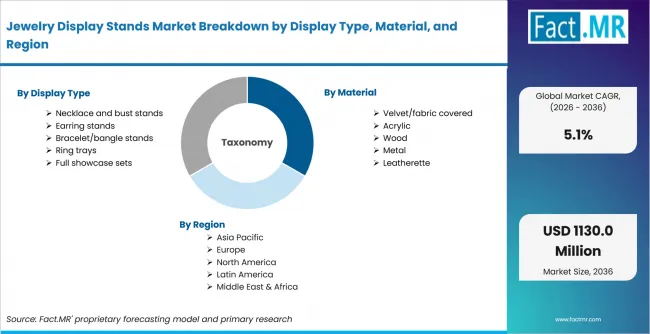
Jewelry Display Stands Market Breakdown By Display Type, Material, And Region | Source: Fact.MR
| Attribute | Details |
|---|---|
| Quantitative Units | USD Million in 2026 to USD Million by 2036 at CAGR |
| Market Definition | Commercial stands, trays, busts and coordinated presentation fixtures designed to display jewelry across stores, booths and image-production settings |
| Display Type | Necklace and bust stands; Earring stands; Ring trays; Bracelet/bangle stands; Full showcase sets |
| Material | Velvet/fabric covered; Acrylic; Wood; Metal; Leatherette |
| Jewelry Category | Necklaces; Rings; Earrings; Bracelets; Mixed sets |
| Buyer Type | Independent jewelry stores; Chain retailers; E-commerce sellers; Exhibition vendors; Luxury boutiques |
| Design Tier | Standard retail; Premium display; Economy bulk; Luxury custom; Sustainable materials |
| Regions Covered | North America; Europe; Asia Pacific; Latin America; Middle East and Africa |
| Countries Covered | United States; United Arab Emirates; United Kingdom; France; Italy |
| Key Companies Profiled | Kling; Displays2go; Westpack; Rio Grande |
| Forecast Period | 2026 to 2036 |
| Approach | Hybrid top-down and bottom-up approach using retail activity and jewelry-channel evidence. Display-product availability, buyer-type mix and country-level demand signals inform the estimate. |
Source: Fact.MR analysis. Updated Jul 17, 2026
How is the market segmented?
-
Display Type
- Necklace and bust stands
- Earring stands
- Ring trays
- Bracelet/bangle stands
- Full showcase sets
-
By Material
- Velvet/fabric covered
- Acrylic
- Wood
- Metal
- Leatherette
-
By Jewelry Category
- Necklaces
- Rings
- Earrings
- Bracelets
- Mixed sets
-
By Buyer Type
- Independent jewelry stores
- Chain retailers
- E-commerce sellers
- Exhibition vendors
- Luxury boutiques
-
By Design Tier
- Standard retail
- Premium display
- Economy bulk
- Luxury custom
- Sustainable materials
-
By Region
- North America
- United States
- Canada
- Europe
- United Kingdom
- France
- Italy
- Germany
- Middle East & Africa
- United Arab Emirates
- Saudi Arabia
- South Africa
- North America
Frequently Asked Questions
Which display type is largest?
Which material leads jewelry display stands?
Which jewelry category generates the most demand?
Who is the largest buyer group?
Which design tier leads?
Which country records the highest CAGR in the Jewelry Display Stands Market?
What is the primary driver in the Jewelry Display Stands Market?
What is the main restraint in the Jewelry Display Stands Market?
Why do independent jewelry stores dominate demand?
Who worked on this report


Preview the report firsthand - request a free sample
Free SampleGet the brochure for pricing and purchase details
Download PDF